Blog

  • Keltner Channel Strategy Backtest: the Band Breakout That Only Pays on Clean Trends

    Keltner Channel Strategy Backtest: the Band Breakout That Only Pays on Clean Trends

    The Keltner Channel wraps price in a volatility envelope: an EMA in the middle, with an upper and lower band set a multiple of the ATR away. The breakout rule taught with it is simple — close above the upper band, go long; close below the lower band, go short — on the logic that leaving the channel signals a real move. Bollinger’s cousin, essentially, but built on ATR. So does breaking the Keltner band make money on crypto? We ran the EMA(20) ± 2×ATR breakout through the 7-Gate Protocol across six axes. Verdict: reject.

    Methodology

    • Data: Binance spot, Jul 2024–Jul 2026 (2 years), BTC/ETH/SOL/BNB/XRP
    • Timeframes: 5m–1D (9 buckets, incl. resampled)
    • Execution: EMA(20), bands at ±2×ATR; close beyond a band flips the position; closed-bar, no look-ahead
    • Friction: 0.06%/side (real); 0-fee gross reported too. Benchmark: buy & hold
    • Six axes: timeframe, band multiplier, TP:SL, multi-coin, yearly, out-of-sample

    Gate 0 — Fidelity

    Standard Keltner: a 20-period EMA of close, with upper/lower bands at the EMA ± 2×ATR(20). Long on a close above the upper band, short on a close below the lower. Reproduced exactly (pass).

    The Exact Rules

    • Signal: close > upper band → long; close < lower band → short (stop-and-reverse, hold inside the channel)
    • Default: EMA 20, multiplier 2.0
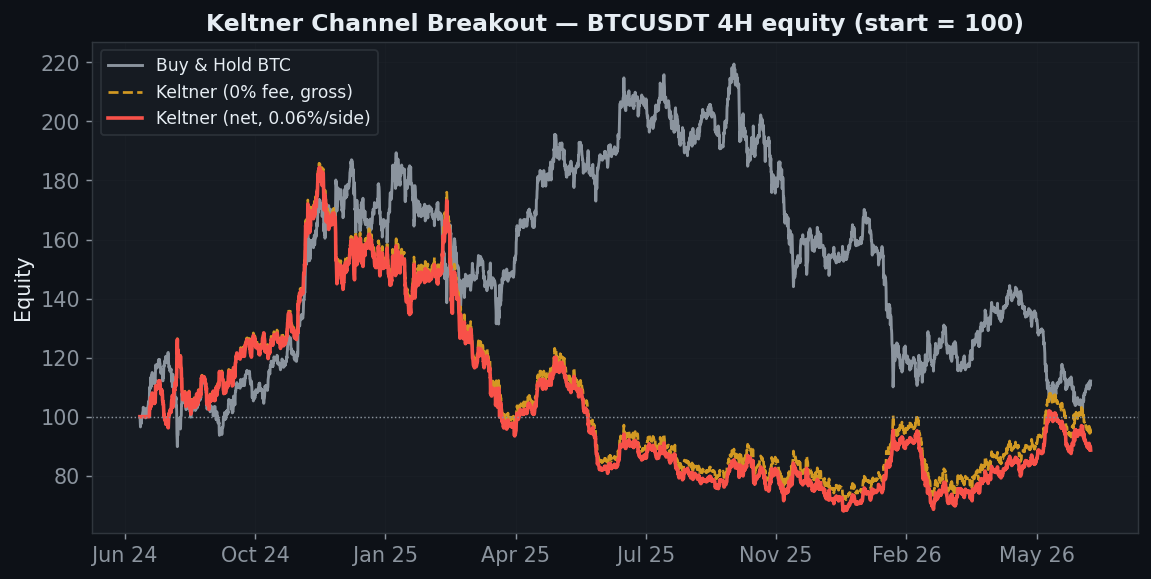
    Keltner channel breakout BTC 4H equity minus 11 net, gross minus 6, no edge, buy and hold plus 12

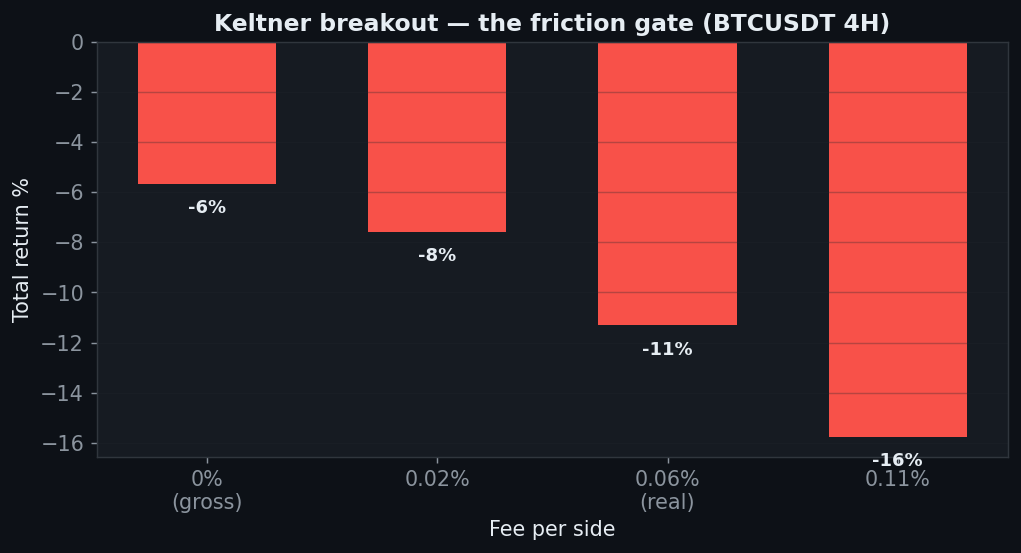
    BTC 4H ends at −11% against buy & hold’s +12%. The gross (0-fee) line is −6% — barely any edge before costs. As with every breakout on this site, the problem is what happens when the market isn’t trending.

    Why It Bleeds: Chop Inside the Band

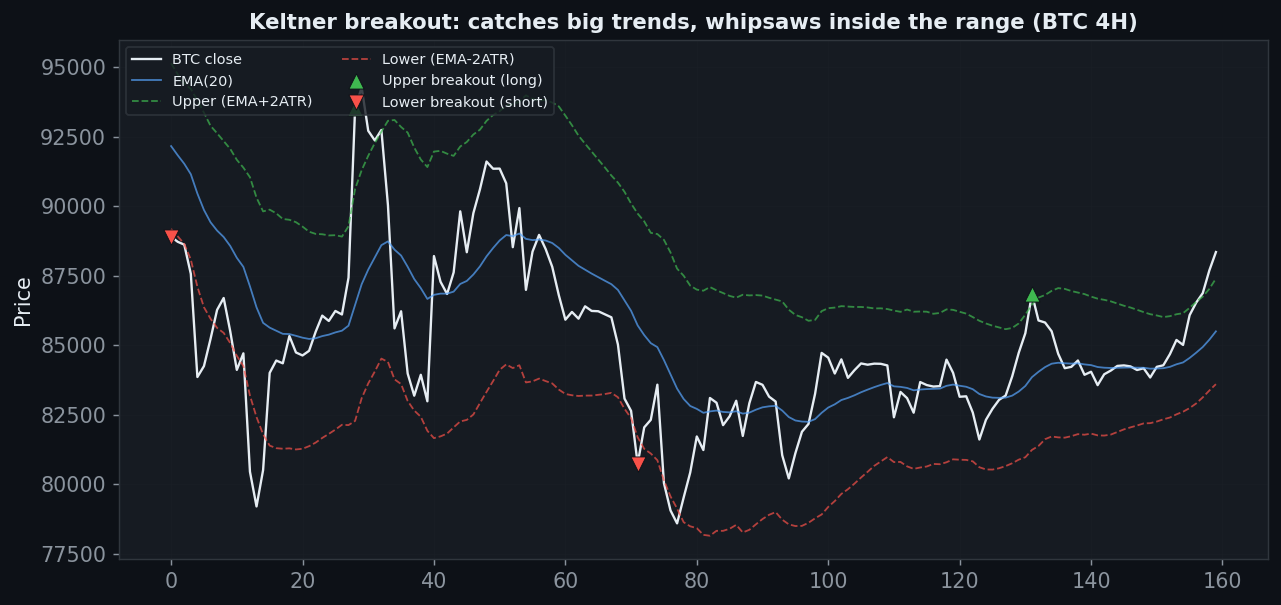
    Keltner channel EMA and 2 ATR bands on BTC 4H, breakouts whipsaw inside the range, catch big trends

    The Keltner breakout has the same Achilles’ heel as Donchian: when price ranges, it repeatedly pokes just past a band, fires a trade, and slips back inside — a whipsaw. It only earns when a market makes a big, clean, sustained move that rides along a band. The 4H curve on BTC, which chopped as much as it trended, is the result: a slow bleed.

    Axis 1 — Timeframe (gross vs net)

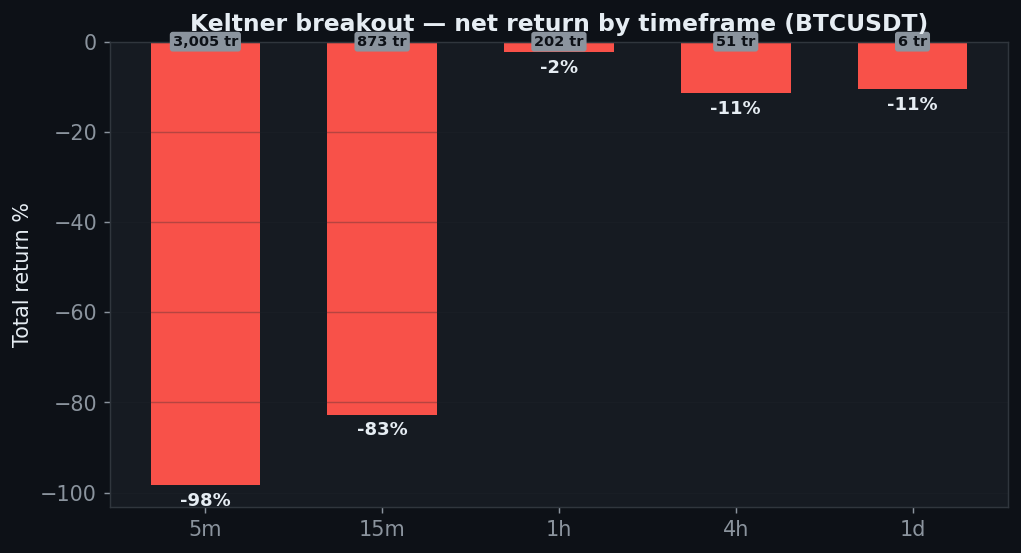
    Timeframe Trades Gross (0 fee) Net (real)
    5m 3,005 −39% −98%
    15m 873 −51% −83%
    30m 454 −33% −60%
    1h 202 +25% −2%
    2h 110 −21% −31%
    4h 51 −6% −11%
    6h 36 −31% −34%
    12h 20 +79% +76%
    1D 6 −10% −11%

    The five main timeframes are net-negative. There’s a bright spot on the 12-hour (+76%), but it rests on just 20 trades — a small-sample curiosity, not a system. The 5-minute vaporises at −98%.

    Keltner net return by timeframe five main negative, 5 minute minus 98

    Axis 2 — Band Multiplier (parameter)

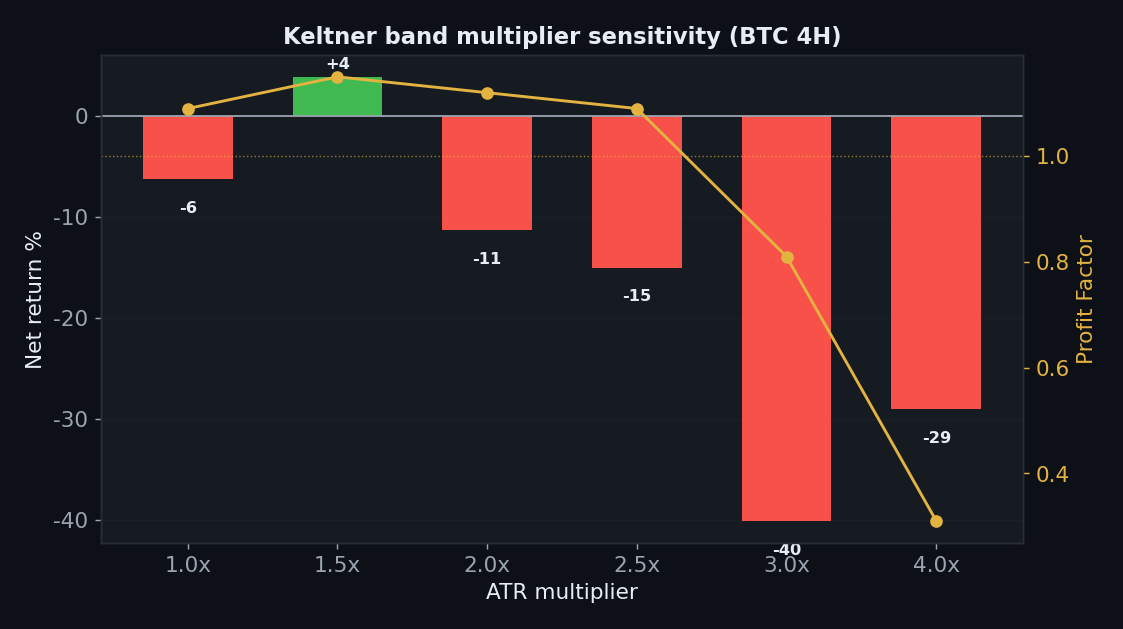
    ATR multiplier Net PF
    1.0 −6% 1.09
    1.5 +4% 1.15
    2.0 (default) −11% 1.12
    2.5 −15% 1.09
    3.0 −40% 0.81
    4.0 −29% 0.31

    Only the 1.5× band scrapes a positive +4%; the default 2.0× loses, and wider bands (3×, 4×) lose badly. The edge, such as it is, lives at one narrow setting — not the plateau a robust strategy shows.

    Keltner band multiplier sensitivity, only 1.5x positive, default 2x and wider lose

    Axis 3 — TP:SL

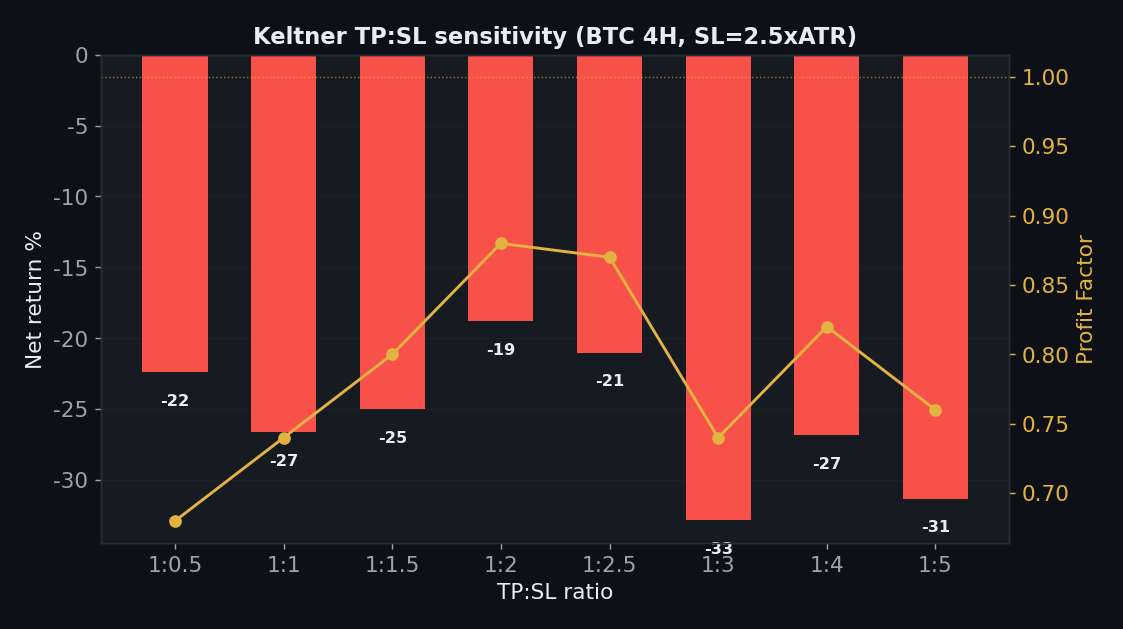
    TP:SL Net PF
    1:0.5 −22% 0.68
    1:1 −27% 0.74
    1:1.5 −25% 0.80
    1:2 −19% 0.88
    1:2.5 −21% 0.87
    1:3 −33% 0.74
    1:4 −27% 0.82
    1:5 −31% 0.76

    No take-profit setting rescues it — every ratio loses 19–33% with a profit factor below 0.9. There’s no gross edge for a stop/target scheme to protect.

    Keltner TP:SL sensitivity every ratio loses 19 to 33 percent

    Axis 4 — Five Coins

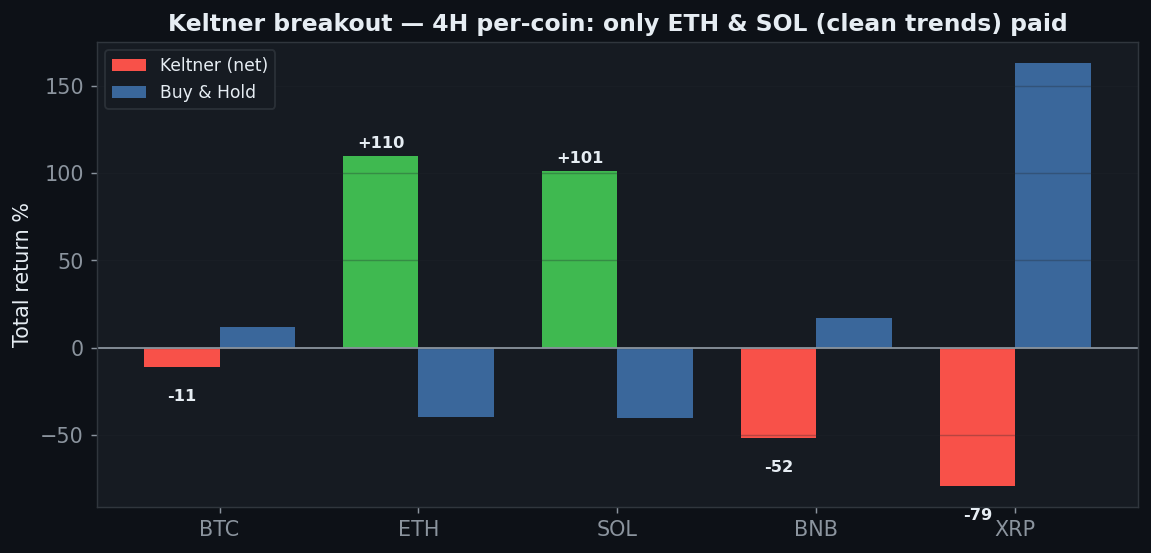
    Coin Keltner net Buy & Hold Note
    BTC −11% +12% chopped
    ETH +110% −40% shorted the downtrend
    SOL +101% −40% shorted the downtrend
    BNB −52% +17% chopped
    XRP −79% +163% whipsawed

    This row is revealing. Keltner made +110% on ETH and +101% on SOL — both coins that fell ~40% over the period. It profited by shorting their clean downtrends. But on the choppier BTC and BNB it lost, and on XRP — which trended up hard — it was whipsawed to −79%. So it isn’t “2 of 5 coins work”; it’s “breakouts pay only where a big clean trend exists,” which you can’t know in advance.

    Keltner five coins 4H, ETH plus 110 SOL plus 101 from shorting downtrends, BTC BNB XRP lose

    Axis 5 — Yearly

    Year BTC 4H net
    2024 +60%
    2025 −57%
    2026 (to Jul) +30%

    2024 (+60%) and 2026 (+30%) look strong, but 2025’s −57% wipes them out on the full sample. Extreme regime dependence — great in trending years, destroyed in the choppy one.

    Axis 6 — Friction & Out-of-Sample

    Keltner friction gate minus 6 gross to minus 11 net BTC 4H

    Friction (BTC 4H): −6% gross → −11% net. Out-of-sample, 2 of 5 coins stay positive — the same clean-trend coins — while the majors don’t. There’s no edge that generalizes across markets and regimes.

    The Verdict: REJECT

    • Gate 0 — Indicator fidelitypass (EMA(20) ± 2×ATR Keltner Channel)
    • Gate 1 — Sanitypass (signal on the closed bar, no look-ahead)
    • Gate 2 — Frictionfail (−6% at zero fees on 4H, −11% net; 5m → −98%)
    • Gate 3 — Yearly consistencyfail (2024 +60 / 2025 −57 / 2026 +30 — 2025 wipes out the total)
    • Gate 4 — Out-of-samplefail (2 of 5 coins positive, the clean-trend ones)
    • Gate 5 — Robustnessfail (only the 1.5× band positive; every TP:SL loses)
    • Gate 6 — Multi-marketfail (2 of 5; profits only where a big clean trend existed, e.g. shorting ETH/SOL)
    • Gate 7 — vs Buy & Holdfail (0 of 5 timeframes beat holding)

    Keltner is another breakout with no trend to break into. Leaving the volatility band is only a good signal when a clean, sustained move follows — which is why it printed +110% shorting ETH’s downtrend and lost on choppy BTC. On the majors, price pokes past the band and slips back, over and over, for a slow bleed. Its edge lives at one band width and one kind of market, evaporates in 2025, and doesn’t beat holding on any timeframe. As the taught band-breakout rule, Keltner is a reject.

    FAQ

    Keltner is meant for pullbacks/mean-reversion, not breakouts.
    The band breakout is the most commonly taught Keltner trade, so that’s what we measured. A pullback (fade back to the EMA) is a different, opposite rule and would need its own six-gate test.

    It made +110% on ETH though.
    By shorting a coin that fell 40% — a single clean downtrend. It lost on BTC, BNB and XRP. Profiting only where a big clean trend happened to exist is trend-luck, and the yearly (−57% in 2025) and out-of-sample gates confirm it doesn’t generalize.

    Can I replicate this?
    Yes — Keltner EMA(20) ± 2×ATR breakout, public Binance data, 0.06%/side, five coins, nine timeframes. Every table reproduces.

    See also: Donchian / Turtle, Bollinger reversion, Triple SuperTrend, UT Bot, and the conditional passes VWAP and Ichimoku (daily).


    Disclaimer: educational research, not financial advice. Past performance does not guarantee future results. Never trade money you cannot afford to lose.
  • Aroon Strategy Backtest: the Backtest That Looked Like a Winner (and Why It Lied)

    Aroon Strategy Backtest: the Backtest That Looked Like a Winner (and Why It Lied)

    After a long run of clean failures, Aroon looks like the exception. Tushar Chande’s 1995 trend indicator — Aroon Up and Aroon Down, measuring how recently price made a new high or low — traded as a simple crossover (long when Up is above Down, short when Down is above Up) produces a genuinely tempting backtest: +18.5% on BTC 4H net of fees, +29% on the daily, beating buy & hold on 3 of 5 coins. It passes the friction gate that kills most strategies. So is this finally a winner? We ran it through all six axes. Verdict: reject — and it’s the most important case on the site, because it shows exactly how a good-looking backtest lies.

    Methodology

    • Data: Binance spot, Jul 2024–Jul 2026 (2 years), BTC/ETH/SOL/BNB/XRP
    • Timeframes: 5m–1D (9 buckets, incl. resampled)
    • Execution: Aroon(14) on the closed bar, no look-ahead; long when Aroon Up > Aroon Down, short when Down > Up
    • Friction: 0.06%/side (real); 0-fee gross reported too. Benchmark: buy & hold
    • Six axes: timeframe, period, TP:SL, multi-coin, yearly, out-of-sample

    Gate 0 — Fidelity

    Standard Aroon(14): Aroon Up = 100 × (periods since the 14-bar high subtracted from 14) / 14, and the mirror for Down. Long on the Up/Down crossover, short on the reverse. Reproduced exactly (pass).

    The Part That Looks Great

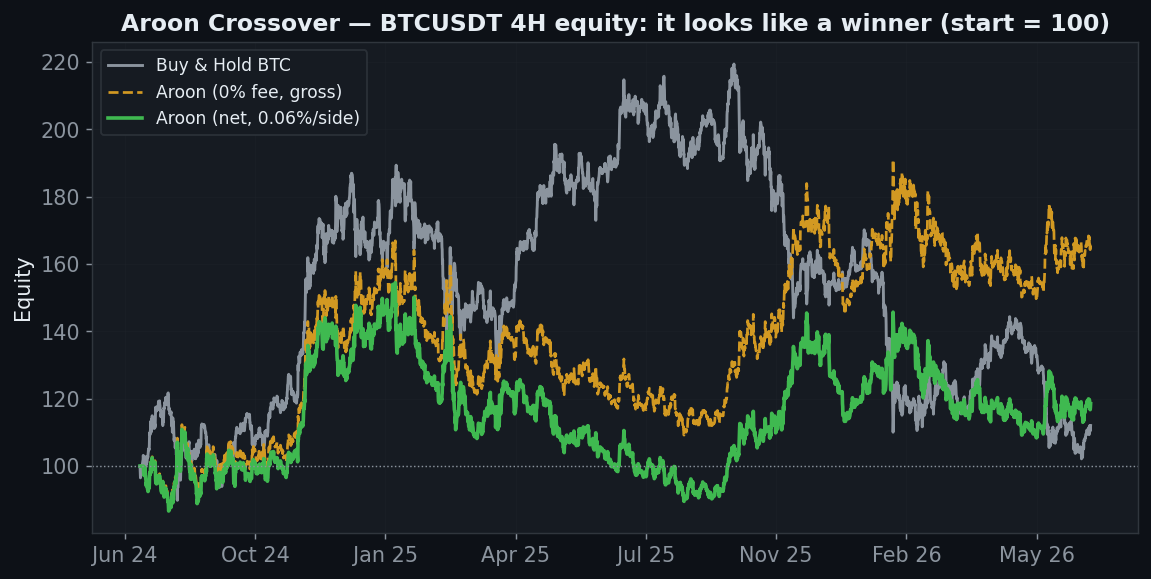
    Aroon crossover BTC 4H equity climbs, plus 18.5 net, looks like a winner, beats buy and hold

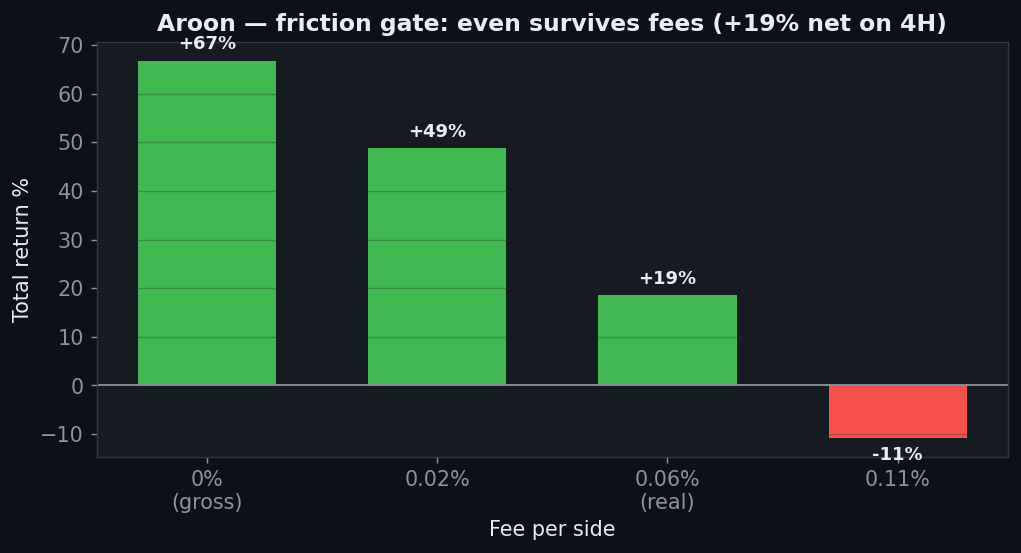
    Unlike almost everything else on this site, the BTC 4H equity curve climbs. Net of real fees it ends +18.5%, ahead of buy & hold’s +12%. And the friction gate — the graveyard of momentum strategies — is passed comfortably: +67% gross, +19% net. On the higher timeframes it looks like a real trend-following edge.

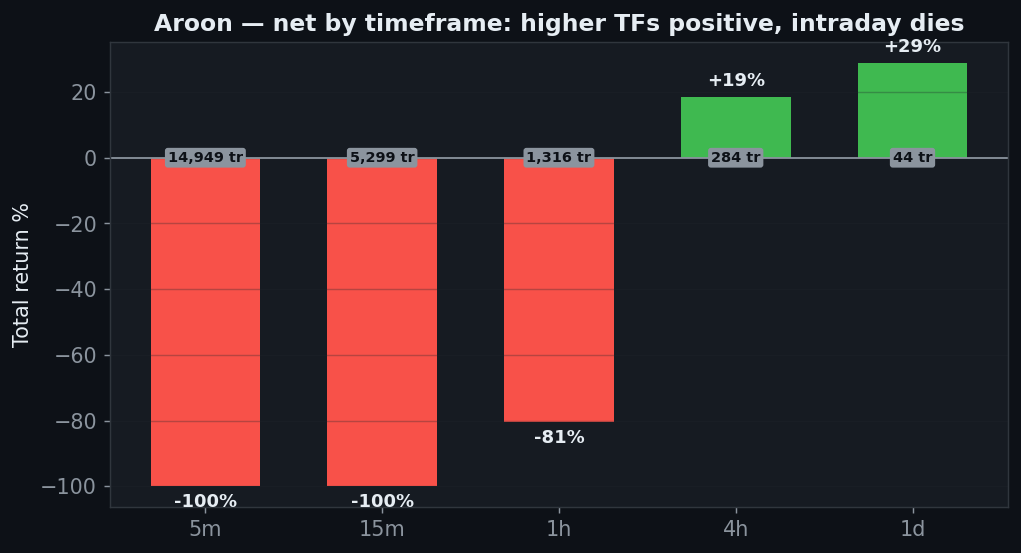
    Aroon net by timeframe, higher timeframes 4h 12h daily positive, intraday negative
    Timeframe Gross (0 fee) Net (real)
    5m −62% −100%
    15m −65% −100%
    30m −45% −98%
    1h −6% −81%
    2h −10% −57%
    4h +67% +19%
    6h −38% −51%
    12h +63% +45%
    1D +36% +29%

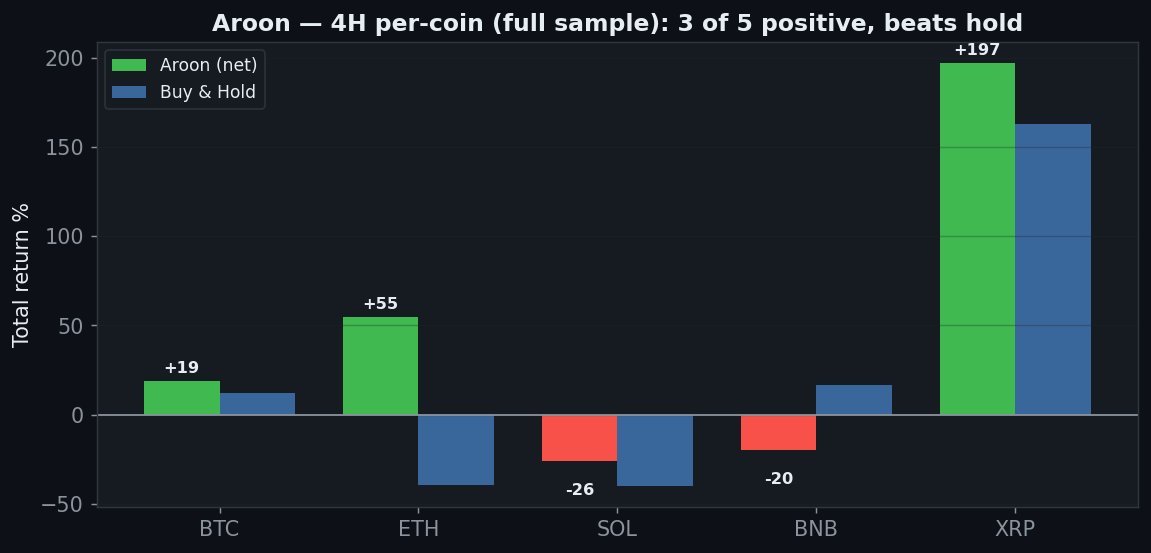
    The daily is +29%, the 12-hour +45%. On 4H, three of five coins are net-positive (BTC +18%, ETH +55%, XRP +197%). If we stopped here, we’d call it a conditional pass. But two gates exist precisely to stop us from stopping here.

    Aroon five coins 4H full sample 3 of 5 positive, BTC ETH XRP, beats buy and hold
    Aroon friction gate passes, plus 67 gross plus 19 net on BTC 4H

    Kill Shot #1 — The Edge Exists at Exactly One Setting

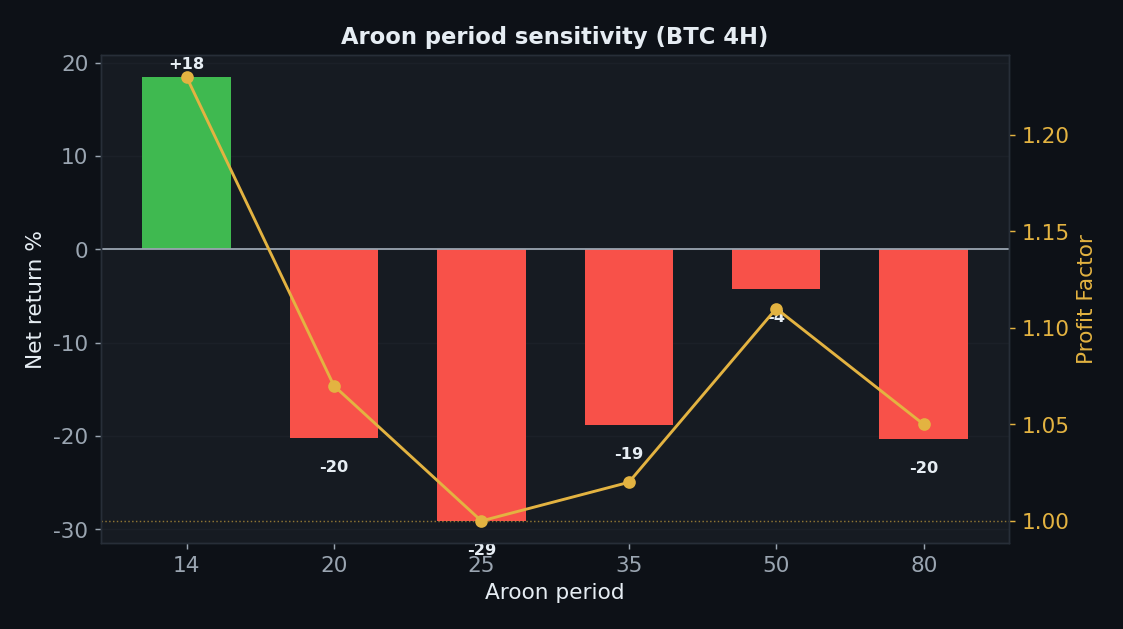
    Aroon period Net PF
    14 (default) +18.5% 1.23
    20 −20% 1.07
    25 −29% 1.00
    35 −19% 1.02
    50 −4% 1.11
    80 −20% 1.05

    Here is the first crack. That +18.5% is the Aroon period 14. Change it to 20, 25, 35, 50 or 80 and every single one loses. A real edge degrades gracefully as you nudge the parameter — you get a plateau of similar results. An over-fit edge is a lonely spike on one value with losses all around it, which is exactly what this is. The strategy didn’t find a market truth; it found the one number that happened to fit the last two years.

    Aroon period sensitivity, only period 14 positive plus 18, all other periods lose, overfit spike

    Kill Shot #2 — It Collapses Out-of-Sample

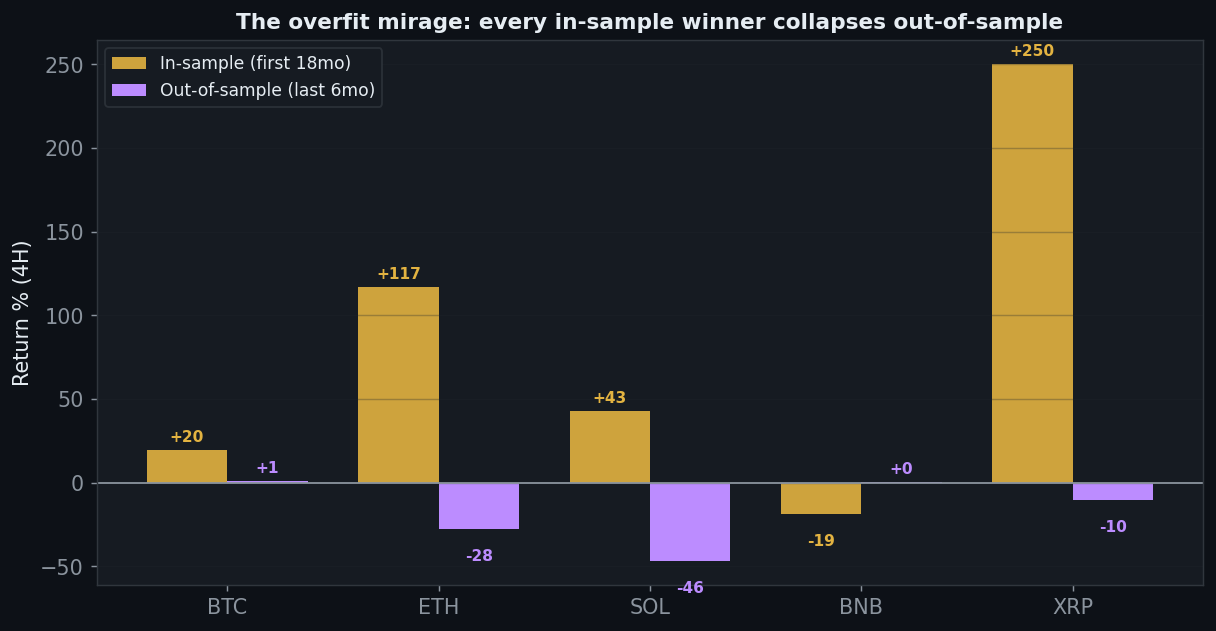
    Aroon overfit mirage, in-sample winners collapse out-of-sample, ETH plus 117 to minus 28, XRP plus 250 to minus 11

    The decisive test. Train on the first 18 months, then look at the last 6 months the strategy never “saw”:

    Coin In-sample (18mo) Out-of-sample (6mo)
    BTC +20% +1%
    ETH +117% −28%
    SOL +43% −47%
    BNB −19% +1%
    XRP +250% −11%

    Every in-sample winner collapses. ETH goes from +117% to −28%. SOL from +43% to −47%. XRP from +250% to −11%. Only BTC and BNB scrape a fraction of a percent positive out-of-sample. The gorgeous full-sample numbers were the strategy memorising 2024–25, not discovering anything that carries into the future. This is the single clearest picture of overfitting we’ve produced.

    The Other Axes

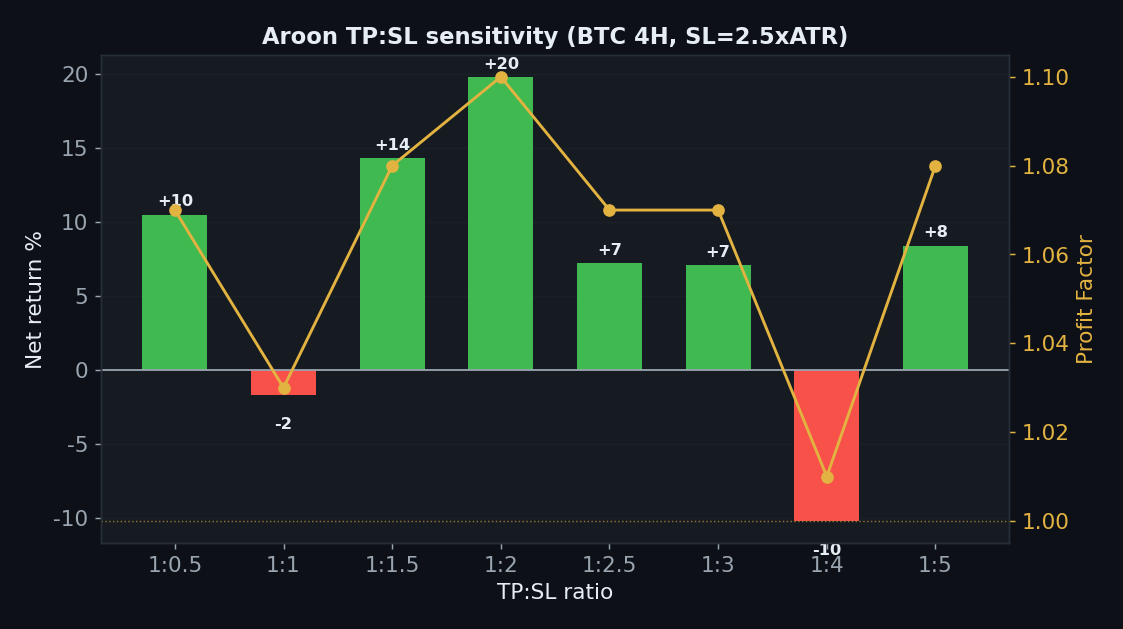
    TP:SL Net PF
    1:0.5 +11% 1.07
    1:1 −2% 1.03
    1:1.5 +14% 1.08
    1:2 +20% 1.10
    1:2.5 +7% 1.07
    1:3 +7% 1.07
    1:4 −10% 1.01
    1:5 +8% 1.08
    Aroon TP:SL sensitivity mostly mildly positive

    TP:SL variants are mostly mildly positive (a point in its favour), and the yearly split is 2 of 3 positive (2024 +35%, 2026 +3%, 2025 −15%). Those are the crumbs that make an over-fit strategy so seductive — it isn’t random, it genuinely rode 2024’s trends. But “rode the specific past” and “has an edge going forward” are different claims, and the out-of-sample gate is the referee.

    Year BTC 4H net
    2024 +35%
    2025 −15%
    2026 (to Jul) +3%

    The Verdict: REJECT

    • Gate 0 — Indicator fidelitypass (standard Aroon(14) crossover)
    • Gate 1 — Sanitypass (signal on the closed bar, no look-ahead)
    • Gate 2 — Frictionpass (+67% gross, +19% net on 4H — a rare pass)
    • Gate 3 — Yearly consistencypartial (2024 +35 / 2025 −15 / 2026 +3)
    • Gate 4 — Out-of-samplefail (in-sample winners collapse: ETH +117→−28, XRP +250→−11)
    • Gate 5 — Robustnessfail (profitable at period 14 only; every other period loses — curve-fit)
    • Gate 6 — Multi-marketpartial (full sample) / fail (out-of-sample) (3/5 in-sample, collapses out)
    • Gate 7 — vs Buy & Holdpartial (beats on 4H in-sample; not out-of-sample)

    Aroon is the backtest that lied — and the most useful one to study. It passes friction, beats buy & hold on three coins, and posts a +18.5% 4H curve, which is why it’s so easy to fall for. But its edge lives at exactly one parameter value (period 14) and evaporates the moment you test it on unseen data, where every in-sample winner turns negative. A strategy that only works at one setting and can’t repeat out-of-sample hasn’t found an edge; it has memorised the past. That’s the definition of over-fitting, and it’s why out-of-sample and parameter robustness — not the headline return — decide a verdict here.

    FAQ

    But it beat buy & hold — how is that a reject?
    On the full sample and at one parameter, yes. The reject is because that result doesn’t survive the two tests that estimate future performance: change the period and it loses; test on unseen data and it loses. Beating hold on data you fit to is not evidence of a forward edge.

    Couldn’t you just trade it on the daily/12H where it’s strongest?
    The out-of-sample collapse is measured on the same higher-timeframe logic; the in-sample daily/4H strength is exactly what fails to repeat. Cherry-picking the best in-sample window is how overfitting is done, not how it’s fixed.

    Can I replicate this?
    Yes — Aroon(14) crossover, public Binance data, 0.06%/side, five coins, nine timeframes, an 18/6-month out-of-sample split. Every table reproduces.

    See also: Williams %R, ADX / DMI, Donchian / Turtle, Triple SuperTrend, and the conditional passes VWAP and Ichimoku (daily).


    Disclaimer: educational research, not financial advice. Past performance does not guarantee future results. Never trade money you cannot afford to lose.
  • Williams %R Strategy Backtest: a 62% Win Rate That Still Lost Everything

    Williams %R Strategy Backtest: a 62% Win Rate That Still Lost Everything

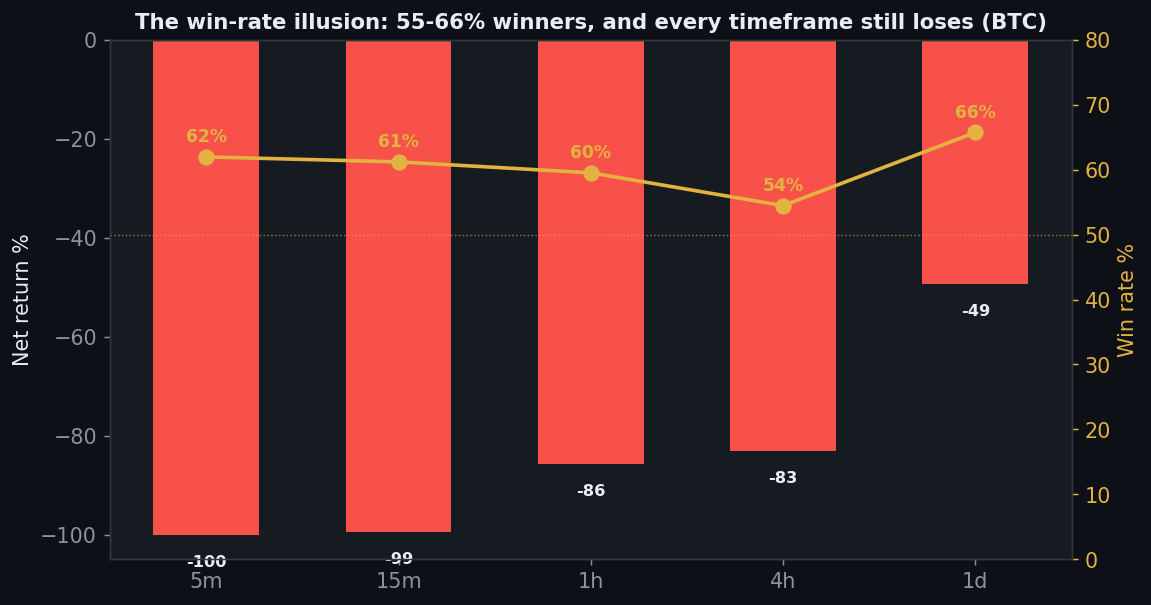
    “My strategy wins 65% of its trades.” It’s the most seductive line in trading — and one of the most misleading. Williams %R, Larry Williams’ 1973 oscillator, is the perfect case study. Traded the standard way — buy when %R climbs out of oversold (−80), sell when it drops out of overbought (−20) — it posts a gorgeous win rate of 54–66% on every timeframe and every coin. It also loses money on every timeframe and every coin. We ran it through the 7-Gate Protocol across six axes. Verdict: reject — and it is the site’s cleanest lesson in why win rate lies.

    Methodology

    • Data: Binance spot, Jul 2024–Jul 2026 (2 years), BTC/ETH/SOL/BNB/XRP
    • Timeframes: 5m–1D (9 buckets, incl. resampled)
    • Execution: Williams %R(14) on the closed bar, no look-ahead; long on cross up through −80, short on cross down through −20
    • Friction: 0.06%/side (real); 0-fee gross reported too. Benchmark: buy & hold
    • Six axes: timeframe, period, TP:SL, multi-coin, yearly, out-of-sample

    Gate 0 — Fidelity

    Standard Williams %R(14): −100 × (highest high − close) / (highest high − lowest low) over 14 bars, scaled −100 to 0. Long when it crosses up through −80 (leaving oversold), short when it crosses down through −20 (leaving overbought). Reproduced exactly (pass).

    The Exact Rules

    • Signal: %R crosses above −80 → long; crosses below −20 → short (stop-and-reverse, hold in between)
    • Default: period 14, thresholds −20 / −80
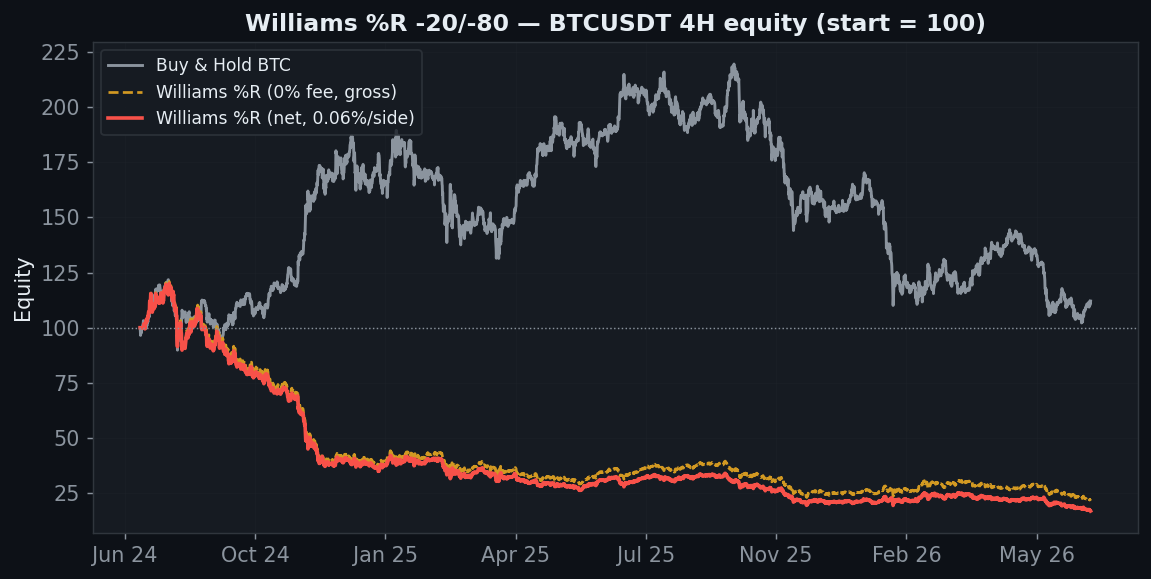
    Williams percent R BTC 4H equity minus 83 net, gross minus 78, no edge at all, buy and hold plus 12

    BTC 4H ends at −83%. And this time even the gross (0-fee) line is at −78% — there is no edge here at all, before or after costs. Yet the strategy won 55% of those losing trades. How?

    The Win-Rate Illusion

    Williams percent R win rate illusion, win rate 55 to 66 percent gold line but net return all negative red bars

    This one chart is the whole verdict. Across every timeframe the win rate sits at 55–66% (gold line) while the net return is deeply negative (red bars). The reason is what mean-reversion oscillators do: buying oversold and shorting overbought means fading the move. You clip a small profit most of the time as price wiggles back — a high win rate — but when the trend simply keeps going, you take one enormous loss that erases dozens of those small wins. Win rate counts how often you win; it says nothing about how much you win versus lose. Here the ratio is fatal.

    Axis 1 — Timeframe (win rate, gross, net)

    Timeframe Trades Win rate Gross Net
    5m 11,279 62% +29% −100%
    15m 3,731 61% −51% −99%
    30m 1,794 60% −25% −91%
    1h 889 60% −58% −86%
    2h 422 59% −70% −82%
    4h 202 55% −78% −83%
    6h 156 65% −30% −42%
    12h 66 55% −16% −22%
    1D 35 66% −47% −49%

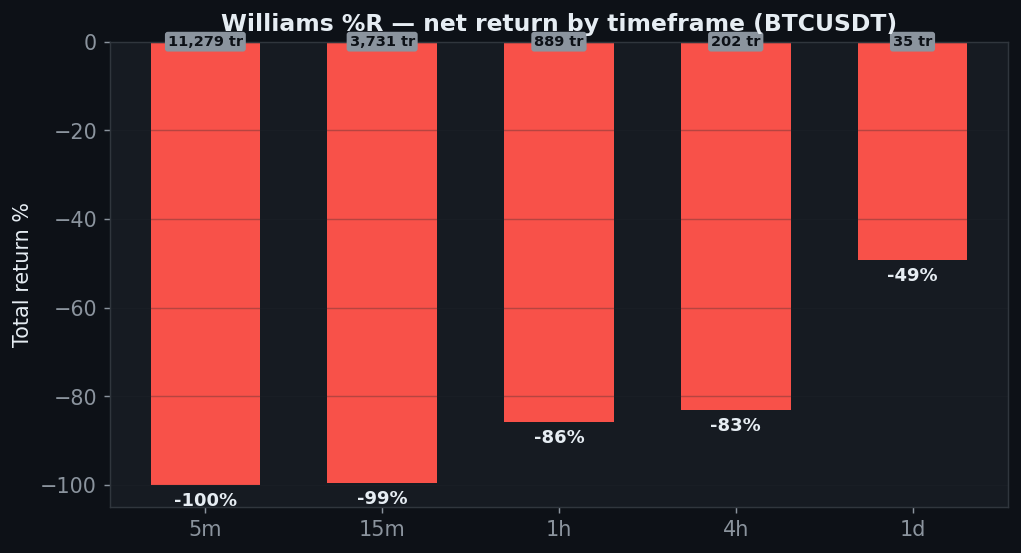
    Read the win-rate column: 55–66% everywhere. Read the net column: negative everywhere. Nine timeframes, nine high-win-rate losers. The 5-minute wins 62% of 11,279 trades and still goes to −100%.

    Williams percent R net return by timeframe all negative despite high win rate, 5 minute minus 100

    Axis 2 — Period (parameter)

    %R period Trades Win rate Net PF
    7 350 57% −77% 0.81
    9 282 60% −79% 0.74
    14 (default) 202 55% −83% 0.63
    21 158 60% −62% 0.84
    28 124 65% −36% 0.98
    35 92 61% −40% 0.94

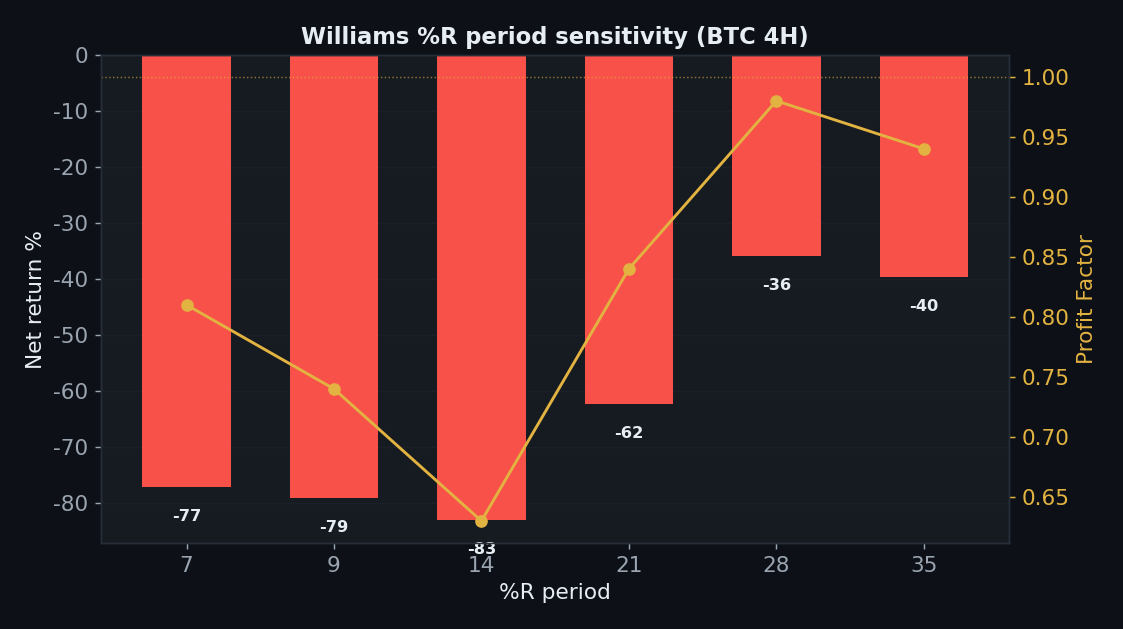
    Every %R period loses (best case −36% at period 28), and the win rate stays 55–65% throughout. There is no length at which fading extremes becomes profitable on the majors.

    Williams percent R period sensitivity all negative, no length profitable

    Axis 3 — TP:SL

    TP:SL Net PF
    1:0.5 −76% 0.54
    1:1 −77% 0.57
    1:1.5 −77% 0.58
    1:2 −77% 0.58
    1:2.5 −79% 0.56
    1:3 −78% 0.57
    1:4 −79% 0.56
    1:5 −79% 0.56

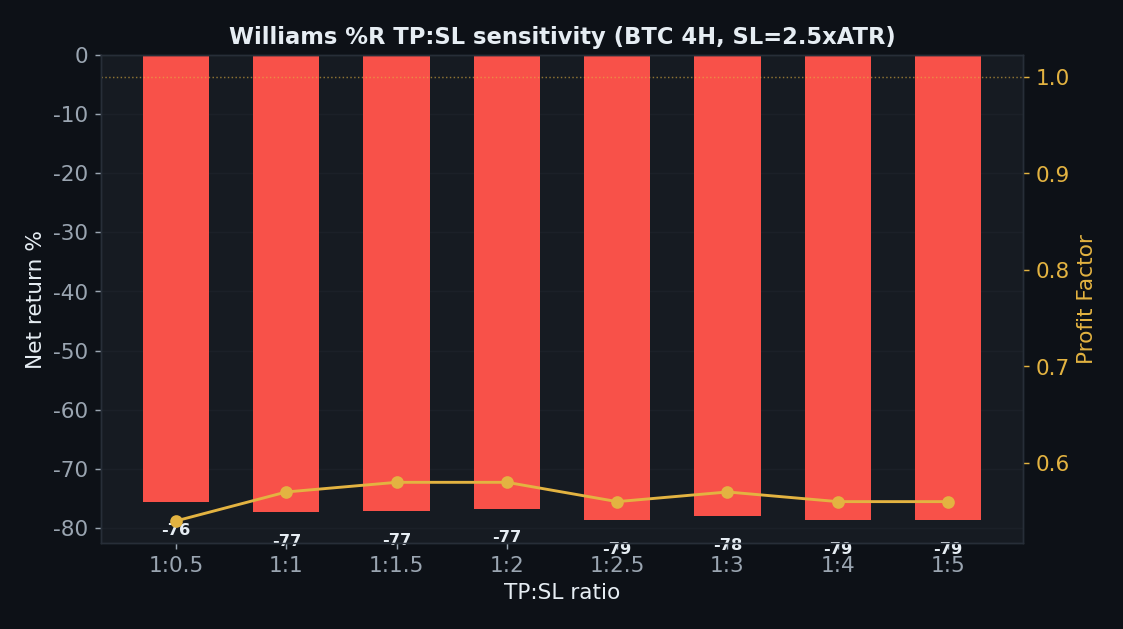
    This is the most damning sweep on the site: every single TP:SL ratio loses 75–79% with a profit factor of 0.54–0.58. You cannot fix a strategy whose losers dwarf its winners by moving the target — the problem is structural, not a tuning issue.

    Williams percent R TP:SL sensitivity every ratio loses 75 to 79 percent, profit factor 0.54 to 0.58

    Axis 4 — Five Coins

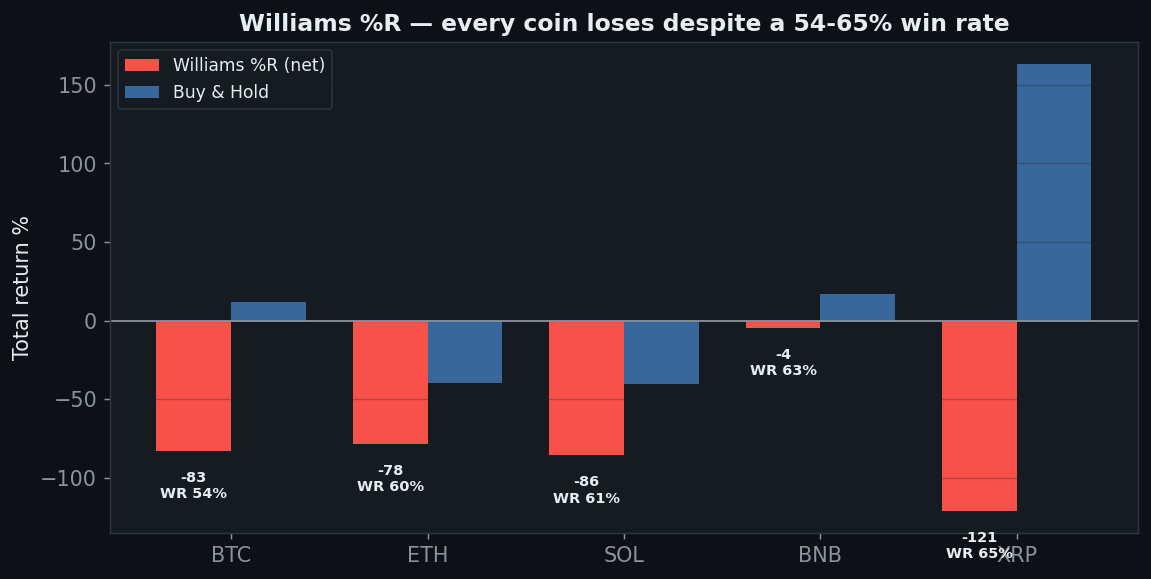
    Coin Win rate Williams %R net Buy & Hold
    BTC 54% −83% +12%
    ETH 60% −78% −40%
    SOL 61% −86% −40%
    BNB 63% −4% +17%
    XRP 65% −121% +163%

    Zero of five coins are profitable — the worst multi-market result on the site. And look at XRP: a 65% win rate and a −121% return. You kept shorting XRP every time it looked “overbought” while it tripled; you were right 65% of the time and it destroyed the account. That single row is the entire argument against win rate as a metric.

    Williams percent R five coins all lose despite 54 to 65 percent win rate, XRP 65 percent win minus 121

    Axis 5 — Yearly

    Year BTC 4H net
    2024 −62%
    2025 −45%
    2026 (to Jul) −20%

    All three years lose: −62%, −45%, −20%. Not one positive year — the only strategy on this site to fail that cleanly. Fading a trending, momentum-driven market is a structural loser regardless of the calendar.

    Axis 6 — Friction & Out-of-Sample

    Williams percent R friction gate minus 78 gross to minus 83 net, no edge

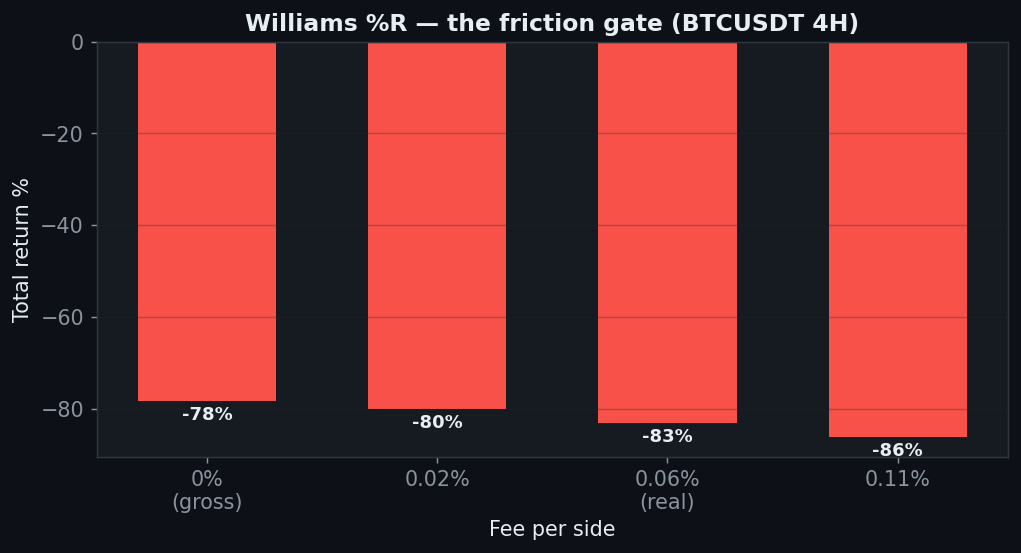
    Friction barely matters when the gross is already −78%. Out-of-sample confirms it: 1 of 5 coins positive on unseen data. There is nothing to salvage.

    The Verdict: REJECT

    • Gate 0 — Indicator fidelitypass (standard Williams %R(14), −20/−80)
    • Gate 1 — Sanitypass (signal on the closed bar, no look-ahead)
    • Gate 2 — Frictionfail (−78% even at zero fees on 4H; 5m → −100%)
    • Gate 3 — Yearly consistencyfail (all three years negative: −62 / −45 / −20)
    • Gate 4 — Out-of-samplefail (1 of 5 coins positive out-of-sample)
    • Gate 5 — Robustnessfail (every period loses; every TP:SL loses at PF 0.54–0.58)
    • Gate 6 — Multi-marketfail (0 of 5 coins positive — the worst on the site)
    • Gate 7 — vs Buy & Holdfail (0 of 5 timeframes, 0 of 5 coins)

    A 62% win rate that lost everything. Williams %R traded as an overbought/oversold reversal fades the market: it wins small and often, then hands back everything (and more) when a trend refuses to reverse. Win rate measures frequency, not expectancy — and XRP’s 65%-win, −121% row is the clearest proof you’ll ever see that the two are not the same. It fails every axis: every timeframe, every period, every TP:SL, every coin, every year. As a mechanical reversal signal, Williams %R is a reject — and a permanent reminder to look at the profit factor, never the win rate.

    FAQ

    Shouldn’t you only take %R signals with the trend?
    Adding a trend filter is a different strategy, and worth its own test — but the −20/−80 reversal is what’s taught as “the Williams %R strategy,” so that’s what we measured. A filtered version still has to beat these six gates.

    But the win rate is genuinely high — doesn’t that count for something?
    Only alongside the average win vs average loss. A 65% win rate with losers 3× the size of winners is a losing system, which is exactly what the profit factors (0.54–0.63) and the XRP row show.

    Can I replicate this?
    Yes — Williams %R(14), −20/−80 reversal, public Binance data, 0.06%/side, five coins, nine timeframes. Every table reproduces.

    See also: Stochastic, RSI 30/70, CCI, Heikin Ashi, and the conditional passes VWAP and Ichimoku (daily).


    Disclaimer: educational research, not financial advice. Past performance does not guarantee future results. Never trade money you cannot afford to lose.
  • CCI Strategy Backtest: the +/-100 Breakout That Buys the Spike Top (0/5 Out-of-Sample)

    CCI Strategy Backtest: the +/-100 Breakout That Buys the Spike Top (0/5 Out-of-Sample)

    The Commodity Channel Index, built by Donald Lambert in 1980, is one of the most popular momentum oscillators on every charting platform. The rule taught everywhere is the ±100 breakout: when CCI pushes above +100, momentum is “strong” — go long; when it drops below −100, go short. It feels intuitive: buy strength, sell weakness. But there’s a catch baked into the idea, and the out-of-sample test exposes it brutally. We ran the CCI(20) ±100 breakout through the 7-Gate Protocol across six axes. Verdict: reject.

    Methodology

    • Data: Binance spot, Jul 2024–Jul 2026 (2 years), BTC/ETH/SOL/BNB/XRP
    • Timeframes: 5m–1D (9 buckets, incl. resampled)
    • Execution: CCI(20) on the closed bar, no look-ahead; long on cross above +100, short on cross below −100
    • Friction: 0.06%/side (real); 0-fee gross reported too. Benchmark: buy & hold
    • Six axes: timeframe, threshold, TP:SL, multi-coin, yearly, out-of-sample

    Gate 0 — Fidelity

    Standard CCI(20): (typical price − its 20-period SMA) / (0.015 × mean deviation), where typical price = (H+L+C)/3. Long when CCI crosses above +100, short when it crosses below −100. Reproduced exactly (pass).

    The Exact Rules

    • Signal: CCI crosses above +100 → long; crosses below −100 → short (stop-and-reverse, hold in between)
    • Default: period 20, threshold ±100
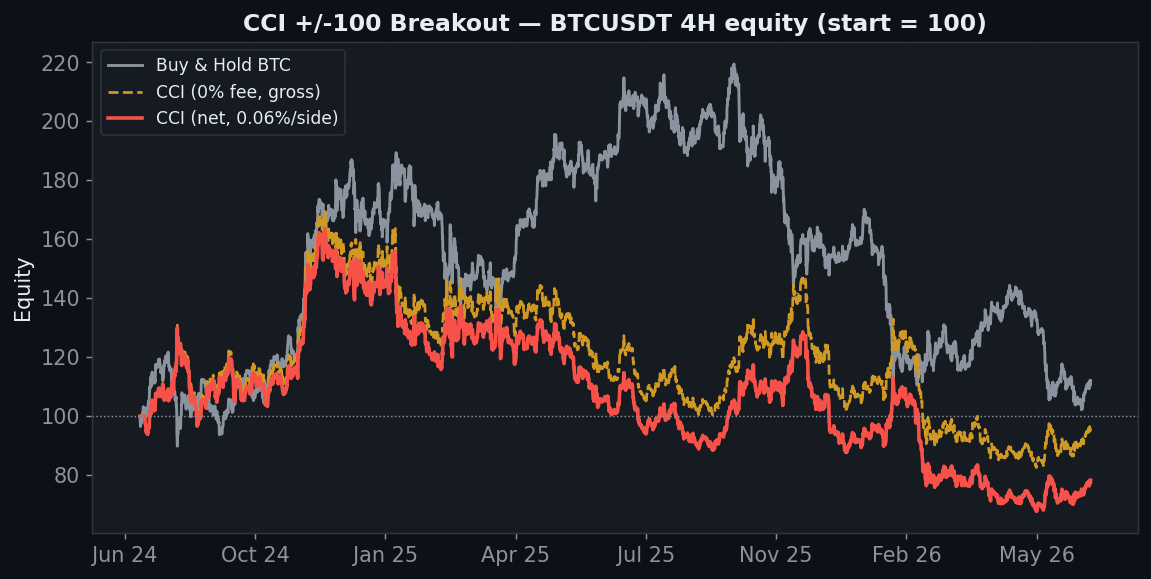
    CCI plus minus 100 breakout BTC 4H equity minus 22 percent net, gross minus 4, buy and hold plus 12

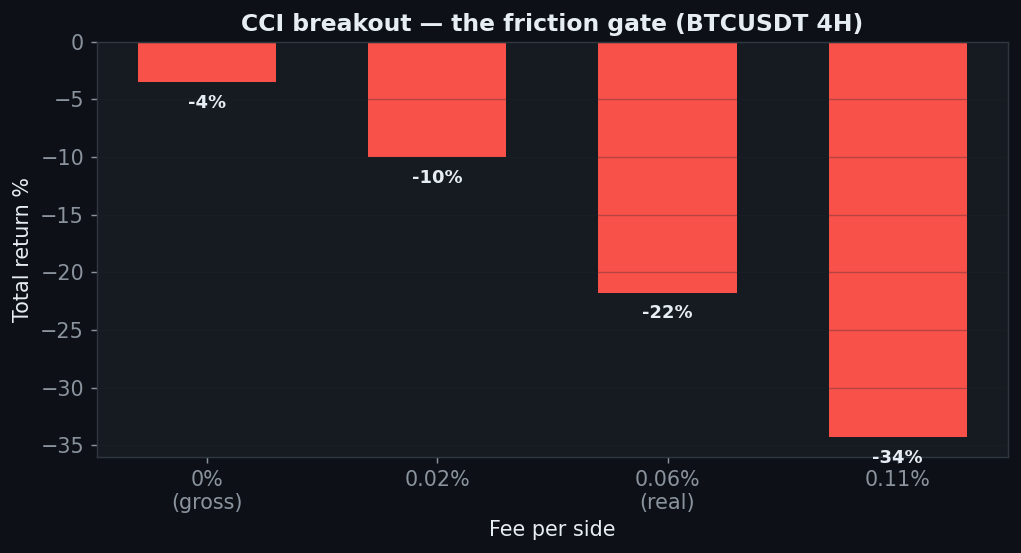
    BTC 4H ends at −22% versus buy & hold’s +12%. Even the gross (0-fee) line finishes at −4% — barely any edge to erode. But the deeper problem isn’t the friction gate; it’s what happens the moment you test on data the strategy hasn’t seen.

    Why It Bleeds: Buying the Spike Top

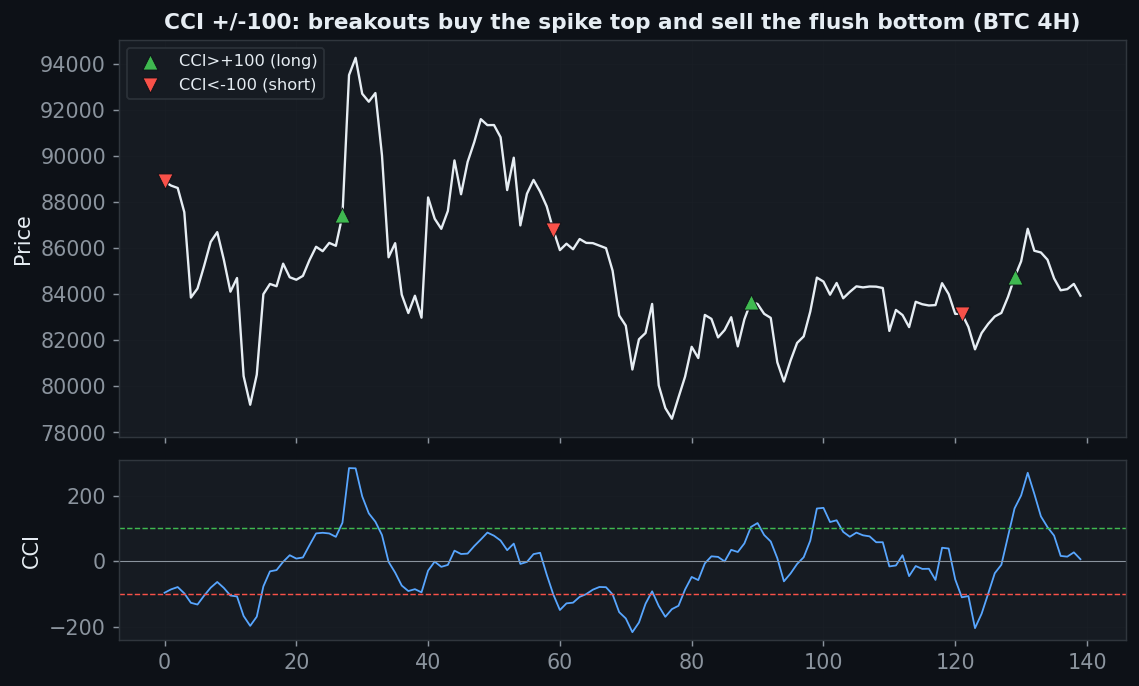
    CCI plus minus 100 breakout buys spike tops and shorts flush bottoms, 33 percent win rate, price and CCI panel

    Look at where the entries land. CCI crosses +100 after a sharp push — which in crypto is very often the exhaustion of the move, not its start. So the breakout buys the top of the spike and shorts the bottom of the flush, then reverses. A 33% win rate is the arithmetic of systematically entering extremes just as they’re about to snap back. “Buy strength” sounds right, but a +100 reading is frequently the last gasp of strength.

    Axis 1 — Timeframe (gross vs net)

    Timeframe Trades Gross (0 fee) Net (real)
    5m 8,144 −48% −100%
    15m 2,735 +16% −96%
    30m 1,354 +15% −77%
    1h 672 −22% −65%
    2h 324 +6% −28%
    4h 174 −4% −22%
    6h 112 −38% −46%
    12h 44 +55% +47%
    1D 30 −36% −38%

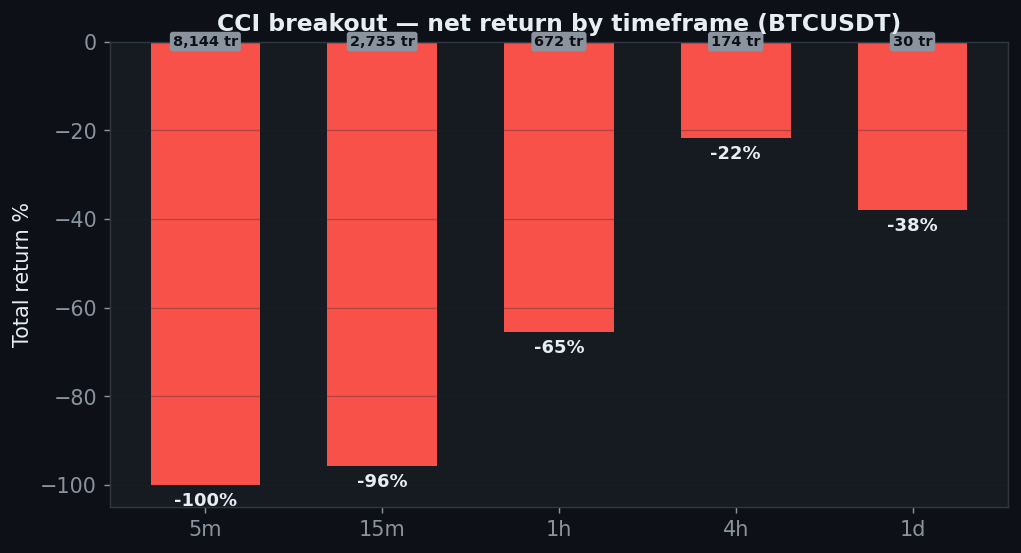
    The five main timeframes are all net-negative. There is one honest bright spot — the 12-hour is +47% net — but it rests on just 44 trades, one timeframe on one coin, and (as the out-of-sample gate shows) doesn’t generalize. A single green cell on a tiny sample is a curiosity, not a system.

    CCI net return by timeframe five main all negative, minus 100 on 5 minute

    Axis 2 — Threshold (parameter)

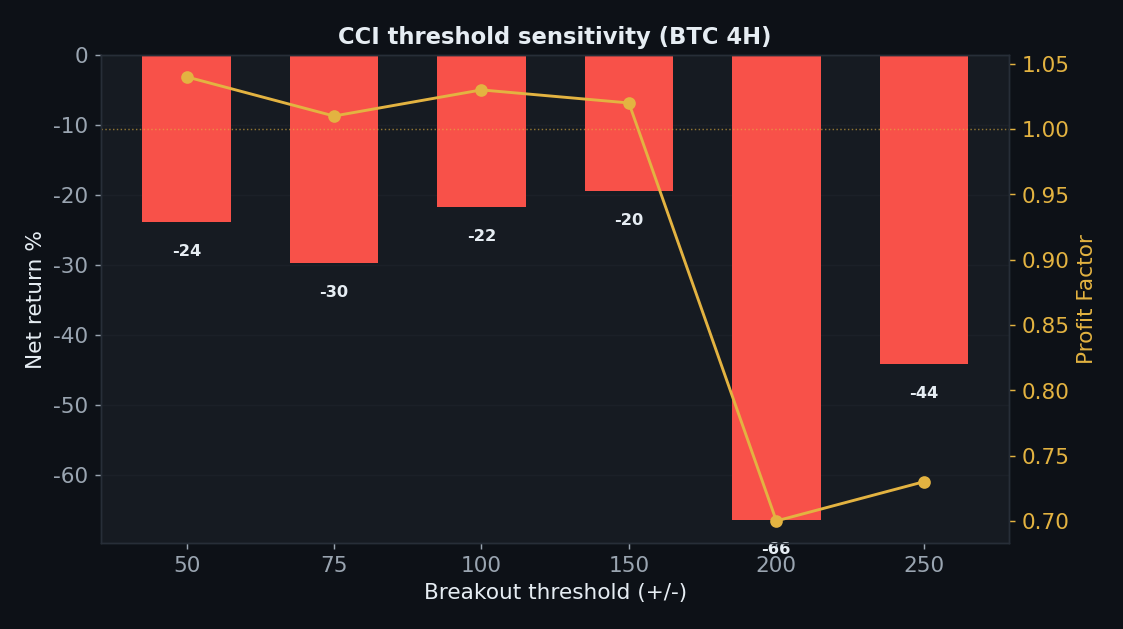
    Maybe ±100 is just the wrong level? We swept the breakout threshold on BTC 4H.

    Threshold (±) Trades Net PF
    50 238 −24% 1.04
    75 202 −30% 1.01
    100 (default) 174 −22% 1.03
    150 108 −20% 1.02
    200 66 −66% 0.70
    250 39 −44% 0.73

    Every threshold loses, and widening it makes things worse (±200 → −66%). There is no “extreme enough” level that turns momentum-breakout entries into an edge on the majors. Nothing to tune.

    CCI threshold sensitivity all negative, wider thresholds worse, nothing to tune

    Axis 3 — TP:SL

    TP:SL Net PF
    1:0.5 −3% 1.01
    1:1 +4% 1.05
    1:1.5 −2% 1.03
    1:2 −40% 0.85
    1:2.5 −39% 0.86
    1:3 −39% 0.86
    1:4 −37% 0.88
    1:5 −28% 0.94

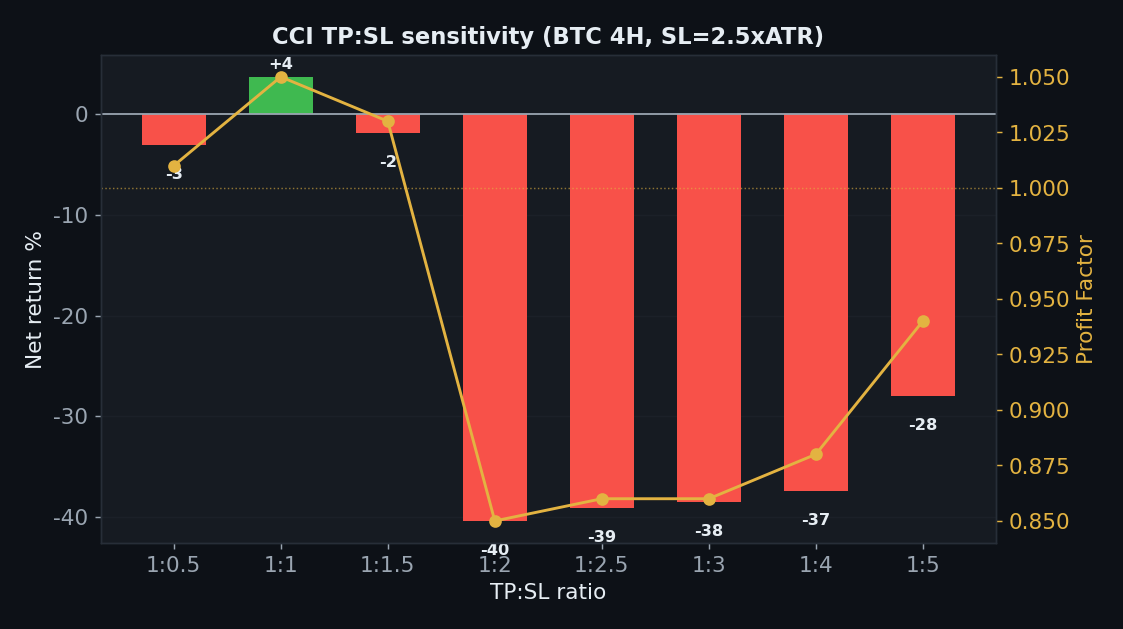
    Only a very tight take-profit (1:1) scrapes +4%; everything from 1:2 upward loses 28–40%. As with the other momentum rejects, the only marginally-positive variant is quick-scalp, not the “ride the breakout” the strategy is sold as — and +4% on one coin isn’t a strategy.

    CCI TP:SL sensitivity only tight 1 to 1 scrapes plus 4 percent, wide targets lose 28 to 40

    Axis 4 — Five Coins

    Coin CCI net Buy & Hold Excess
    BTC −22% +12% −34pp
    ETH −44% −40% −4pp
    SOL −56% −40% −16pp
    BNB −31% +17% −48pp
    XRP +113% +163% −50pp

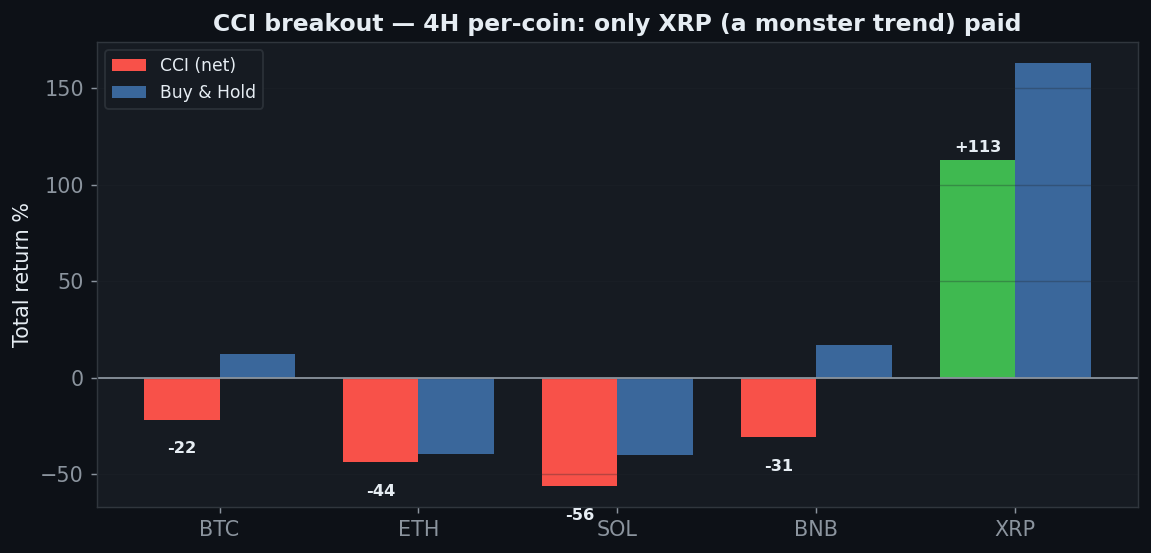
    Only XRP (1 of 5) is net-positive (+113%), and even that trails XRP’s own buy & hold (+163%). The rest lose 22–56%. The single winner is the biggest trender — trend-luck.

    CCI five coins 4H only XRP positive plus 113, BTC minus 22 SOL minus 56

    Axis 5 — Yearly

    Year BTC 4H net
    2024 +38%
    2025 −36%
    2026 (to Jul) −11%

    2024 looks great at +38% — but 2025 (−36%) and 2026 (−11%) are both negative. Two of three years lose. A single good year is exactly the kind of result the next gate is designed to catch.

    Axis 6 — Friction & the Killer Gate: Out-of-Sample

    CCI friction gate minus 4 gross to minus 22 net BTC 4H

    Friction (BTC 4H): −4% gross → −22% net. But the decisive result is out-of-sample. Train on the first 18 months, test on the last 6, and 0 of 5 coins stay positive out-of-sample — the cleanest failure on this entire site. Whatever looked workable in-sample (2024’s +38%, the 12H, the tight TP) is precisely the memorised past; none of it survives on unseen data.

    The Verdict: REJECT

    • Gate 0 — Indicator fidelitypass (standard CCI(20), ±100 breakout)
    • Gate 1 — Sanitypass (signal on the closed bar, no look-ahead)
    • Gate 2 — Frictionfail (−4% at zero fees on 4H, −22% net; 5m → −100%)
    • Gate 3 — Yearly consistencyfail (2024 +38 / 2025 −36 / 2026 −11 — two of three years lose)
    • Gate 4 — Out-of-samplefail hard (0 of 5 coins positive out-of-sample — nothing generalizes)
    • Gate 5 — Robustnessfail (threshold sweep 0/6; wider thresholds are worse)
    • Gate 6 — Multi-marketfail (1 of 5 coins; only XRP, a monster trender)
    • Gate 7 — vs Buy & Holdfail (5 main timeframes all lose; only a 44-trade 12H sample is positive)

    CCI’s ±100 breakout buys momentum extremes — and in crypto, extremes are usually exhaustion. You enter at the top of the spike, reverse at the bottom of the flush, and win 33% of the time. There are teasing green cells — a +47% 12-hour, a +38% 2024 — but the out-of-sample gate is unforgiving: zero of five coins survive on unseen data, the flattest “this does not generalize” result we’ve measured. As the taught momentum-breakout rule, CCI is a reject.

    FAQ

    You should use CCI for reversion — buy oversold below −100, not breakouts.
    That’s a different, opposite rule, and worth its own test — but “buy the +100 breakout” is what’s most commonly taught as the CCI strategy, so that’s what we measured here. A reversion version would still have to clear the same six gates, out-of-sample included.

    Isn’t the 12-hour actually good (+47%)?
    On 44 trades, one coin, in-sample. The out-of-sample gate (0/5) is the direct rebuttal: results that thin don’t repeat on new data.

    Can I replicate this?
    Yes — CCI(20), ±100 breakout, public Binance data, 0.06%/side, five coins, nine timeframes. Every table reproduces.

    See also: Stochastic, ADX / DMI, Heikin Ashi, RSI 30/70, and the conditional passes VWAP and Ichimoku (daily).


    Disclaimer: educational research, not financial advice. Past performance does not guarantee future results. Never trade money you cannot afford to lose.
  • Heikin Ashi Strategy Backtest: the Smooth Candles That Whipsaw Underneath

    Heikin Ashi Strategy Backtest: the Smooth Candles That Whipsaw Underneath

    Open any “trade like a pro” video and you’ll meet Heikin Ashi — the modified candles that look magically smooth, painting long runs of clean green in an uptrend and clean red in a down. The pitch writes itself: the smoothing “filters out the noise” so you can hold the trend and ignore the chop. The simplest rule taught is the colour flip: go long when the Heikin Ashi candle turns green, short when it turns red. So do those beautiful smooth candles actually make money? We ran the colour flip through the 7-Gate Protocol across six axes. Verdict: reject — and the reason is hiding in plain sight, inside the very smoothness people love.

    Methodology

    • Data: Binance spot, Jul 2024–Jul 2026 (2 years), BTC/ETH/SOL/BNB/XRP
    • Timeframes: 5m–1D (9 buckets, incl. resampled)
    • Execution: Heikin Ashi from standard OHLC; colour read on the closed bar, no look-ahead
    • Friction: 0.06%/side (real); 0-fee gross reported too. Benchmark: buy & hold
    • Six axes: timeframe, smoothing, TP:SL, multi-coin, yearly, out-of-sample

    Gate 0 — Fidelity

    Standard Heikin Ashi: HA close = (O+H+L+C)/4; HA open = (prior HA open + prior HA close)/2; the candle is green when HA close ≥ HA open. Long on green, short on red. Reproduced exactly (pass).

    The Exact Rules

    • Signal: HA candle turns green → long; turns red → short (stop-and-reverse)
    • Default: raw Heikin Ashi, no extra smoothing
    Heikin Ashi BTC 4H equity minus 62 percent net but plus 37 gross, buy and hold plus 12, fees destroy the edge

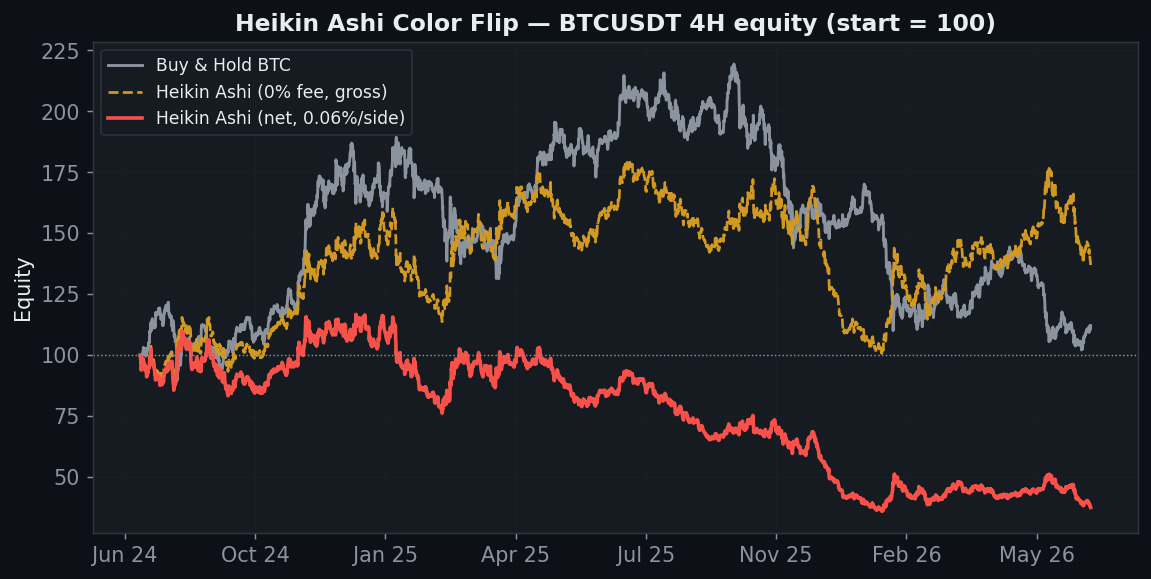
    BTC 4H ends at −63% versus buy & hold’s +12%. But notice something unusual: the gross (0-fee) line finishes at +37%. Unlike most rejects on this site, Heikin Ashi does have a real gross edge — the smoothing genuinely captures some direction. So why does it lose 63% net? One word.

    Why It Bleeds: the Smooth-Candle Illusion

    Heikin Ashi candlesticks look smooth but colour flips 28 times in a short window, whipsaw illusion

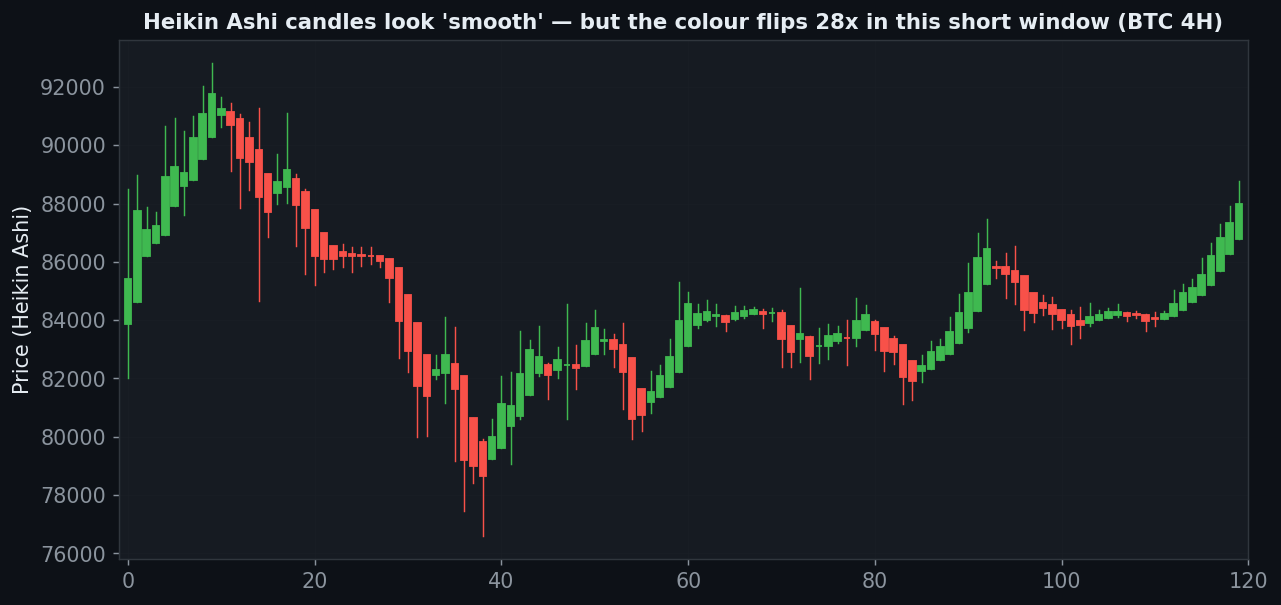
    These are real Heikin Ashi candles. They look smooth — long clean runs of one colour — which is exactly what makes traders feel confident. But count the colour changes: in this short 120-bar window the candle flips colour 28 times. Zoom out and the raw colour-flip trades 1,079 times on 4H and 51,928 times on the 5-minute. The smoothing that makes the chart look calm is a visual sedative; underneath, the signal whipsaws relentlessly. A +37% gross edge spread across 1,079 round-trips cannot survive 0.06% a side.

    Axis 1 — Timeframe (gross vs net)

    Timeframe Trades Gross (0 fee) Net (real)
    5m 51,928 −89% −100%
    15m 17,484 −60% −100%
    30m 8,796 +5% −100%
    1h 4,454 −63% −100%
    2h 2,176 −30% −95%
    4h 1,079 +37% −63%
    6h 685 −5% −58%
    12h 330 +31% −12%
    1D 180 −7% −25%

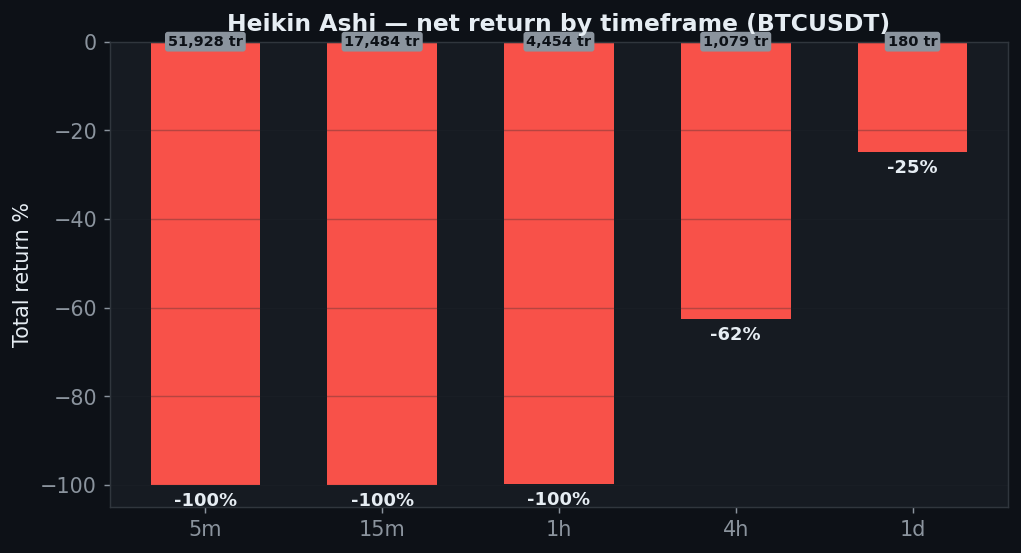
    Zero net-positive timeframes. Several buckets are gross-positive (4h +37%, 12h +31%, 30m +5%) — the edge is real — but the trade counts (51,928 on 5m) mean fees bury every one. The 12H is the least-bad at −12%; the daily is −25%.

    Heikin Ashi net return by timeframe all negative, minus 100 on fast timeframes, 51928 trades on 5 minute

    Axis 2 — Smoothing (the popular “fix”)

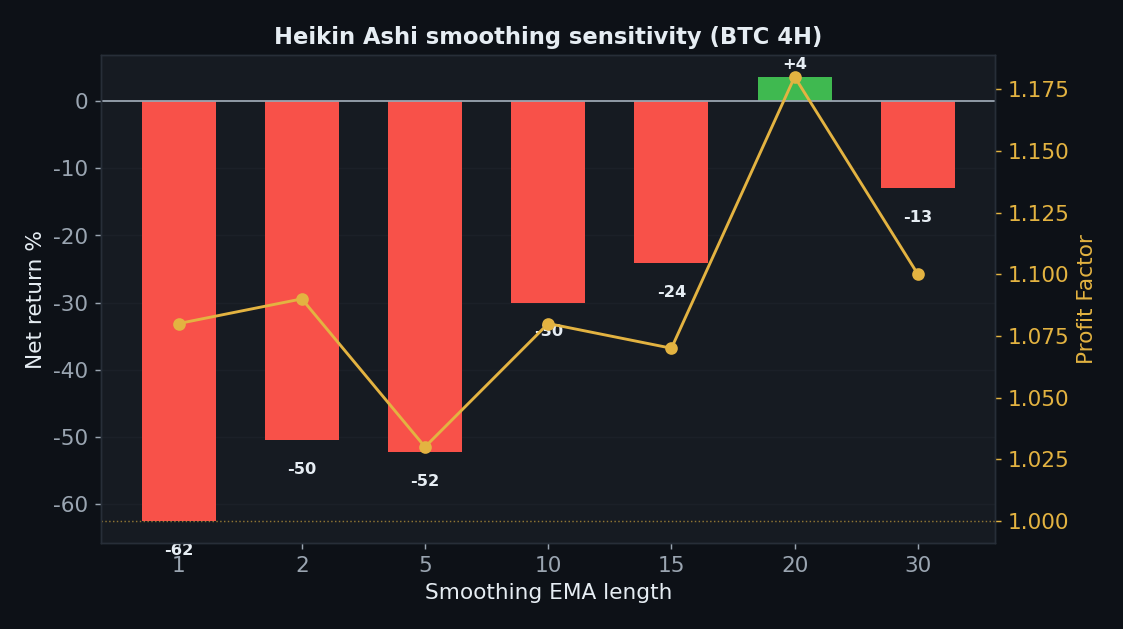
    Retail knows the raw flip is choppy, so the favourite variant is “Smoothed Heikin Ashi” — EMA the price before building the candles. Does more smoothing help? We swept the EMA length on BTC 4H.

    Smoothing (EMA) Trades Net PF
    1 (raw HA) 1,079 −63% 1.08
    2 853 −51% 1.09
    5 563 −52% 1.03
    10 388 −30% 1.08
    15 324 −24% 1.07
    20 278 +4% 1.18
    30 236 −13% 1.10

    Smoothing does exactly what you’d expect: it cuts the trade count (1,079 → 236) and steadily reduces the loss. At EMA-20 it finally scrapes +4% — but that’s it. The “fix” turns a 63% loss into a rounding error, not a strategy, and even that razor-thin result is one coin, one timeframe, and (as the yearly table shows) would have been destroyed in 2025. The raw colour flip that most people actually trade loses badly at every setting.

    Heikin Ashi smoothing sensitivity, raw loses 63, EMA 20 smoothing scrapes plus 4 percent marginal

    Axis 3 — TP:SL

    TP:SL Net PF
    1:0.5 −76% 0.80
    1:1 −65% 0.88
    1:1.5 −64% 0.89
    1:2 −61% 0.90
    1:2.5 −64% 0.89
    1:3 −63% 0.89
    1:4 −62% 0.90
    1:5 −65% 0.89

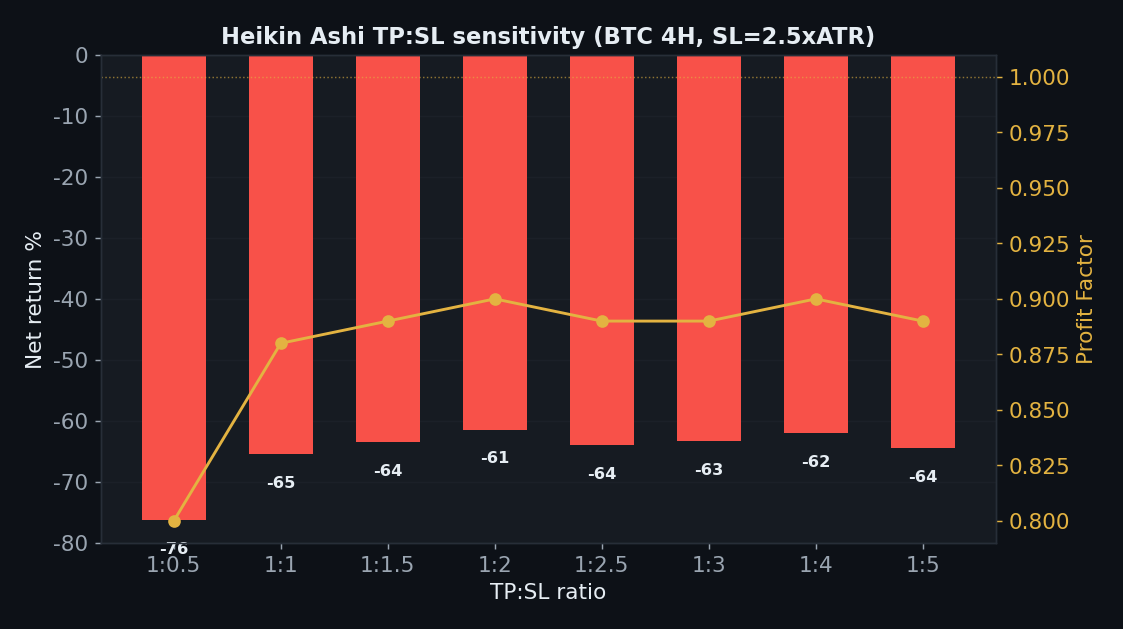
    No take-profit setting rescues it — every ratio from 1:0.5 to 1:5 loses 61–76%. A 34% win rate that flips a thousand times can’t be saved by where you place the target.

    Heikin Ashi TP:SL sensitivity all negative 61 to 76 percent, no take-profit rescues it

    Axis 4 — Five Coins

    Coin HA net Buy & Hold Excess
    BTC −63% +12% −75pp
    ETH −49% −40% −9pp
    SOL −71% −40% −31pp
    BNB −59% +17% −76pp
    XRP +36% +163% −127pp

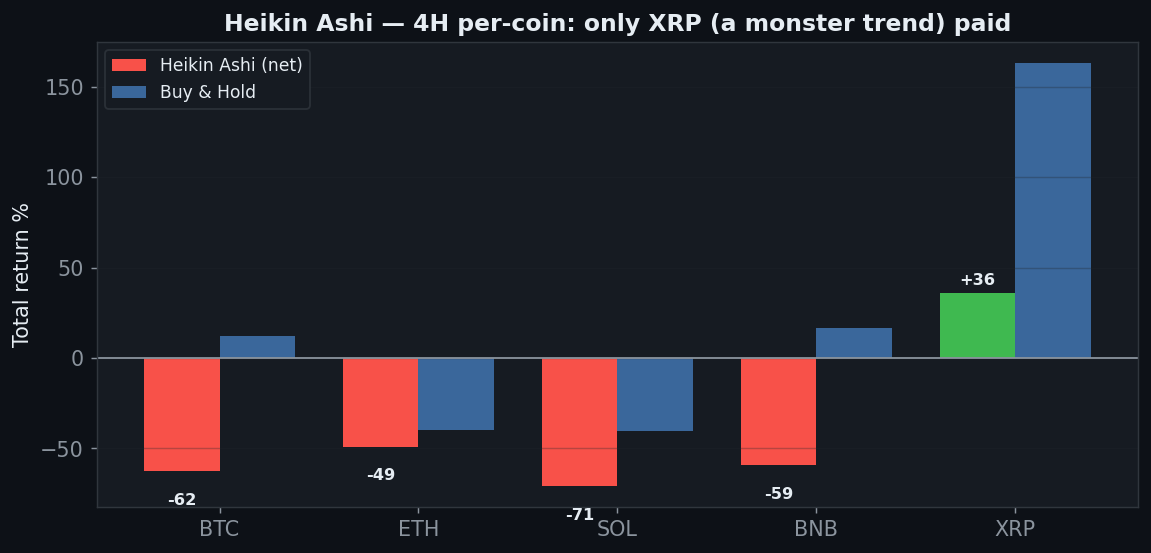
    Only XRP (1 of 5) is net-positive, and even it (+36%) badly trails its own buy & hold (+163%). BTC −63%, SOL −71%. The one green coin is, again, the biggest trender — trend-luck, not edge.

    Heikin Ashi five coins 4H, only XRP positive plus 36, BTC minus 63 SOL minus 71

    Axis 5 — Yearly

    Year BTC 4H net
    2024 +5%
    2025 −60%
    2026 (to Jul) −10%

    Only 2024 is (barely) positive; 2025’s −60% is catastrophic and 2026 is also red. Two of three years lose. A smoothed, lagging colour flip in a choppy, mean-reverting market is a fee-paying machine.

    Axis 6 — Friction & Out-of-Sample

    Heikin Ashi friction gate plus 37 gross to minus 62 net, second most fee sensitive after Stochastic

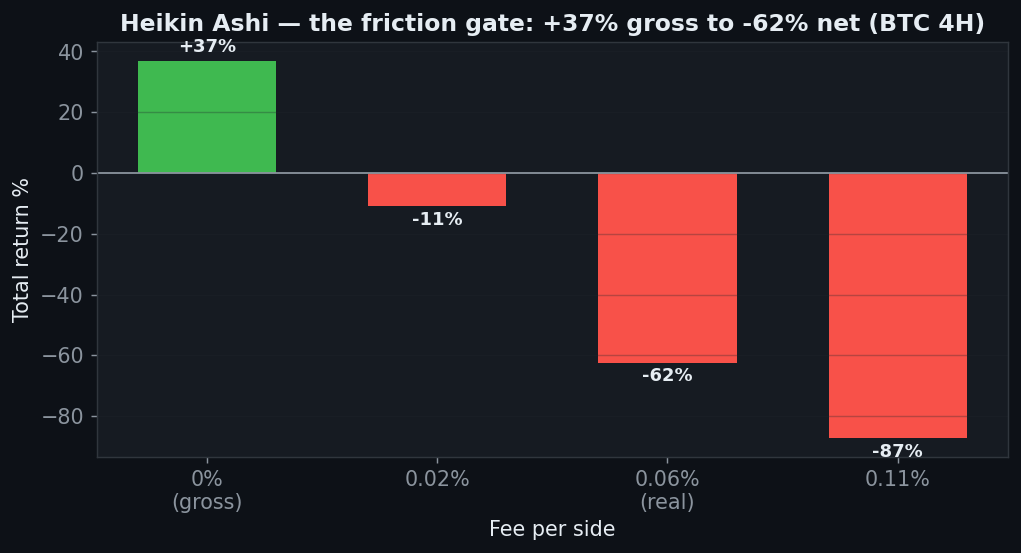
    The friction gate is the whole story: +37% at zero fees → −11% at 0.02% → −62% at 0.06% → −87% at 0.11%. This is the second-most fee-sensitive strategy on the site, behind only the Stochastic crossover — the same over-trading disease. Out-of-sample, 3 of 5 coins are positive over the final six months, but the full sample is a 63% wipeout; that green patch is a window artifact, not evidence of edge.

    The Verdict: REJECT

    • Gate 0 — Indicator fidelitypass (standard Heikin Ashi construction)
    • Gate 1 — Sanitypass (colour read on the closed bar, no look-ahead)
    • Gate 2 — Frictionfail (+37% gross → −62% net on 4H; 5m → −100% over 51,928 trades)
    • Gate 3 — Yearly consistencyfail (2024 +5 / 2025 −60 / 2026 −10 — two of three years lose)
    • Gate 4 — Out-of-samplefail (3/5 over 6 months, but the full sample is a 63% wipeout)
    • Gate 5 — Robustnessfail (raw flip loses at every setting; smoothing to EMA-20 scrapes +4%, marginal and single-coin)
    • Gate 6 — Multi-marketfail (1 of 5 coins; only XRP, a monster trender)
    • Gate 7 — vs Buy & Holdfail (0 of 5 timeframes beat holding)

    Heikin Ashi’s smoothness is a feeling, not an edge. The candles look calm and trend-like, which is precisely why traders trust them — but the colour underneath flips a thousand-plus times, and a genuine +37% gross edge is shredded into a 62% net loss by fees. Smoothing the candles further just trims the bleeding toward zero without ever producing a real system, and 2025 buried even that. The lesson is a recurring one: a signal that looks clean on the chart can still be an over-trading machine once you price in the toll of acting on it.

    FAQ

    You should use Smoothed Heikin Ashi, not raw.
    We tested that — sweeping the EMA length. It helps (fewer trades), and at EMA-20 it reaches +4% on BTC 4H, but that’s a marginal, single-coin, single-timeframe result that still fails the yearly gate. It’s a smaller loss, not an edge.

    Heikin Ashi is for reading trends, not a mechanical signal.
    Agreed, and that’s the honest takeaway: as a visual context it can be useful; as a mechanical colour-flip entry it over-trades and loses. We test the rule people actually trade.

    Can I replicate this?
    Yes — standard Heikin Ashi from Binance OHLC, colour-flip entries, 0.06%/side, five coins, nine timeframes. Every table reproduces.

    See also: Stochastic (the other over-trading autopsy), ADX / DMI, Donchian / Turtle, Triple SuperTrend, and the conditional passes VWAP and Ichimoku (daily).


    Disclaimer: educational research, not financial advice. Past performance does not guarantee future results. Never trade money you cannot afford to lose.
  • ADX / DMI Crossover Strategy Backtest: the Trend Gauge That Enters the Trend Too Late

    ADX / DMI Crossover Strategy Backtest: the Trend Gauge That Enters the Trend Too Late

    Welles Wilder gave technical analysis some of its most enduring tools in his 1978 book — RSI, ATR, Parabolic SAR, and the Directional Movement system: +DI, −DI, and ADX. The idea is elegant. The +DI measures upward directional pressure, the −DI downward, and the ADX measures how strong the trend is regardless of direction. The rule taught to millions is the crossover: when +DI crosses above −DI, go long; when −DI crosses above +DI, go short. So does one of the most respected trend systems in history make money on crypto? We ran it through the 7-Gate Protocol across six robustness axes. Verdict: reject — with one honest twist that points back to how ADX was actually meant to be used.

    Methodology

    • Data: Binance spot, Jul 2024–Jul 2026 (2 years), BTC/ETH/SOL/BNB/XRP
    • Timeframes: 5m–1D (9 buckets, incl. resampled)
    • Execution: on the bar close, no look-ahead; Wilder-smoothed +DI/−DI/ADX, period 14
    • Friction: 0.06%/side (real); 0-fee gross reported too. Benchmark: buy & hold
    • Six axes: timeframe, ADX-filter threshold, TP:SL, multi-coin, yearly, out-of-sample

    Gate 0 — Fidelity

    Standard Wilder DMI(14): +DI and −DI from smoothed directional movement over the true range, ADX from the smoothed DX. Signal on the closed bar, no look-ahead. Reproduced faithfully (pass).

    The Exact Rules

    • Signal: +DI crosses above −DI → long; −DI crosses above +DI → short (stop-and-reverse)
    • Default: period 14, no ADX filter (the raw taught crossover)
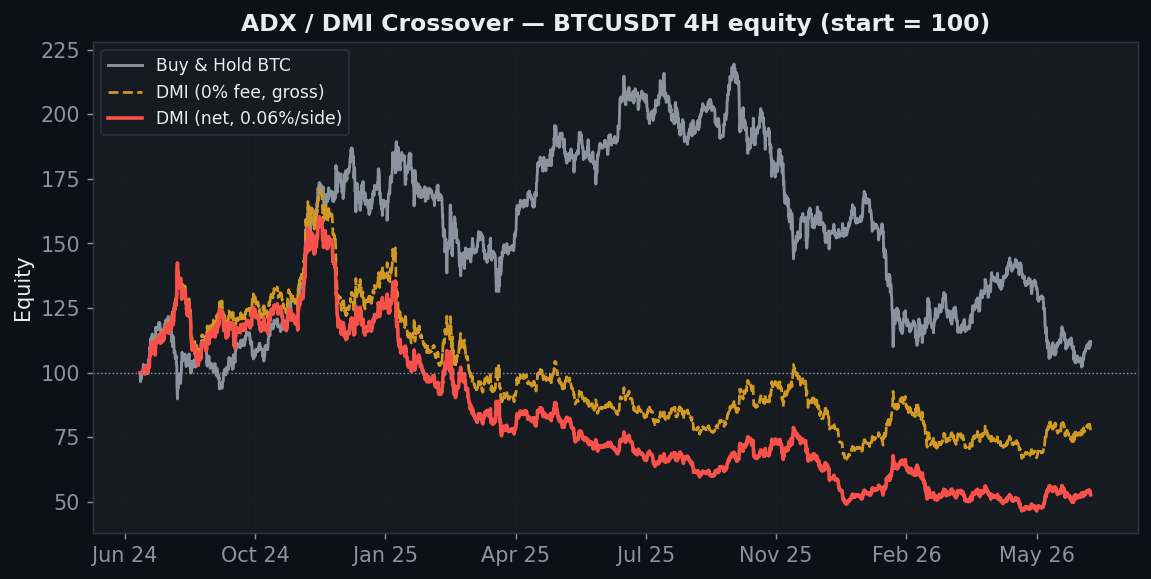
    ADX DMI crossover BTC 4H equity minus 47 percent net, gross minus 22 percent, buy and hold plus 12

    BTC 4H ends at −47% against buy & hold’s +12%. And the gross (0-fee) line finishes at −22% — deeply negative before a single cent of fees. This is the recurring death sentence on this site: no gross edge to erode. But the DI crossover fails for a specific, diagnosable reason.

    Why It Bleeds: a 29% Win Rate

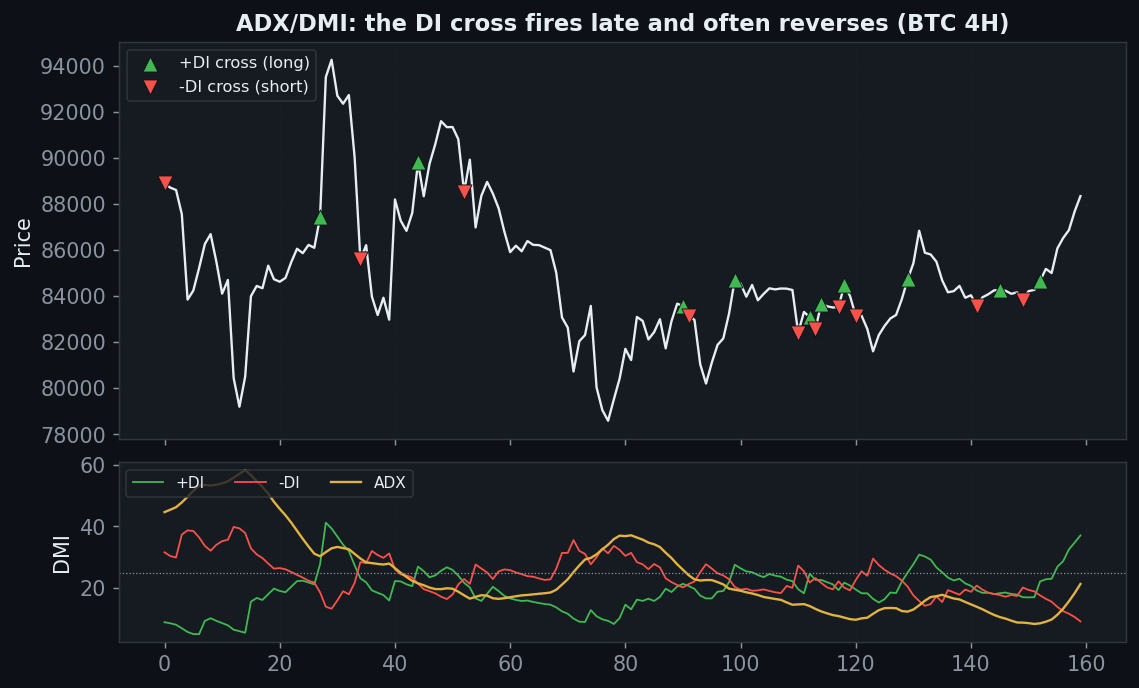
    DMI plus DI minus DI ADX panel, crossovers fire late, 29 percent win rate, whipsaw in range

    Look at the bottom panel. The +DI and −DI lines cross after a move is already underway — directional movement has to accumulate before the lines swap order. So the entry is chronically late, and in choppy conditions the lines cross back and forth constantly. The result is a win rate of just 29% on 4H: the system is wrong roughly seven times out of ten, entering the direction of a move only once it’s half over and reversing right before it resumes. ADX (gold) tells you the trend is strong — but the crossover tells you the direction far too slowly.

    Axis 1 — Timeframe (gross vs net)

    Timeframe Trades Gross (0 fee) Net (real)
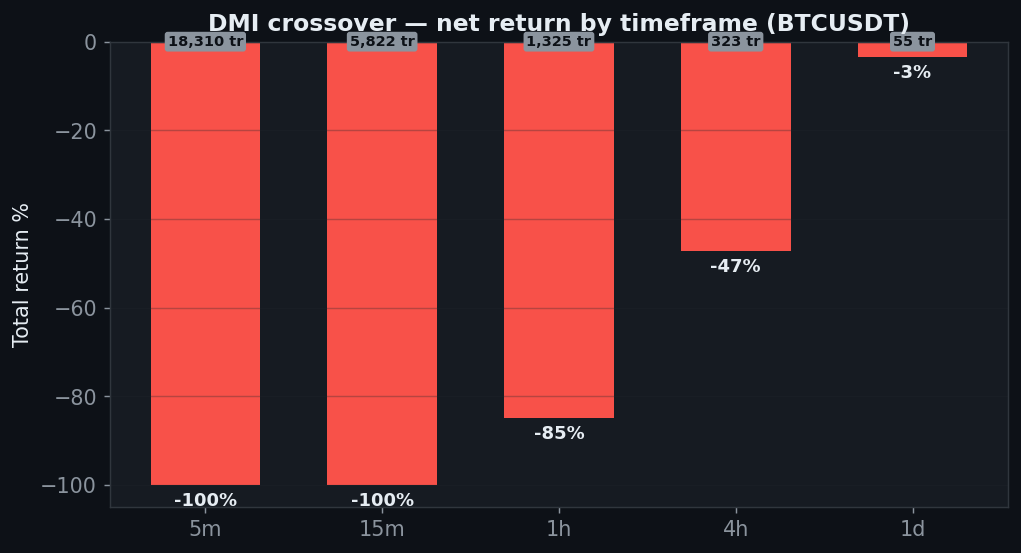
    5m 18,310 −41% −100%
    15m 5,822 −10% −100%
    30m 2,799 +25% −96%
    1h 1,325 −25% −85%
    2h 620 +20% −43%
    4h 323 −22% −47%
    6h 225 −22% −40%
    12h 111 −9% −20%
    1D 55 +3% −4%

    Zero net-positive timeframes. A few buckets are gross-positive (30m +25%, 2h +20%, 1D +3%) — there’s a faint directional signal — but the trade counts are brutal (18,310 on 5m) and fees bury every one of them. The daily is the least-bad at −4%, still behind holding.

    DMI net return by timeframe all negative, minus 100 on 5 minute, minus 4 on daily

    Axis 2 — The ADX Filter (the honest twist)

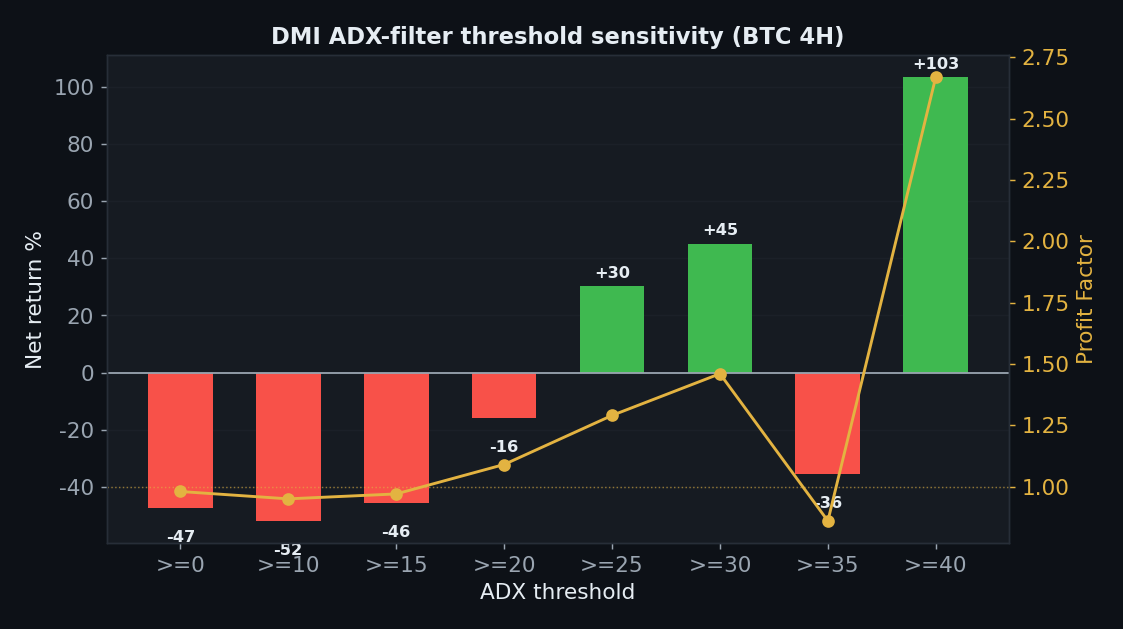
    Here is where DMI differs from a plain oscillator. ADX was designed as a filter — “only trade when the trend is strong.” So we swept the minimum-ADX threshold on BTC 4H.

    ADX filter Trades Net PF
    ≥0 (raw cross) 323 −47% 0.98
    ≥10 319 −52% 0.95
    ≥15 261 −46% 0.97
    ≥20 195 −16% 1.09
    ≥25 115 +30% 1.29
    ≥30 64 +45% 1.46
    ≥35 44 −36% 0.86
    ≥40 23 +103% 2.67

    This is the one genuinely interesting result on this site. The raw crossover (ADX≥0) loses 47%, but requiring ADX≥25–30 flips it positive (+30% to +45%) on a still-reasonable 64–115 trades — consistent with the theory that DI crosses only pay inside strong trends. But do not over-read it. The surface is unstable (ADX≥35 drops back to −36%), and the eye-catching ADX≥40 (+103%) rests on just 23 trades — classic over-fit. The filter’s proper use shows a flicker of merit, but the crossover that’s actually taught — unfiltered — has no edge, and even the filtered version is fragile and would still face the yearly problem below.

    DMI ADX filter threshold sensitivity, raw cross loses, ADX 25 to 30 turns positive, 40 is 23-trade overfit

    Axis 3 — TP:SL

    Fixing the stop at 2.5×ATR and sweeping the take-profit ratio on BTC 4H:

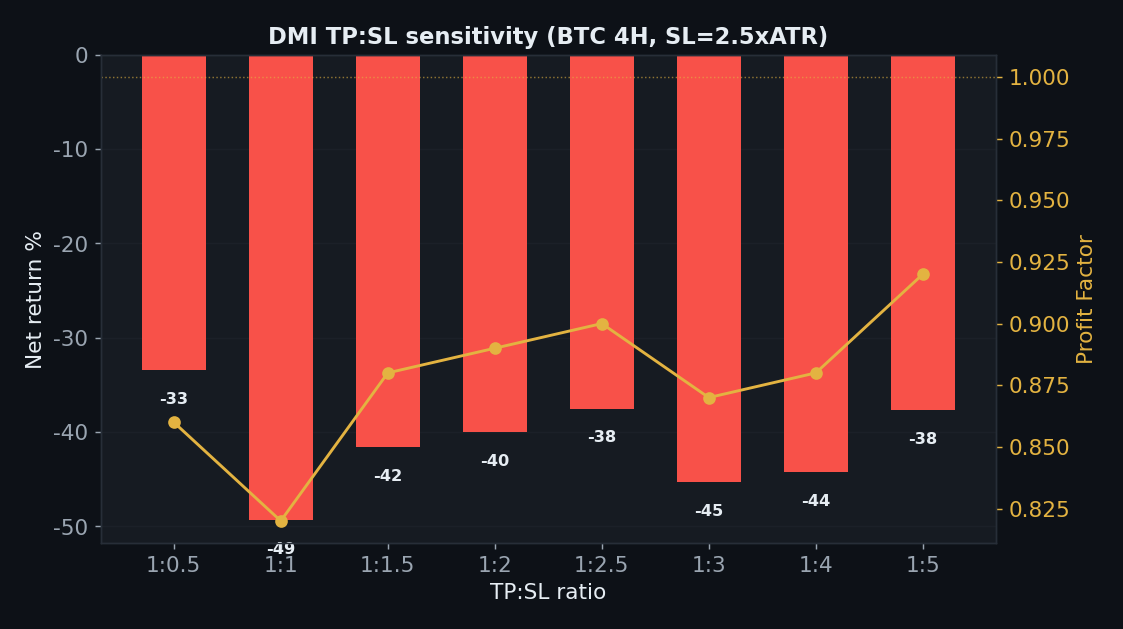
    TP:SL Net PF
    1:0.5 −33% 0.86
    1:1 −49% 0.82
    1:1.5 −42% 0.88
    1:2 −40% 0.89
    1:2.5 −38% 0.90
    1:3 −45% 0.87
    1:4 −44% 0.88
    1:5 −38% 0.92

    Unlike some strategies, there is no take-profit setting that rescues the DI crossover — every ratio from 1:0.5 to 1:5 loses (−33% to −49%). A signal that’s wrong 71% of the time can’t be fixed by adjusting where you take profit.

    DMI TP:SL sensitivity all negative, no take-profit ratio rescues a 29 percent win rate

    Axis 4 — Five Coins

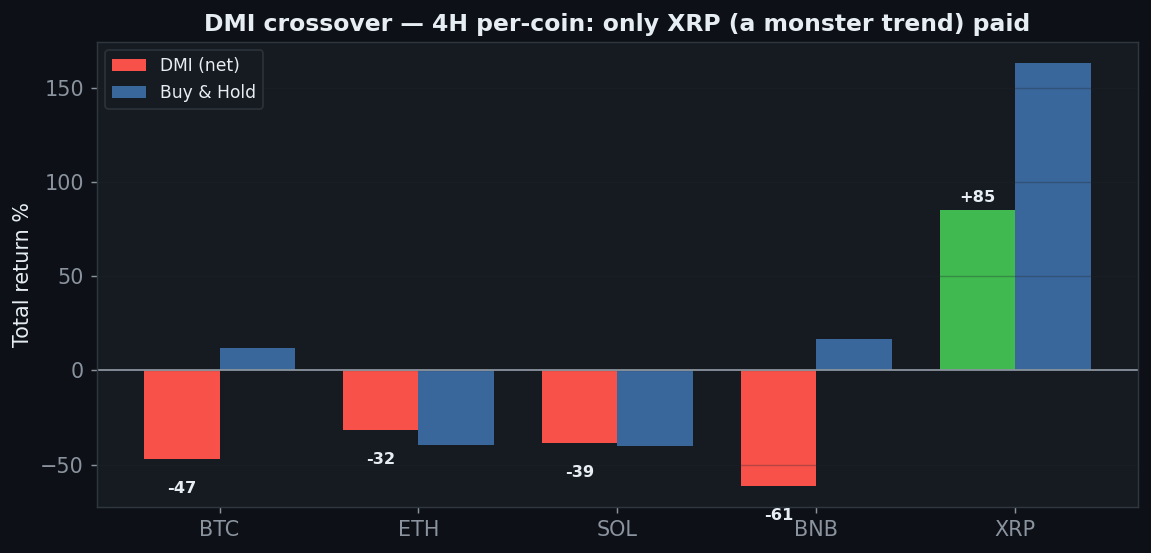
    Coin DMI net Buy & Hold Excess
    BTC −47% +12% −59pp
    ETH −32% −40% +8pp
    SOL −39% −40% +2pp
    BNB −62% +17% −79pp
    XRP +85% +163% −78pp

    Only XRP (1 of 5) is net-positive, and even it (+85%) badly trails its own buy & hold (+163%). BTC loses 47%, BNB 62%. The one green coin is the one that trended hardest — trend-luck, not edge.

    DMI five coins 4H, only XRP positive plus 85, BTC minus 47 BNB minus 62

    Axis 5 — Yearly

    Year BTC 4H net
    2024 +16%
    2025 −58%
    2026 (to Jul) +7%

    2024 and 2026 are positive, but 2025’s −58% is catastrophic and sinks everything. This is even more regime-dependent than most: a laggy crossover in a choppy, mean-reverting year gets destroyed.

    Axis 6 — Friction & Out-of-Sample

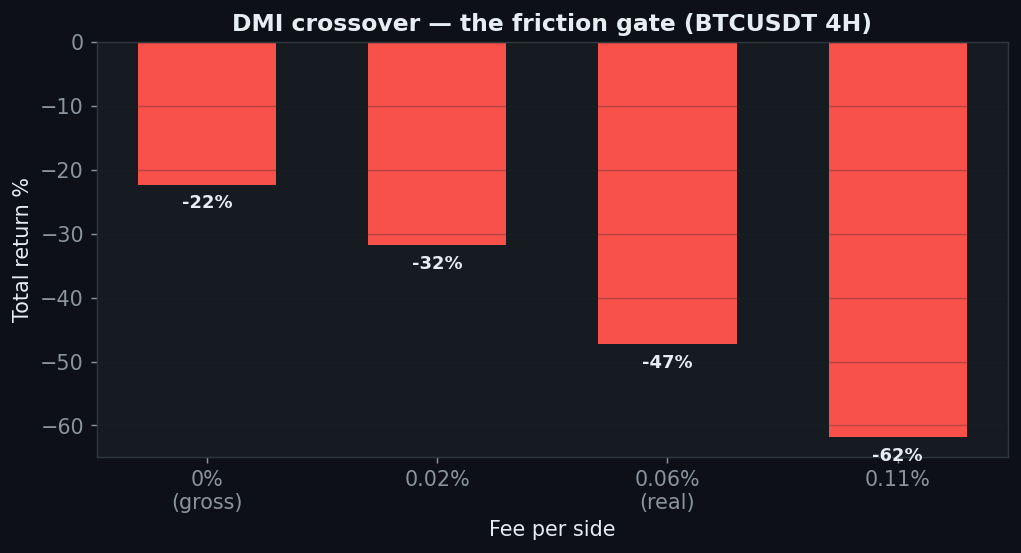
    DMI friction gate minus 22 percent gross to minus 47 percent net BTC 4H

    Friction (BTC 4H): −22% gross → −47% net at 0.06%. The out-of-sample split looks green — 4 of 5 coins positive out-of-sample — but don’t be fooled: the full-sample is a 47% wipeout, and a less-bad final six months after that is a window artifact, not evidence of edge. We report it rather than lean on it.

    The Verdict: REJECT

    • Gate 0 — Indicator fidelitypass (standard Wilder DMI(14): +DI/−DI/ADX)
    • Gate 1 — Sanitypass (signal on the closed bar, no look-ahead)
    • Gate 2 — Frictionfail (−22% at zero fees on 4H, −47% net; 5m → −100%)
    • Gate 3 — Yearly consistencyfail (2024 +16 / 2025 −58 / 2026 +7 — 2025 is catastrophic)
    • Gate 4 — Out-of-samplefail (window artifact) (4/5 looks green but the full sample is a −47% wipeout)
    • Gate 5 — Robustnessfail (raw crossover loses; the ADX≥25–30 filter helps but is unstable, and ≥40 is 23-trade over-fit)
    • Gate 6 — Multi-marketfail (1 of 5 coins; only XRP, a monster trender)
    • Gate 7 — vs Buy & Holdfail (0 of 5 timeframes beat holding; net-positive on one coin)

    ADX measures trend strength; the DI crossover measures direction — too late. By the time +DI and −DI swap places a move is half-spent, and a 29% win rate is the arithmetic of always arriving after the party. The one honest bright spot is that ADX used as a filter (≥25–30) nudges the crossover positive — which is exactly how Wilder intended ADX to be used, and an argument against trading the naked cross at all. But that edge is unstable, single-regime, and evaporated in 2025. As the taught crossover, DMI is a reject.

    FAQ

    You’re supposed to use ADX as a filter, not trade the raw cross.
    Agreed — and that’s the point. The raw crossover is what’s taught to beginners, so we tested it; it loses. Filtering to ADX≥25–30 does help, but our sweep shows that edge is fragile (it breaks by ≥35) and the standout ≥40 result is 23 trades of noise. A real ADX-filtered system would still have to clear the yearly and multi-coin gates, where it stumbles.

    Why is the win rate so low?
    Directional movement has to build before the DI lines cross, so entries lag; in ranges the lines cross repeatedly. Being right on direction but late means small wins and frequent stop-and-reverse losses — 29% winners.

    Can I replicate this?
    Yes — Wilder DMI(14), +DI/−DI crossover, public Binance data, 0.06%/side, five coins, nine timeframes. Every table reproduces.

    See also: Donchian / Turtle Breakout, Triple SuperTrend, UT Bot, Parabolic SAR, and the conditional passes VWAP and Ichimoku (daily).


    Disclaimer: educational research, not financial advice. Past performance does not guarantee future results. Never trade money you cannot afford to lose.
  • Donchian / Turtle Breakout Strategy Backtest: the Legend That Crypto Chop Shredded

    Donchian / Turtle Breakout Strategy Backtest: the Legend That Crypto Chop Shredded

    In 1983 the commodity trader Richard Dennis made a bet with his partner William Eckhardt: can trading be taught? Dennis recruited novices through a newspaper ad, handed them a handful of mechanical rules, and — as the legend goes — they went on to make hundreds of millions of dollars. That is the most famous story in trading, the Turtle Traders, and its core entry rule is today’s subject: the Donchian channel breakout.

    The rule is beautifully simple. When price closes above the highest high of the last 20 bars, go long; when it closes below the 20-bar low, go short. You catch a trend at the moment it breaks out and ride it until the opposite signal. Forty years on, “breakouts” are still sold relentlessly in courses and on YouTube. So does the most famous breakout system in history survive on 2024–26 crypto? We swept it across 5 coins, 9 timeframes, and four more axes. Verdict: reject — but the sensitivity analysis reveals something more interesting than a plain failure: a result that turns the Turtle philosophy against itself.

    Methodology

    We never judge on a single setting — one good result can be luck or cherry-picking, so every axis is swept for robustness.

    • Data: Binance spot, Jul 2024–Jul 2026 (2 years), BTC/ETH/SOL/BNB/XRP
    • Timeframes: 5m–1D (9 buckets, incl. resampled)
    • Execution: on the bar close, no look-ahead (the channel uses only the prior 20 bars)
    • Friction: 0.06%/side (real); we also report the 0-fee gross so you can see the raw edge
    • Benchmark: buy & hold. Six robustness axes: timeframe, parameter, TP:SL, multi-coin, yearly, out-of-sample

    Gate 0 — Fidelity

    Standard Donchian: the upper channel is the highest high and the lower channel the lowest low of the prior 20 bars (the window is shifted back one candle so the signal never peeks at the current bar). Close above the upper channel → long; close below the lower → short. This is the Turtle entry, reproduced without distortion (pass).

    The Exact Rules

    • Signal: close breaks the 20-bar high → long; breaks the 20-bar low → short (stop-and-reverse)
    • Default: channel length 20 (the classic Turtle system)
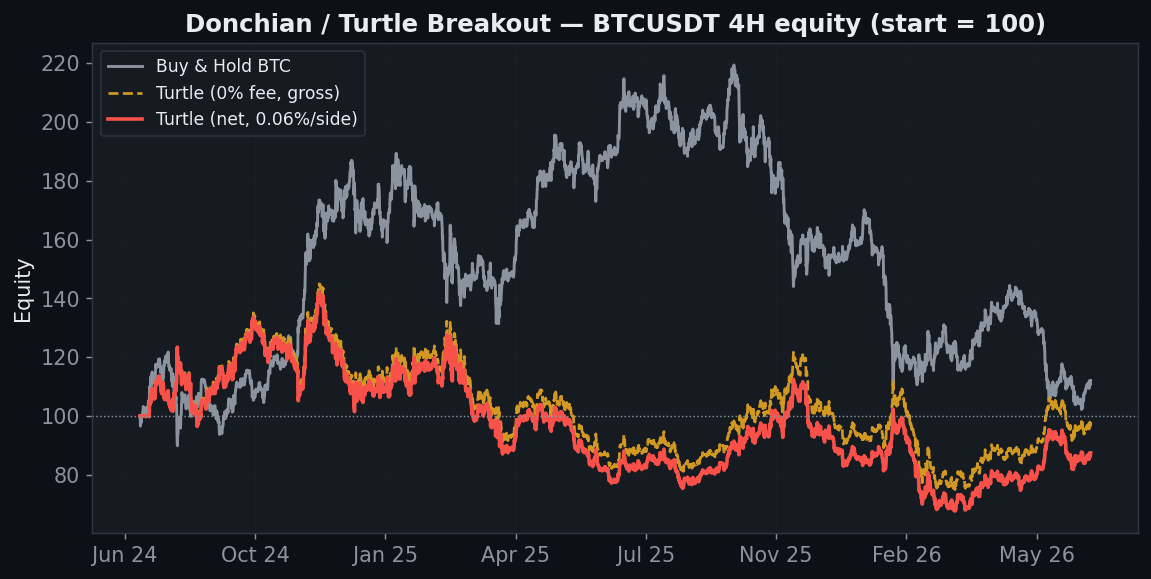
    Donchian Turtle breakout BTC 4H equity minus 13 percent net, gross near minus 2 percent, buy and hold plus 12

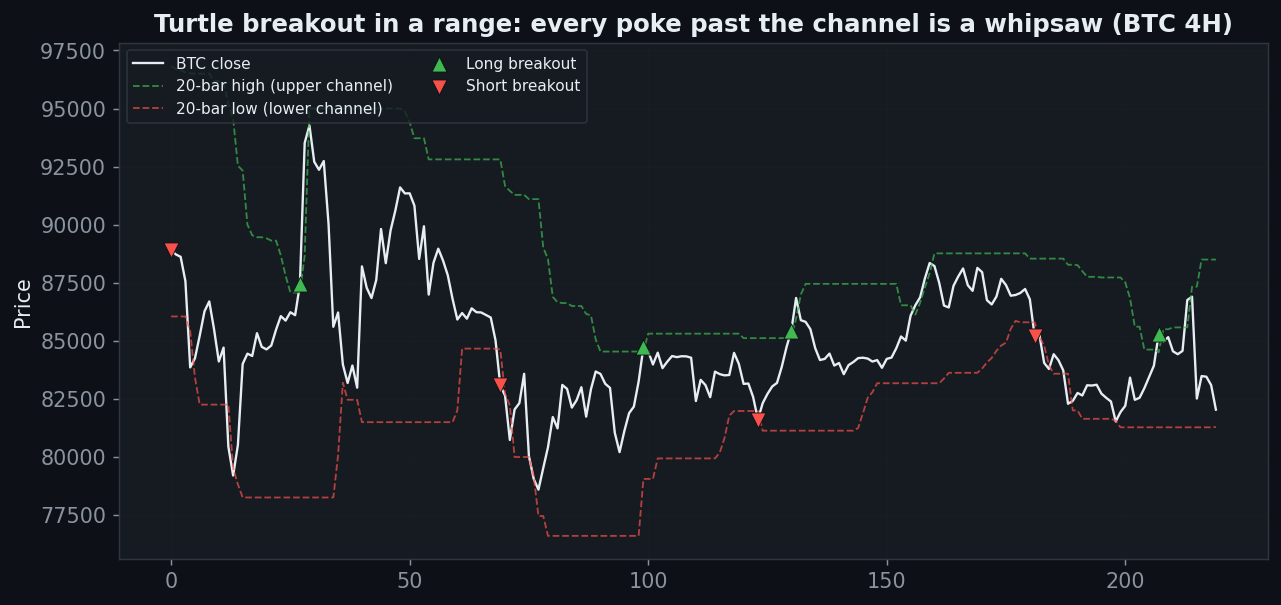
    On BTC 4H the Turtle ends at −13% while simply holding was +12%. The number that matters, though, is the gross (0-fee) line — it finishes near −2%. Losing without paying a cent in fees means this isn’t “friction ate the edge”; it’s that there is almost no gross edge to begin with on the majors. A good strategy has a large gross return that costs merely shrink. The Turtle starts near zero.

    Why It Bleeds: the Curse of Chop

    Donchian 20-bar channel on BTC 4H, breakouts in a range whipsaw, long and short pokes fail repeatedly

    The mechanism is in this one chart. Crypto majors spend most of their time ranging, not trending. Inside a range, every poke above the 20-bar high fires a long — and price falls straight back into the channel. It pokes below, the system flips short, and price rebounds. A rule built to catch trends turns every breakout into a false signal when there’s no trend, and being stop-and-reverse it takes the bait every single time: 94 flips on 4H, 5,268 on the 5-minute. The rule that made legends in the quietly-trending futures of the 1980s gets sawn apart by sideways crypto.

    Axis 1 — Timeframe (gross vs net)

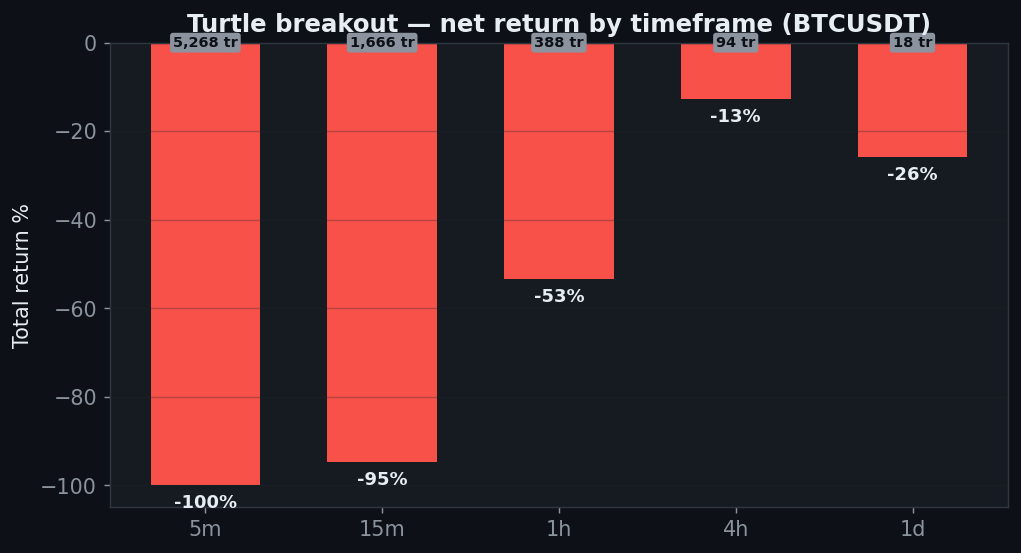
    Fast charts fire too often (fee-bleed); slow charts enter too late. We swept nine buckets on BTC.

    Timeframe Trades Gross (0 fee) Net (real)
    5m 5,268 −69% −100%
    15m 1,666 −60% −95%
    30m 811 −18% −69%
    1h 388 −26% −53%
    2h 190 +8% −14%
    4h 94 −2% −13%
    6h 68 −22% −28%
    12h 36 −18% −22%
    1D 18 −24% −26%

    Zero timeframes are net-positive. The only gross-positive bucket is 2H at +8% — and 190 trades of fees turn that into −14%. Everything else is negative before fees. The 5,268-trade 5-minute is textbook over-trading suicide.

    Turtle breakout net return by timeframe all negative, minus 100 on 5 minute, minus 26 on daily

    Axis 2 — Channel Length (parameter)

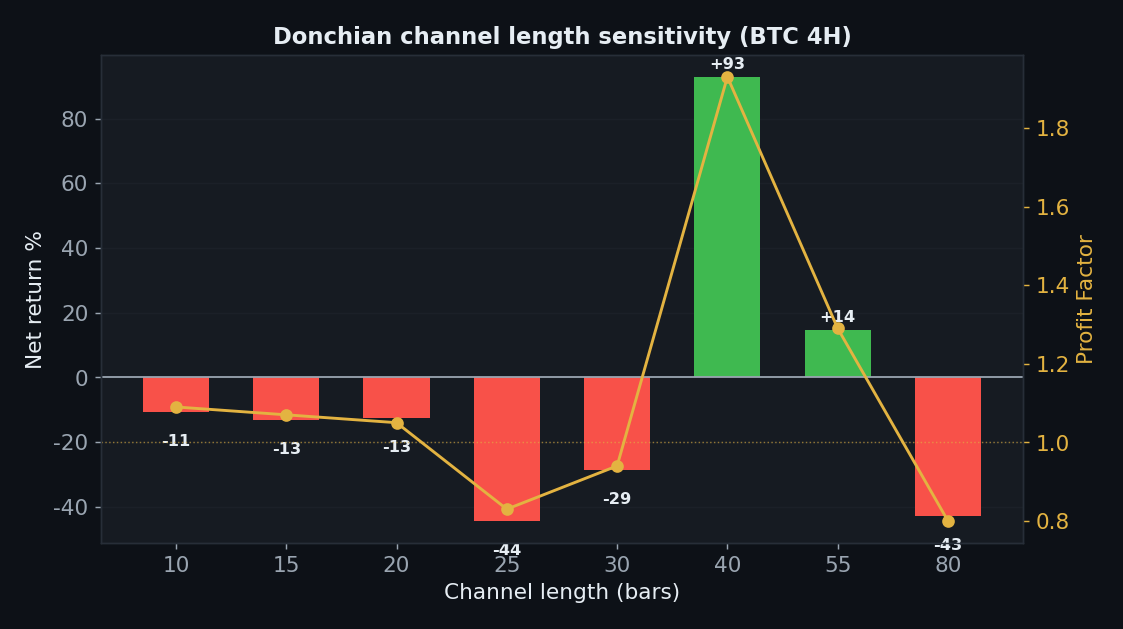
    Is the default 20 just an unlucky value? We swept the channel length on BTC 4H.

    Channel length Net PF
    10 −11% 1.09
    15 −13% 1.07
    20 (default) −13% 1.05
    25 −44% 0.83
    30 −29% 0.94
    40 +93% 1.93
    55 +14% 1.29
    80 −43% 0.80

    Here honesty matters. 40 bars prints +93% and 55 bars +14% — but the neighbours collapse: 25 (−44%), 30 (−29%), 80 (−43%). A surface that swings from −44% to +93% between adjacent settings isn’t an edge, it’s over-fitting noise. The 40-bar spike is one channel width that happened to land on a couple of BTC’s big waves; move to another length or coin and it evaporates. That most lengths — the default 20 included — lose is the real signal.

    Donchian channel length sensitivity BTC 4H, chaotic surface, 40-bar spike plus 93 is overfit noise, default 20 loses

    Axis 3 — TP:SL (and the Turtle’s own philosophy, betrayed)

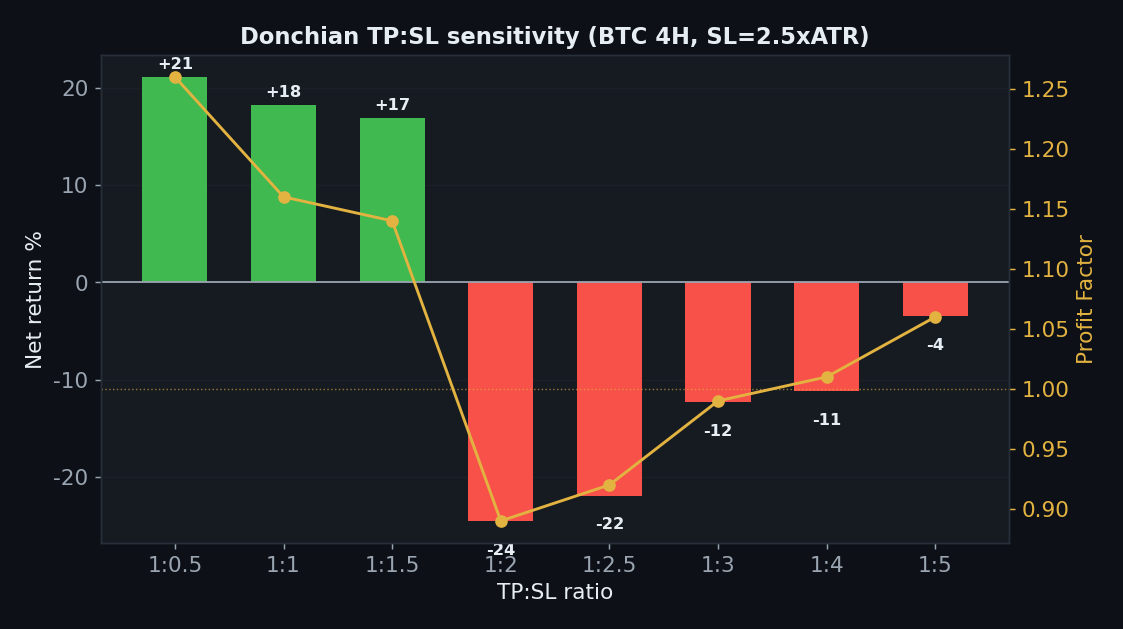
    The Turtle creed is “cut losses short, let winners run.” So what happens when we vary the take-profit? We fixed the stop at 2.5×ATR and swept the TP:SL ratio on BTC 4H.

    TP:SL Net PF
    1:0.5 +21% 1.26
    1:1 +18% 1.16
    1:1.5 +17% 1.14
    1:2 −24% 0.89
    1:2.5 −22% 0.92
    1:3 −12% 0.99
    1:4 −11% 1.01
    1:5 −4% 1.06

    A stunning reversal: only the tight take-profits (1:0.5 to 1:1.5) are positive (+17% to +21%), while every “let it run” wide target (1:2 and beyond) loses. In other words, the only way this breakout made money was by grabbing a small profit immediately and getting out — scalping the breakout, the exact opposite of the Turtle’s “let winners run.” To profit with the Turtle rule on crypto you’d have to stop being a Turtle. And even that edge is a shallow, single-coin, single-timeframe result.

    Donchian TP:SL sensitivity BTC 4H, only tight take-profit 1 to 0.5 through 1.5 positive, wide let-it-run targets all negative

    Axis 4 — Five Coins (strategy vs buy & hold)

    Coin Turtle net Buy & Hold Excess
    BTC −13% +12% −25pp
    ETH −55% −40% −15pp
    SOL −31% −40% +9pp
    BNB −32% +17% −49pp
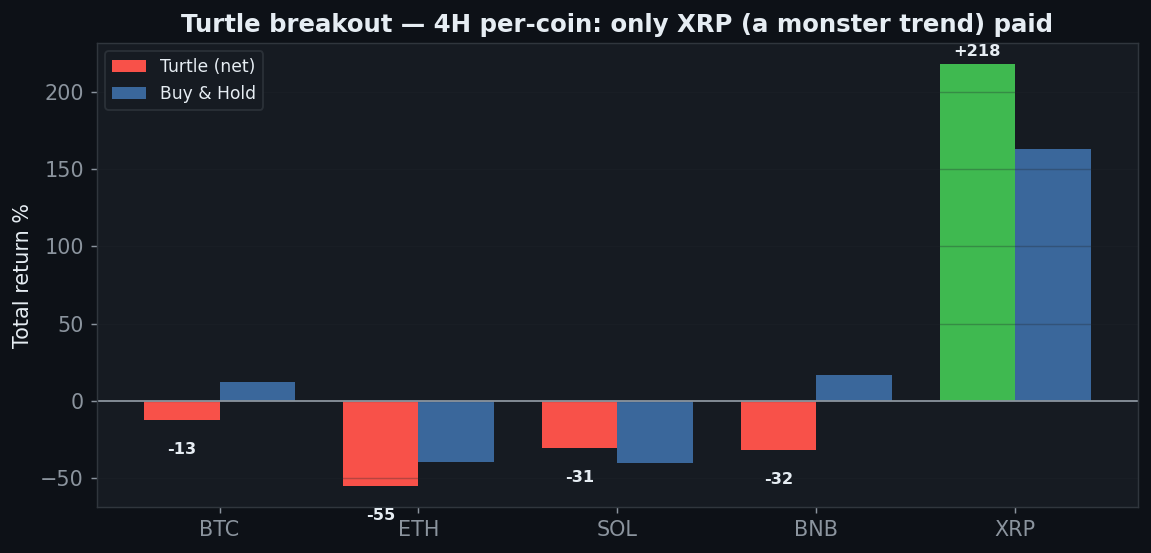
    XRP +218% +163% +55pp

    Only one coin (XRP, 1 of 5) ends net-positive, because XRP trended monstrously and the breakout caught the ride. SOL merely lost less than holding; it’s still −31%. A system that only truly profits on the single cleanest trend in the sample isn’t an edge — it’s trend-luck.

    Turtle breakout five coins 4H, only XRP positive plus 218, BTC ETH SOL BNB negative

    Axis 5 — Yearly (regime dependence)

    Year BTC 4H net
    2024 +11%
    2025 −25%
    2026 (to Jul) +5%

    Two of three years are positive — but 2025’s −25% sinks the whole total (−13%). It earns in years with a trend and hemorrhages in the year that ranged. If you can’t know in advance which year will trend, that spread is the risk.

    Axis 6 — Friction & Out-of-Sample

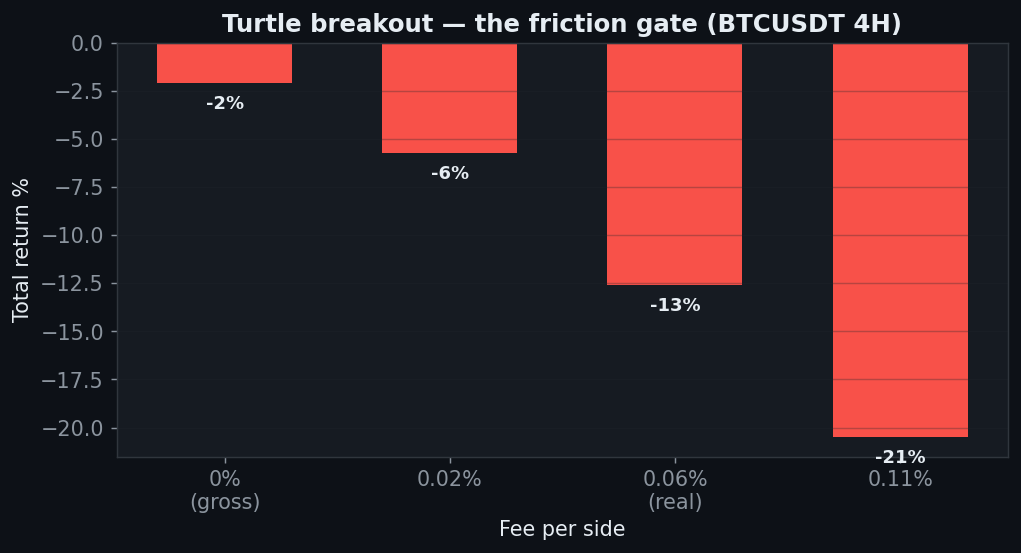
    Turtle breakout friction gate, minus 2 percent gross to minus 13 percent net on BTC 4H

    Friction gate (BTC 4H): −2% at zero fees → −6% at 0.02% → −13% at 0.06% → −21% at 0.11%. As we saw, it’s already negative gross, so fees aren’t even the main culprit — there’s nothing to harvest. Out-of-sample: train on the first 18 months, test on the last 6, and only 1 of 5 coins stays positive out-of-sample. The in-sample winners mostly collapse.

    The Verdict: REJECT

    • Gate 0 — Indicator fidelitypass (standard 20-bar Donchian, the classic Turtle rule, no look-ahead)
    • Gate 1 — Sanitypass (channel from the prior 20 bars; signal on the closed bar)
    • Gate 2 — Frictionfail (already −2% at zero fees on 4H, −13% net; 5m → −100%)
    • Gate 3 — Yearly consistencyfail (2024 +11 / 2025 −25 / 2026 +5 — 2025 sinks the total; regime-dependent)
    • Gate 4 — Out-of-samplefail (1 of 5 coins positive out-of-sample)
    • Gate 5 — Robustnessfail (parameter surface swings wildly; the default 20 loses; the 40-bar +93% is over-fit noise)
    • Gate 6 — Multi-marketfail (1 of 5 coins on 4H — only XRP, a monster trender)
    • Gate 7 — vs Buy & Holdfail (net-positive on total return for only one coin, XRP)

    The Turtle breakout is a trend engine with no trend to ride. Buying 20-bar highs works when a market trends quietly and persistently — the 1980s futures that made the Turtles famous. On 2024–26 crypto majors, which chop far more than they trend, it pokes in and out of a range hundreds of times and bleeds. The sharper lesson is in the sensitivity sweep: the only ways to make money with this rule were to curve-fit one channel length or to scalp tiny profits — a betrayal of the “let winners run” doctrine the Turtle is built on. It isn’t that breakouts are broken; it’s that a naked breakout is only as good as the trend behind it, and the majors didn’t provide one.

    FAQ

    The Turtles used stops, sizing and pyramiding, not just the entry.
    True — the full system layered ATR sizing, stops and unit-adds on top. Those shape the equity curve’s risk, but they can’t create an edge where the entry has none; money-management doesn’t turn a −2%-gross signal into a winner. And the TP:SL sweep above argues for short profits, which directly contradicts pyramiding and trend-riding.

    40 bars made +93% — why not use that?
    That’s the trap. Only 40 is a spike; 25/30/80 are −44/−29/−43%. A single tuned point rather than a smooth plateau is the signature of over-fitting; there’s no reason it repeats out-of-sample or on other coins.

    Breakouts work in stocks and futures, though.
    Often, in markets that trend persistently. The finding is narrow and honest: 2024–26 crypto majors ranged, and a bare 20-bar breakout gets whipsawed by chop. XRP shows what a real trend does for it (+218%).

    Can I replicate this?
    Yes — Donchian(20) channel breakout, public Binance data, 0.06%/side, five coins, nine timeframes. Every table above reproduces with the same method.

    See also: Triple SuperTrend, UT Bot, Range Filter, Parabolic SAR, and the conditional passes VWAP and Ichimoku (daily).


    Disclaimer: educational research, not financial advice. Past performance does not guarantee future results. Never trade money you cannot afford to lose.
  • Parabolic SAR Strategy Backtest: A Trailing Stop in Disguise

    Parabolic SAR Strategy Backtest: A Trailing Stop in Disguise

    The Parabolic SAR — those little dots that flip above and below price — is one of Welles Wilder’s original 1978 inventions. Here is the detail almost every tutorial skips: Wilder built it as a trailing stop, a “stop and reverse” tool to protect and exit an existing position. Somewhere along the way retail turned it into an entry signal: go long when the dots flip below, short when they flip above. Does a trailing stop make a good entry trigger? We ran the standard SAR (0.02 step, 0.20 max) through the 7-Gate Protocol. Verdict: reject — though it fails more honestly than most.

    Gate 0 — Fidelity

    Standard Wilder SAR: acceleration factor starts at 0.02, steps up 0.02 each time a new extreme prints, capped at 0.20. When price crosses the SAR, it flips and reverses. This is the exact recurrence from Wilder’s book, reproduced bar by bar.

    The Exact Rules

    • Signal: price closes across the SAR → flip. Above SAR = long, below = short (stop-and-reverse, always in the market)
    • Settings: 0.02 / 0.02 / 0.20 (the universal default)
    • Execution: on the bar close, no look-ahead; 0.06%/side; Binance spot Jul 2024–Jul 2026; BTC/ETH/SOL/BNB/XRP; 5m–1D; benchmark buy & hold
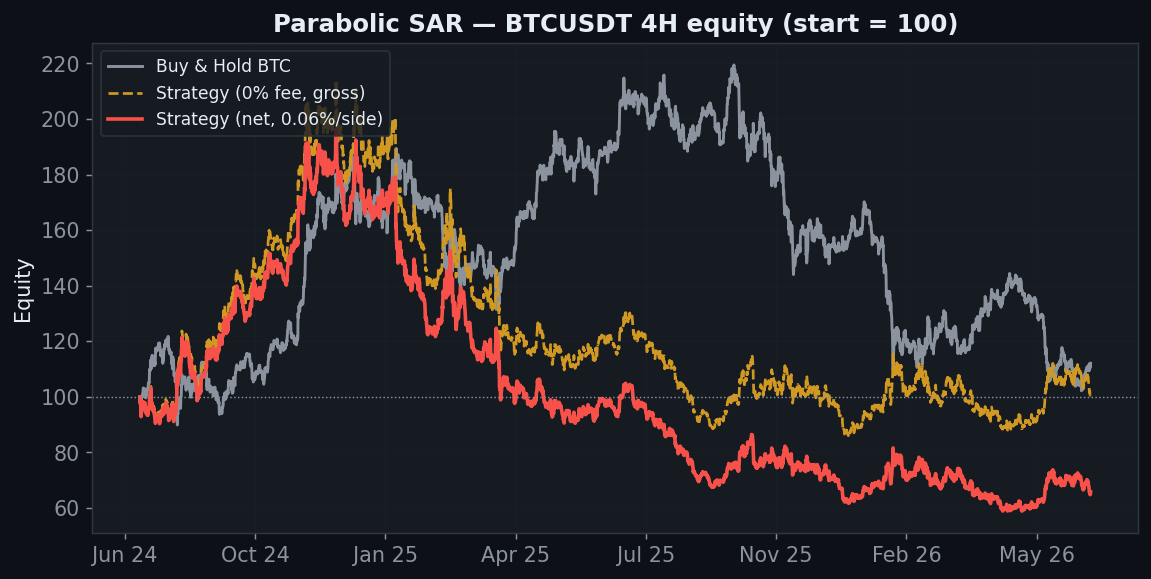
    Parabolic SAR BTC 4H equity minus 34 percent net, gross barely positive, narrower friction gap than oscillators

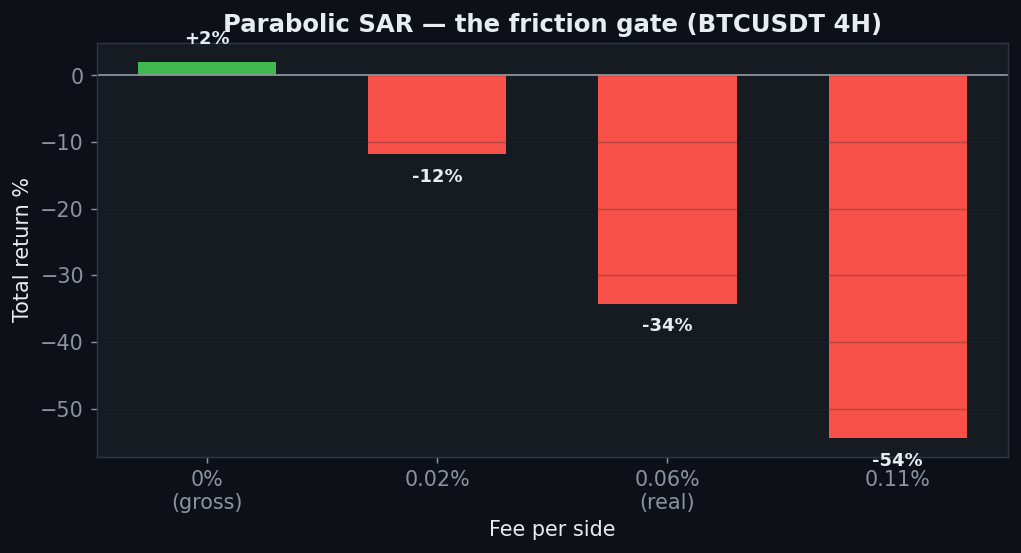
    BTC 4H settles at −34%. As with the other flippers, the gross line clears zero (+2%) and the net line sinks — but the gap here is narrower, and that hint matters: SAR is doing something real when a trend actually exists.

    Gate 6 — It Only Pays on Coins That Trended Hard

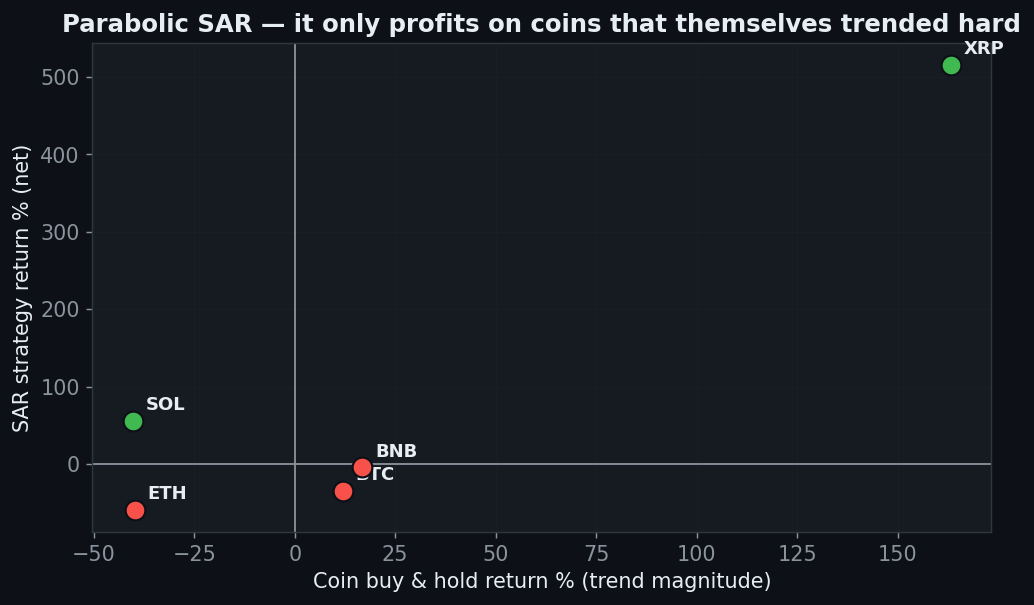
    Parabolic SAR only profits on hard trending coins, XRP plus 516 and SOL positive, BTC ETH BNB negative scatter

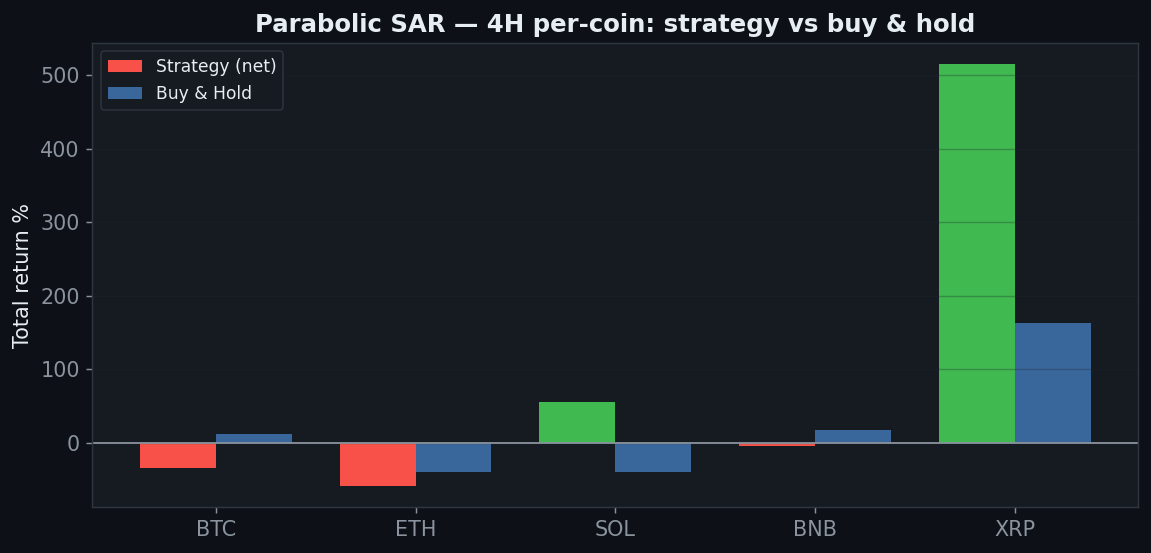
    This scatter is the honest picture of SAR. Its two profitable coins on 4H are XRP (+516%) and SOL (+56%) — the two names with the largest, cleanest directional moves in the sample. On XRP, SAR even beats buy & hold (+516% vs +163%). But on the choppier majors — BTC, ETH, BNB — it whipsaws to losses. Catching a big trend is necessary for SAR to work, and not sufficient: ETH fell 40% too, yet SAR still lost on it because the descent was choppy. A strategy that only prints on the two cleanest trenders is a trend-rider, not a general edge.

    Gate 2 — Friction Still Wins

    Parabolic SAR friction gate, plus 2 percent gross to minus 34 percent net on BTC 4H

    SAR’s gross 4H edge is a slim +2%, and a realistic 0.06%/side turns it into −34%. On fast timeframes it is a massacre — 5m and 15m both go to −100% on thousands of flips. The dots move on every minor wiggle, and every wiggle costs a fee. Its best clean timeframe is the daily, which finally turns positive at +8% — but even that still trails simply holding BTC (+13%).

    Gate 6b — Five Coins & Robustness

    Parabolic SAR five coins 4H, only XRP and SOL positive, both trend outliers

    Two of five coins positive on 4H, both trend outliers; the parameter sweep is 0 of 6. To its credit, SAR posts the least-bad out-of-sample result of the pure flippers — 4 of 5 coins positive out-of-sample — which is consistent with a genuine but narrow trend-capturing tendency. It just isn’t enough, often enough, to beat holding after costs.

    The Verdict: REJECT

    • Gate 0 — Indicator fidelitypass (Wilder’s SAR, 0.02 step to 0.20 cap, reproduced bar by bar)
    • Gate 1 — Sanitypass (signal on the closed bar, no look-ahead)
    • Gate 2 — Frictionfail (+2% gross → −34% net on 4H; 5m and 15m → −100%)
    • Gate 3 — Yearly consistencyfail (negative on the tradeable timeframes; only the daily scrapes +8%)
    • Gate 4 — Out-of-samplepartial (4 of 5 coins positive out-of-sample — its one genuine bright spot)
    • Gate 5 — Robustnessfail (0 of 6 acceleration × cap cells positive on 4H)
    • Gate 6 — Multi-marketpartial (2 of 5 coins on 4H — but only XRP and SOL, the hardest trenders)
    • Gate 7 — vs Buy & Holdfail (even the daily +8% trails holding +13%)

    Parabolic SAR is a trailing stop wearing an entry signal’s costume. Used as Wilder intended — to ride and protect a position you already hold — it is a legitimate tool. Flipped into a stand-alone entry trigger, it only earns its keep on the cleanest, hardest trends (XRP, SOL), whipsaws on everything choppier, bleeds to fees on fast charts, and even at its best — the daily — still can’t beat holding. It fails more honestly than the oscillators, because when a real trend shows up it does catch it. But “catches trends, loses to chop and costs” is not a system you can trade blind.

    FAQ

    SAR was never meant to be an entry — you’re testing it wrong.
    That’s exactly the point, and we say so up front. Retail widely trades the flip as an entry, so we measured that. Used as a trailing stop on top of a separate entry, SAR can be perfectly reasonable — that’s a different system, and it would need its own test.

    XRP made +516% — isn’t that great?
    On one coin, in one direction, in a sample where XRP itself ran hard. Two of five coins profitable, a 0/6 sweep, and sub-holding returns on the daily are what tell you it’s a trend-rider that got one clean ride, not a repeatable edge.

    Can I replicate this?
    Yes — SAR(0.02, 0.02, 0.20), public Binance data, 0.06%/side, five coins, five timeframes.

    See also: RSI 30/70, Stochastic, MACD crossover, UT Bot, and the conditional passes VWAP and Ichimoku (daily).


    Disclaimer: educational research, not financial advice. Past performance does not guarantee future results. Never trade money you cannot afford to lose.
  • Stochastic Oscillator Strategy Backtest: The Whipsaw Machine

    Stochastic Oscillator Strategy Backtest: The Whipsaw Machine

    The Stochastic oscillator is on every beginner’s screen, usually with the same rule attached: buy when %K crosses above %D, sell when it crosses below. George Lane popularised it in the 1950s as a way to measure momentum’s speed. Seventy years later the %K/%D crossover is still one of the most-taught mechanical signals in retail trading. It also generates an astonishing number of trades — which turns out to be exactly the problem. We ran the standard 14/3/3 through the 7-Gate Protocol. Verdict: reject.

    Gate 0 — Fidelity

    Standard Stochastic: %K is a 3-period smoothing of where price closed within its 14-bar high–low range; %D is a 3-period average of %K. Buy when %K crosses above %D, sell when it crosses below. Identical to every platform’s default. The only question is what happens when you actually trade the cross.

    The Exact Rules

    • Signal: %K crosses above %D → long; %K crosses below %D → short (stop-and-reverse, always in the market)
    • Settings: 14 / 3 / 3 (the universal default)
    • Execution: on the bar close, no look-ahead; 0.06%/side; Binance spot Jul 2024–Jul 2026; BTC/ETH/SOL/BNB/XRP; 5m–1D; benchmark buy & hold
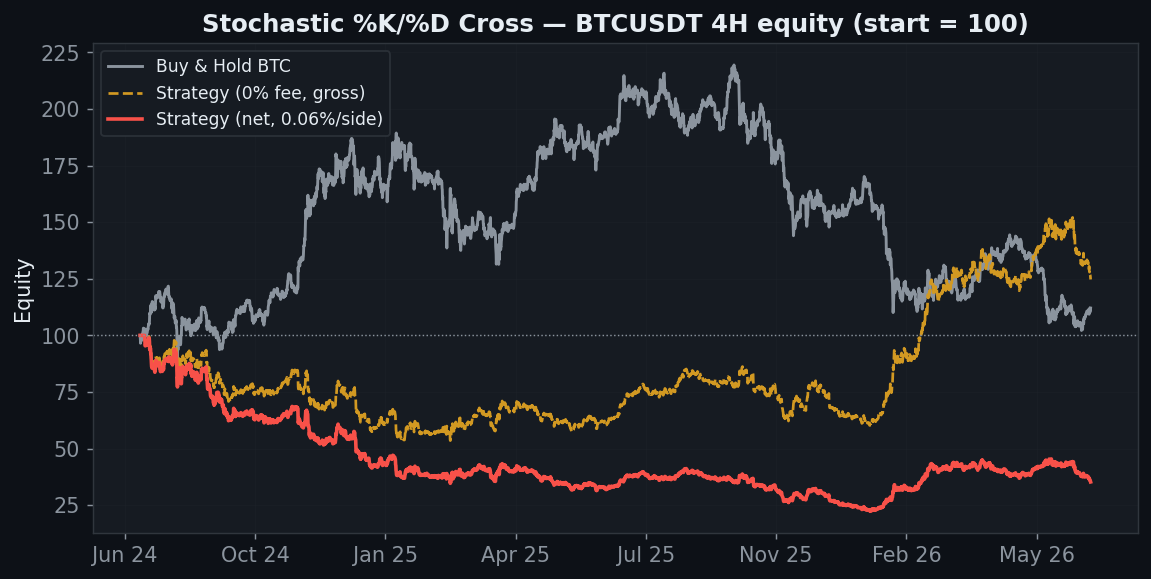
    Stochastic BTC 4H equity, net minus 65 percent while gross zero-fee curve is plus 25 percent, huge friction gap

    BTC 4H ends at −65%. But look at the two strategy lines: the gross (0-fee) curve actually finishes up around +25%, while the net curve craters. That gap is the entire story of this indicator — and it is the widest gap on this whole site.

    Gate 2 — The Most Fee-Sensitive Strategy We’ve Tested

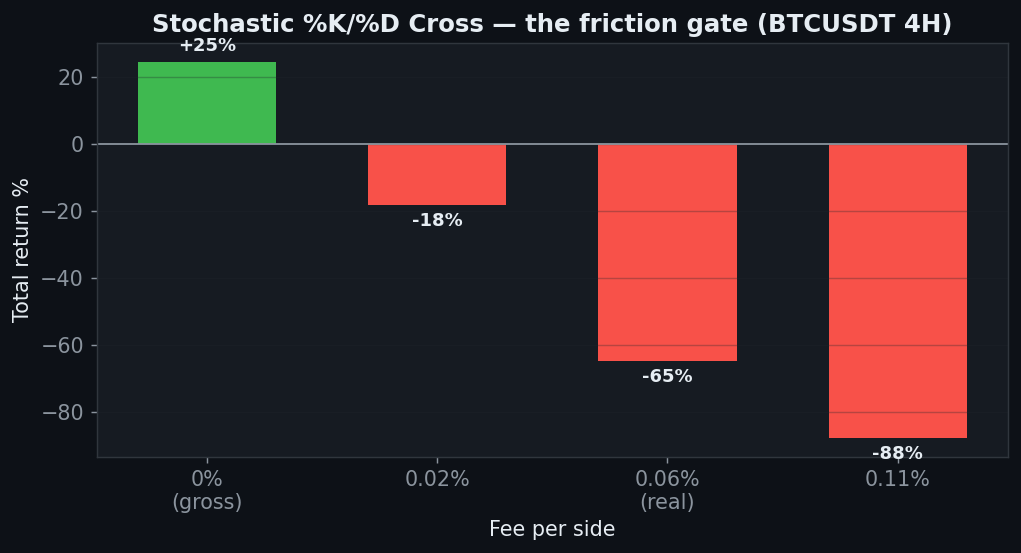
    Stochastic friction gate, plus 25 percent gross becomes minus 65 percent at 0.06 percent fees, most fee sensitive

    At zero fees, BTC 4H makes +25%. Add a gentle 0.02%/side and it drops to −18%. At a realistic 0.06% it is −65%. At 0.11% it is −88%. There is a faint gross edge in the crossover — but harvesting it requires so many trades that the toll dwarfs the prize several times over. No strategy we’ve examined loses more of its gross return to friction than this one.

    Gate 6 — The Whipsaw Machine

    Stochastic whipsaw machine, 51098 trades on 5 minute over two years, trade count explodes on fast timeframes all minus 100

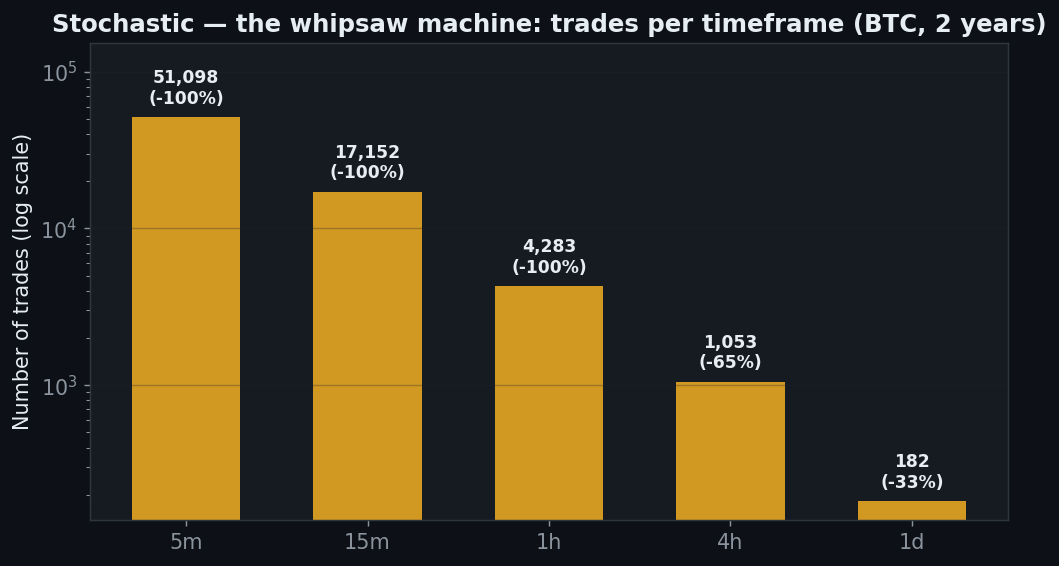
    Why so fee-sensitive? Because %K and %D cross constantly. On BTC 5m the crossover takes 51,098 trades in two years — and the account goes to −100%. 15m: 17,152 trades, −100%. 1h: 4,283, −100%. Even the 4H, the slowest liquid timeframe, is 1,053 trades. Every one of those round-trips pays a fee. Stochastic doesn’t lose because it’s wrong more often than right — it loses because it trades so much that being 40% right at a 0.06% toll is a guaranteed bleed.

    Gate 6b — Five Coins, and a Green Cell That Lies

    Stochastic five coins 4H all negative, zero of five positive

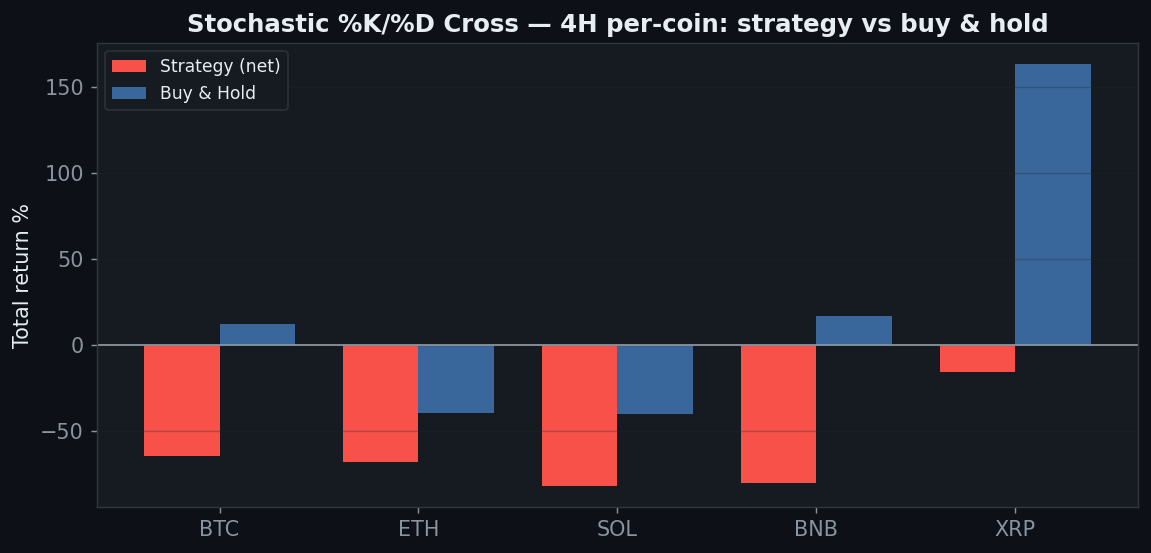
    On 4H, all five coins lose — BTC −65%, ETH −68%, SOL −82%, BNB −80%, XRP −16%. Zero of five. Now, one gate does flash green in the raw data: the out-of-sample split shows 5/5 coins positive over the final six months. Do not be fooled by it. That is a few dozen trades in one short window, sitting at the tail end of a run that lost 65–82% per coin. A brief green patch after a multi-year wipeout is the definition of small-sample noise. It is precisely why we weight full-sample behaviour and friction above a single lucky window — and why we report it rather than cherry-pick it.

    The Verdict: REJECT

    • Gate 0 — Indicator fidelitypass (standard 14/3/3 %K/%D)
    • Gate 1 — Sanitypass (signal on the closed bar, no look-ahead)
    • Gate 2 — Frictionfail (a +25% gross edge on 4H collapses to −65% net — the most fee-sensitive strategy on this site)
    • Gate 3 — Yearly consistencyfail (negative on every timeframe overall)
    • Gate 4 — Out-of-samplefail (noise) (the lone green gate — 5/5 over the last 6 months — is a few-dozen-trade window after a 65–82% loss, not an edge)
    • Gate 5 — Robustnessfail (0 of 6 %K × %D-smoothing cells positive)
    • Gate 6 — Multi-marketfail (0 of 5 coins positive on 4H)
    • Gate 7 — vs Buy & Holdfail (0 of 5 timeframes beat holding)

    The Stochastic crossover is a machine for converting your capital into exchange fees. There is a whisper of a gross edge in the signal, but the crossover fires so relentlessly — tens of thousands of times on fast charts — that friction buries it many times over. Being right 40% of the time is fine if you trade 20 times; it is fatal if you trade 20,000. Stochastic is a reasonable way to read momentum. As a mechanical trade trigger, it is the clearest over-trading autopsy we have.

    FAQ

    You should only take crosses in oversold/overbought zones.
    That’s a filter, and a fair idea — but it’s a different strategy, and “add conditions until the curve turns up” is how over-fitting happens. We tested the crossover that’s actually taught first. A zone-filtered version has to clear the same seven gates, friction included.

    Isn’t the daily better?
    Less catastrophic, not good: the daily is −33% and still loses to holding. Fewer trades means less fee bleed, but the underlying signal still doesn’t predict.

    Can I replicate this?
    Yes — Stochastic(14,3,3), public Binance data, 0.06%/side, %K/%D cross, five coins, five timeframes.

    See also: RSI 30/70, RSI Divergence, MACD crossover, Parabolic SAR, and the conditional passes VWAP and Ichimoku (daily).


    Disclaimer: educational research, not financial advice. Past performance does not guarantee future results. Never trade money you cannot afford to lose.
  • RSI Divergence Strategy Backtest: Prediction, or Hindsight?

    RSI Divergence Strategy Backtest: Prediction, or Hindsight?

    Divergence is the RSI setup that traders swear by: price makes a lower low, but the RSI makes a higher low, and — supposedly — the reversal is coming. It is sold as a leading, predictive signal, the thing that lets you buy the exact bottom. But there is a problem hiding in plain sight: you can only draw a divergence after the second pivot has formed and confirmed. By then the low is already in the past. So is divergence a prediction, or a description of something that already happened? We built the mechanical version — pivot-confirmed RSI(14) divergence — and ran it through the 7-Gate Protocol. Verdict: reject.

    Gate 0 — Fidelity

    Standard Wilder RSI(14). A pivot low is a bar lower than the five bars on each side of it; a pivot high is the mirror. Bullish divergence = price prints a lower pivot low while RSI prints a higher one → go long. Bearish divergence = higher price pivot high with a lower RSI high → go short. This is the textbook definition, mechanised exactly.

    The Exact Rules

    • Signal: confirmed bullish divergence → long; confirmed bearish divergence → short (stop-and-reverse)
    • Pivots: 5 bars left / 5 bars right, RSI period 14
    • The catch: a pivot is only confirmed 5 bars after it forms — so every entry is, by construction, at least 5 bars late. No look-ahead: we act on the confirmation bar’s close.
    • Execution: 0.06%/side; Binance spot Jul 2024–Jul 2026; BTC/ETH/SOL/BNB/XRP; 5m–1D; benchmark buy & hold
    RSI divergence BTC 4H equity curve declines to minus 45 percent versus buy and hold, gross and net nearly identical

    On BTC 4H the curve grinds down to −45% while buy & hold sits around +12%. Note the gross (0-fee) line barely differs — this isn’t a fee problem, there simply isn’t an edge to erode.

    Gate 6 — The Signal-Scarcity Trap

    RSI divergence signals versus trades by timeframe over two years: 4H 49 signals and 19 trades, daily 9 signals and 3 trades, fast timeframes many trades all losing

    Here is the heart of the matter — and first, two numbers that are easy to conflate. The divergence pattern itself appears 49 times on the 4H (23 bullish, 26 bearish) and 9 times on the daily over two years. But this is stop-and-reverse: a signal flips you and you hold until the opposite signal fires, so repeated same-side divergences don’t add trades. That’s why the actual trade count is 19 on the 4H and 3 on the daily (blue = signals, red/green = trades, above). Either way the sample on the high timeframes is thin. The 4H shows the pattern 49 times and still loses 45%; push to faster charts for more signals and you get whipsawed (5m: 1,112 trades, −71%). And the one green result — the daily +12.6% — rests on 9 signals and just three trades. A profit factor of 34.9 on three trades is not an edge; it is a coin landing heads twice. There is no timeframe where divergence is both frequent enough to trust and profitable.

    Gate 6b — Five Coins

    RSI divergence five coins 4H, only ETH and BNB barely positive, SOL minus 57 percent

    On 4H, two of five coins scrape a positive result — ETH +3.1% and BNB +2.2% — and three bleed, with SOL at −57%. “Two of five, by two percent” is what a strategy with no real edge looks like when you spin the wheel five times: some land green by luck. It does not beat buy & hold on any of them where holding was up.

    Gate 2 — Friction & Robustness

    RSI divergence friction gate, negative even at zero fees on BTC 4H

    Because divergence trades so seldom on 4H, fees are not what kills it — it is already −44% at zero cost. The parameter sweep confirms there is nothing to rescue: 0 of 6 RSI-period × pivot-width combinations turn a profit. You cannot tune your way out of a signal that fires late and rarely.

    The Verdict: REJECT

    • Gate 0 — Indicator fidelitypass (standard Wilder RSI(14), pivot-confirmed divergence)
    • Gate 1 — Sanitypass (pivot confirmed 5 bars later; entry on the confirmation close, no look-ahead)
    • Gate 2 — Frictionfail (negative even at 0% fee on 4H, −45%; there is no gross edge to erode)
    • Gate 3 — Yearly consistencyfail (no tradeable timeframe is consistently positive)
    • Gate 4 — Out-of-samplefail (2 of 5 coins positive out-of-sample)
    • Gate 5 — Robustnessfail (0 of 6 RSI-period × pivot-width cells positive on 4H)
    • Gate 6 — Multi-marketfail (2 of 5 coins on 4H, and only by +2–3%)
    • Gate 7 — vs Buy & Holdfail (the only green timeframe, the daily +12.6%, rests on 3 trades and merely ties holding)

    Divergence is a description dressed up as a prediction. You cannot mark it until the second pivot confirms, and by then the reversal — if there is one — has already begun. Mechanised honestly, it fires too rarely to trust on the timeframes where it isn’t losing, and its single profitable result is three trades of noise. As a piece of context on a chart, divergence can be interesting. As a mechanical entry, it does not survive contact with the data.
    FAQ

    You entered too late — real traders anticipate the pivot.
    Anticipating an unconfirmed pivot is guessing, and guessing can’t be backtested honestly. The moment you require confirmation — which is the only rule a computer can follow without peeking — you are late by construction. That lateness is the finding, not a flaw in the test.

    What about hidden divergence / regular divergence only in trends?
    Those are filters layered on top, and “add filters until the backtest looks good” is a different, easily over-fit exercise. We tested the signal that’s actually taught. If a filtered version has a real edge, it has to clear these same seven gates.
    Can I replicate this?
    Yes — RSI(14), 5-bar pivots, public Binance data, 0.06%/side, five coins, five timeframes.

    See also: RSI 30/70, Stochastic, MACD crossover, and the conditional passes VWAP and Ichimoku (daily).


    Disclaimer: educational research, not financial advice. Past performance does not guarantee future results. Never trade money you cannot afford to lose.