Divergence is the RSI setup that traders swear by: price makes a lower low, but the RSI makes a higher low, and — supposedly — the reversal is coming. It is sold as a leading, predictive signal, the thing that lets you buy the exact bottom. But there is a problem hiding in plain sight: you can only draw a divergence after the second pivot has formed and confirmed. By then the low is already in the past. So is divergence a prediction, or a description of something that already happened? We built the mechanical version — pivot-confirmed RSI(14) divergence — and ran it through the 7-Gate Protocol. Verdict: reject.
Gate 0 — Fidelity
Standard Wilder RSI(14). A pivot low is a bar lower than the five bars on each side of it; a pivot high is the mirror. Bullish divergence = price prints a lower pivot low while RSI prints a higher one → go long. Bearish divergence = higher price pivot high with a lower RSI high → go short. This is the textbook definition, mechanised exactly.
The Exact Rules
- Signal: confirmed bullish divergence → long; confirmed bearish divergence → short (stop-and-reverse)
- Pivots: 5 bars left / 5 bars right, RSI period 14
- The catch: a pivot is only confirmed 5 bars after it forms — so every entry is, by construction, at least 5 bars late. No look-ahead: we act on the confirmation bar’s close.
- Execution: 0.06%/side; Binance spot Jul 2024–Jul 2026; BTC/ETH/SOL/BNB/XRP; 5m–1D; benchmark buy & hold
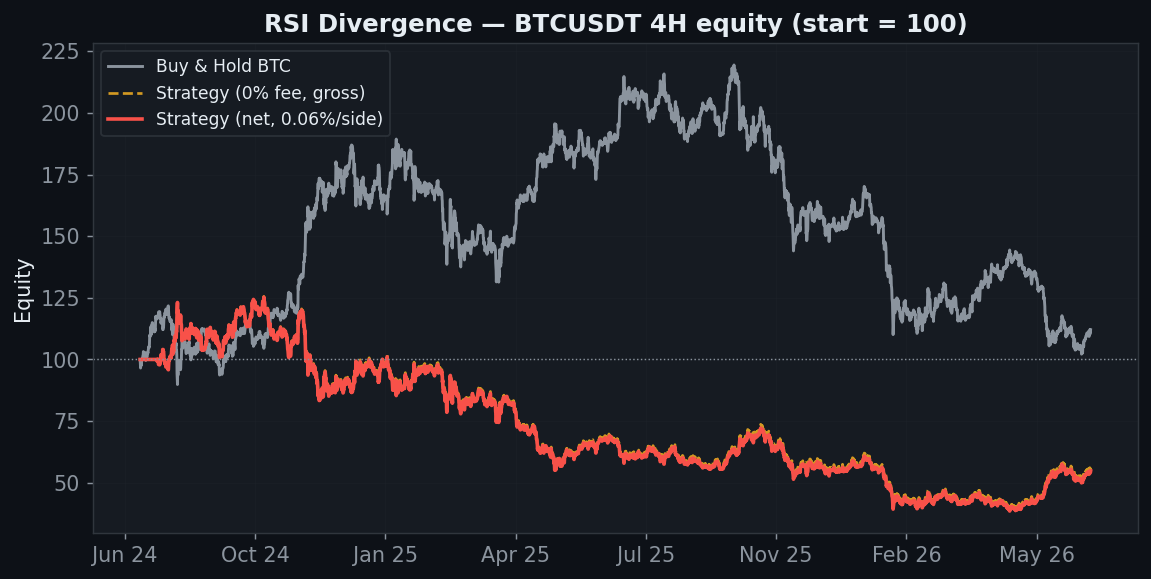
On BTC 4H the curve grinds down to −45% while buy & hold sits around +12%. Note the gross (0-fee) line barely differs — this isn’t a fee problem, there simply isn’t an edge to erode.
Gate 6 — The Signal-Scarcity Trap
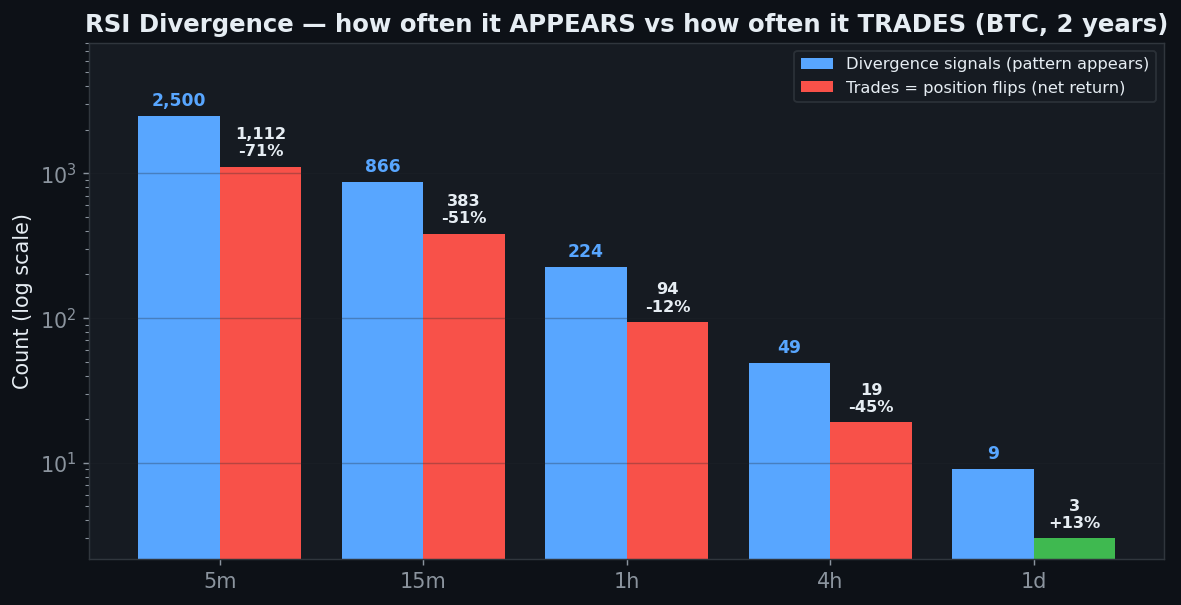
Here is the heart of the matter — and first, two numbers that are easy to conflate. The divergence pattern itself appears 49 times on the 4H (23 bullish, 26 bearish) and 9 times on the daily over two years. But this is stop-and-reverse: a signal flips you and you hold until the opposite signal fires, so repeated same-side divergences don’t add trades. That’s why the actual trade count is 19 on the 4H and 3 on the daily (blue = signals, red/green = trades, above). Either way the sample on the high timeframes is thin. The 4H shows the pattern 49 times and still loses 45%; push to faster charts for more signals and you get whipsawed (5m: 1,112 trades, −71%). And the one green result — the daily +12.6% — rests on 9 signals and just three trades. A profit factor of 34.9 on three trades is not an edge; it is a coin landing heads twice. There is no timeframe where divergence is both frequent enough to trust and profitable.
Gate 6b — Five Coins
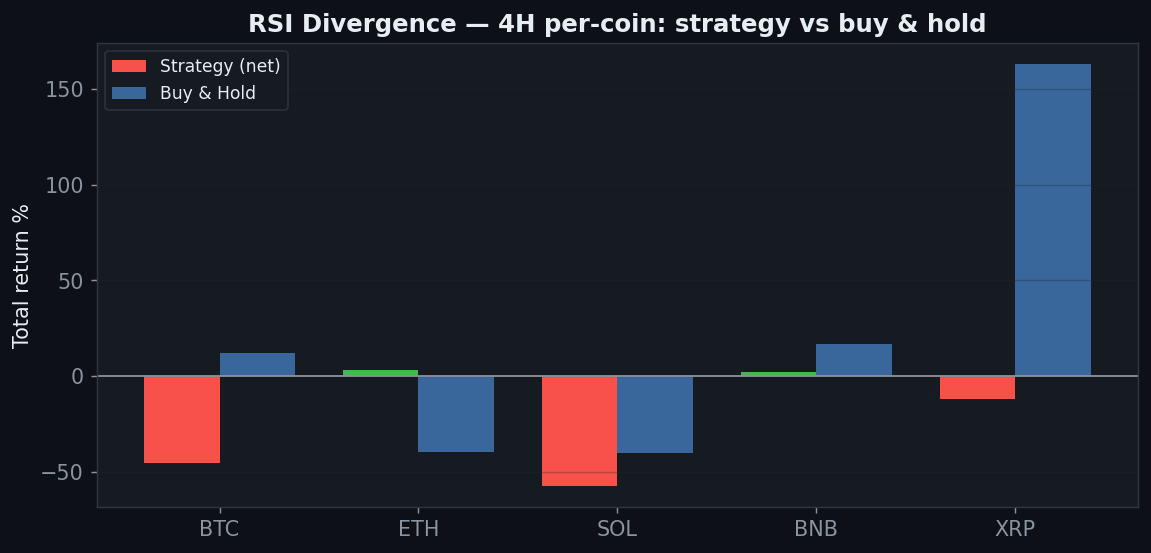
On 4H, two of five coins scrape a positive result — ETH +3.1% and BNB +2.2% — and three bleed, with SOL at −57%. “Two of five, by two percent” is what a strategy with no real edge looks like when you spin the wheel five times: some land green by luck. It does not beat buy & hold on any of them where holding was up.
Gate 2 — Friction & Robustness
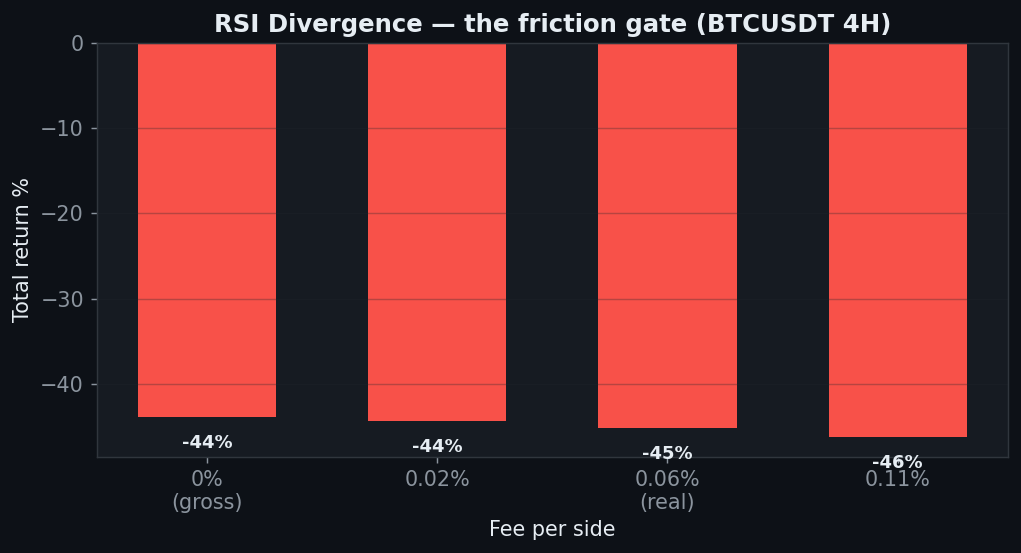
Because divergence trades so seldom on 4H, fees are not what kills it — it is already −44% at zero cost. The parameter sweep confirms there is nothing to rescue: 0 of 6 RSI-period × pivot-width combinations turn a profit. You cannot tune your way out of a signal that fires late and rarely.
The Verdict: REJECT
- Gate 0 — Indicator fidelity — pass (standard Wilder RSI(14), pivot-confirmed divergence)
- Gate 1 — Sanity — pass (pivot confirmed 5 bars later; entry on the confirmation close, no look-ahead)
- Gate 2 — Friction — fail (negative even at 0% fee on 4H, −45%; there is no gross edge to erode)
- Gate 3 — Yearly consistency — fail (no tradeable timeframe is consistently positive)
- Gate 4 — Out-of-sample — fail (2 of 5 coins positive out-of-sample)
- Gate 5 — Robustness — fail (0 of 6 RSI-period × pivot-width cells positive on 4H)
- Gate 6 — Multi-market — fail (2 of 5 coins on 4H, and only by +2–3%)
- Gate 7 — vs Buy & Hold — fail (the only green timeframe, the daily +12.6%, rests on 3 trades and merely ties holding)
Divergence is a description dressed up as a prediction. You cannot mark it until the second pivot confirms, and by then the reversal — if there is one — has already begun. Mechanised honestly, it fires too rarely to trust on the timeframes where it isn’t losing, and its single profitable result is three trades of noise. As a piece of context on a chart, divergence can be interesting. As a mechanical entry, it does not survive contact with the data.
FAQ
You entered too late — real traders anticipate the pivot.
Anticipating an unconfirmed pivot is guessing, and guessing can’t be backtested honestly. The moment you require confirmation — which is the only rule a computer can follow without peeking — you are late by construction. That lateness is the finding, not a flaw in the test.
What about hidden divergence / regular divergence only in trends?
Those are filters layered on top, and “add filters until the backtest looks good” is a different, easily over-fit exercise. We tested the signal that’s actually taught. If a filtered version has a real edge, it has to clear these same seven gates.
Can I replicate this?
Yes — RSI(14), 5-bar pivots, public Binance data, 0.06%/side, five coins, five timeframes.
See also: RSI 30/70, Stochastic, MACD crossover, and the conditional passes VWAP and Ichimoku (daily).
Disclaimer: educational research, not financial advice. Past performance does not guarantee future results. Never trade money you cannot afford to lose.
Leave a Reply