“My strategy wins 65% of its trades.” It’s the most seductive line in trading — and one of the most misleading. Williams %R, Larry Williams’ 1973 oscillator, is the perfect case study. Traded the standard way — buy when %R climbs out of oversold (−80), sell when it drops out of overbought (−20) — it posts a gorgeous win rate of 54–66% on every timeframe and every coin. It also loses money on every timeframe and every coin. We ran it through the 7-Gate Protocol across six axes. Verdict: reject — and it is the site’s cleanest lesson in why win rate lies.
Methodology
- Data: Binance spot, Jul 2024–Jul 2026 (2 years), BTC/ETH/SOL/BNB/XRP
- Timeframes: 5m–1D (9 buckets, incl. resampled)
- Execution: Williams %R(14) on the closed bar, no look-ahead; long on cross up through −80, short on cross down through −20
- Friction: 0.06%/side (real); 0-fee gross reported too. Benchmark: buy & hold
- Six axes: timeframe, period, TP:SL, multi-coin, yearly, out-of-sample
Gate 0 — Fidelity
Standard Williams %R(14): −100 × (highest high − close) / (highest high − lowest low) over 14 bars, scaled −100 to 0. Long when it crosses up through −80 (leaving oversold), short when it crosses down through −20 (leaving overbought). Reproduced exactly (pass).
The Exact Rules
- Signal: %R crosses above −80 → long; crosses below −20 → short (stop-and-reverse, hold in between)
- Default: period 14, thresholds −20 / −80
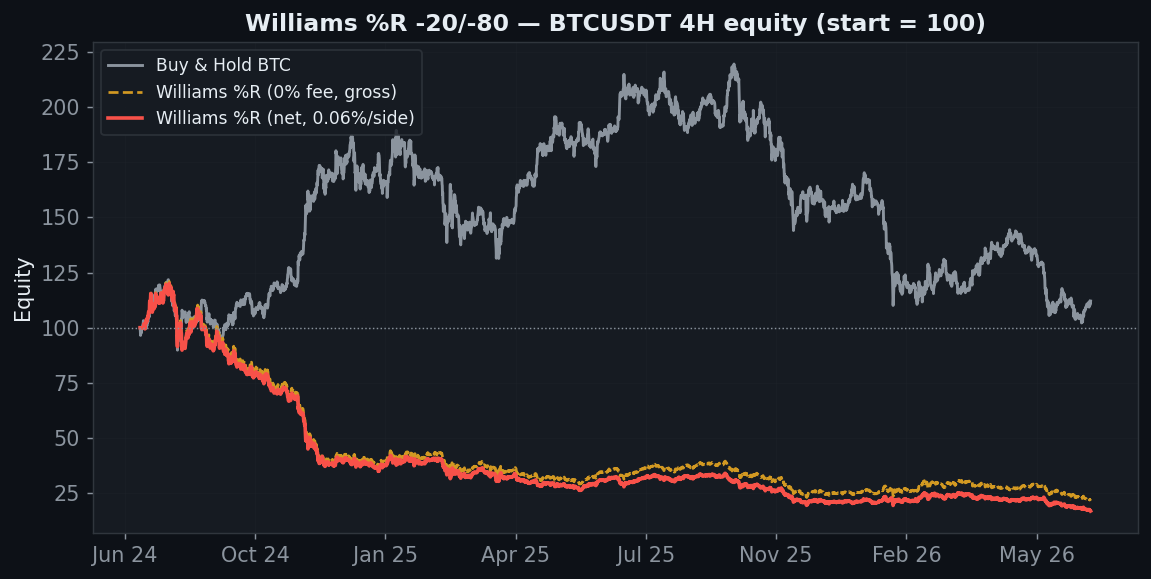
BTC 4H ends at −83%. And this time even the gross (0-fee) line is at −78% — there is no edge here at all, before or after costs. Yet the strategy won 55% of those losing trades. How?
The Win-Rate Illusion
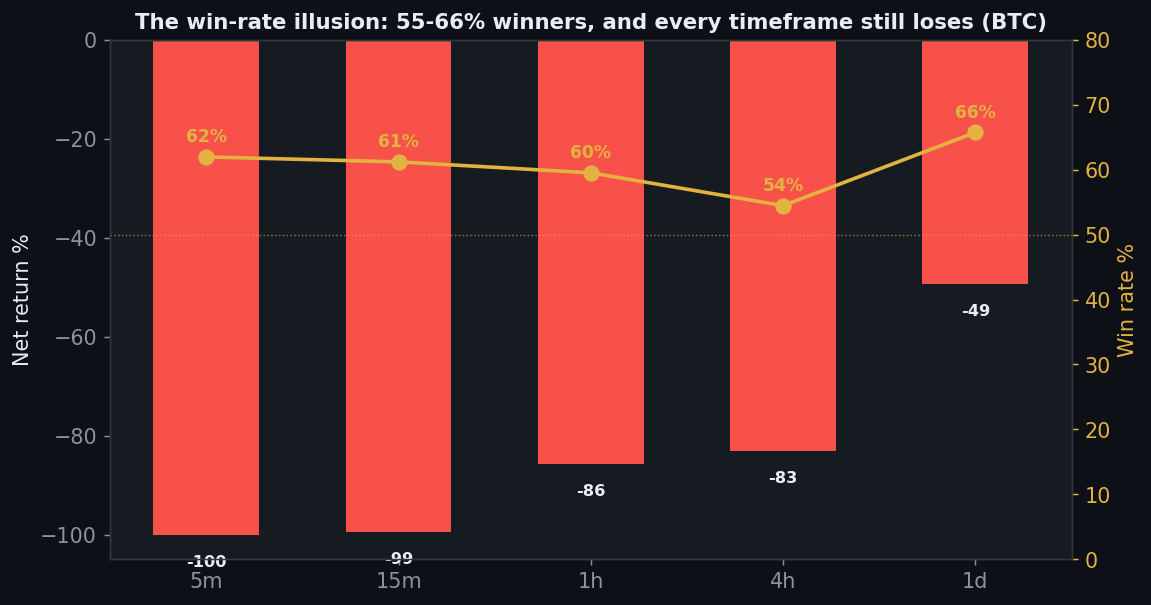
This one chart is the whole verdict. Across every timeframe the win rate sits at 55–66% (gold line) while the net return is deeply negative (red bars). The reason is what mean-reversion oscillators do: buying oversold and shorting overbought means fading the move. You clip a small profit most of the time as price wiggles back — a high win rate — but when the trend simply keeps going, you take one enormous loss that erases dozens of those small wins. Win rate counts how often you win; it says nothing about how much you win versus lose. Here the ratio is fatal.
Axis 1 — Timeframe (win rate, gross, net)
| Timeframe | Trades | Win rate | Gross | Net |
|---|---|---|---|---|
| 5m | 11,279 | 62% | +29% | −100% |
| 15m | 3,731 | 61% | −51% | −99% |
| 30m | 1,794 | 60% | −25% | −91% |
| 1h | 889 | 60% | −58% | −86% |
| 2h | 422 | 59% | −70% | −82% |
| 4h | 202 | 55% | −78% | −83% |
| 6h | 156 | 65% | −30% | −42% |
| 12h | 66 | 55% | −16% | −22% |
| 1D | 35 | 66% | −47% | −49% |
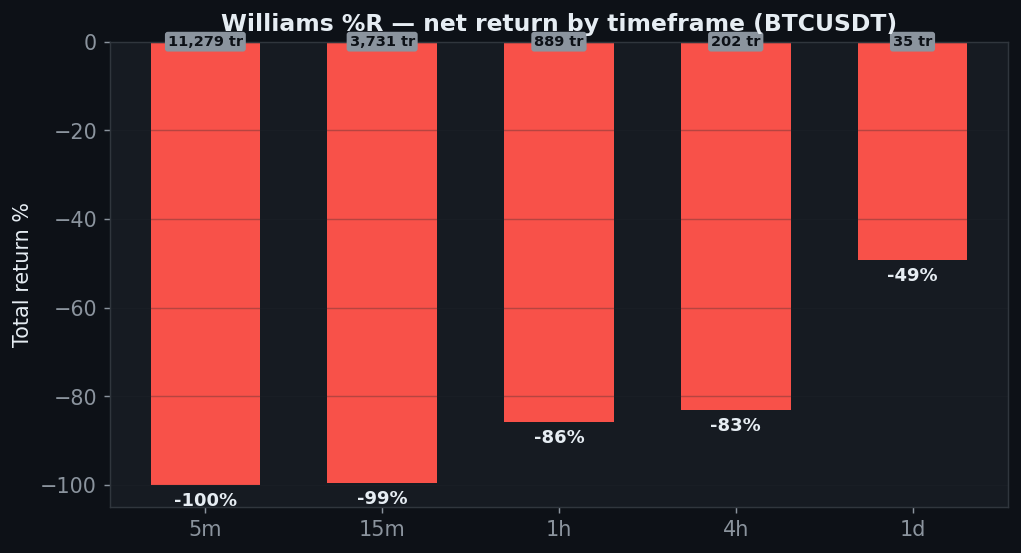
Read the win-rate column: 55–66% everywhere. Read the net column: negative everywhere. Nine timeframes, nine high-win-rate losers. The 5-minute wins 62% of 11,279 trades and still goes to −100%.
Axis 2 — Period (parameter)
| %R period | Trades | Win rate | Net | PF |
|---|---|---|---|---|
| 7 | 350 | 57% | −77% | 0.81 |
| 9 | 282 | 60% | −79% | 0.74 |
| 14 (default) | 202 | 55% | −83% | 0.63 |
| 21 | 158 | 60% | −62% | 0.84 |
| 28 | 124 | 65% | −36% | 0.98 |
| 35 | 92 | 61% | −40% | 0.94 |
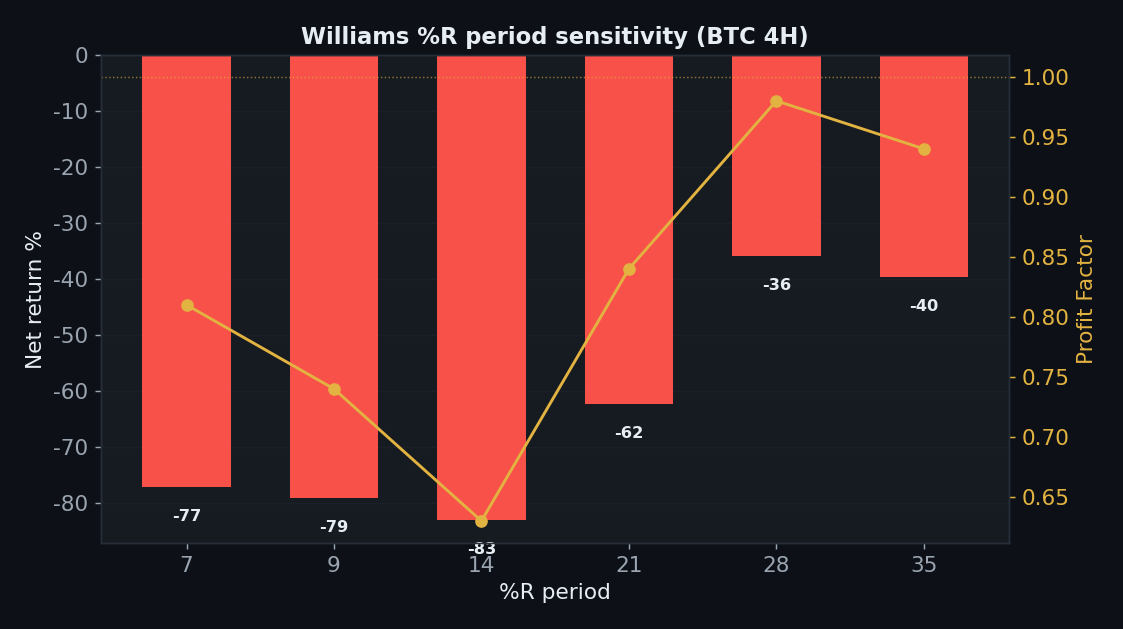
Every %R period loses (best case −36% at period 28), and the win rate stays 55–65% throughout. There is no length at which fading extremes becomes profitable on the majors.
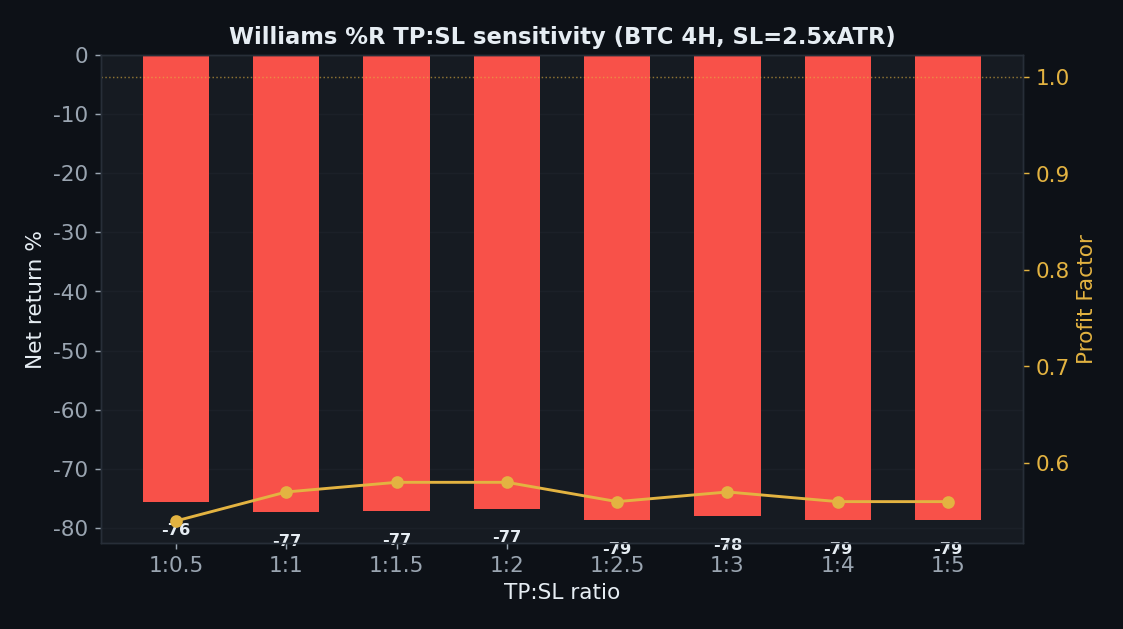
Axis 3 — TP:SL
| TP:SL | Net | PF |
|---|---|---|
| 1:0.5 | −76% | 0.54 |
| 1:1 | −77% | 0.57 |
| 1:1.5 | −77% | 0.58 |
| 1:2 | −77% | 0.58 |
| 1:2.5 | −79% | 0.56 |
| 1:3 | −78% | 0.57 |
| 1:4 | −79% | 0.56 |
| 1:5 | −79% | 0.56 |
This is the most damning sweep on the site: every single TP:SL ratio loses 75–79% with a profit factor of 0.54–0.58. You cannot fix a strategy whose losers dwarf its winners by moving the target — the problem is structural, not a tuning issue.
Axis 4 — Five Coins
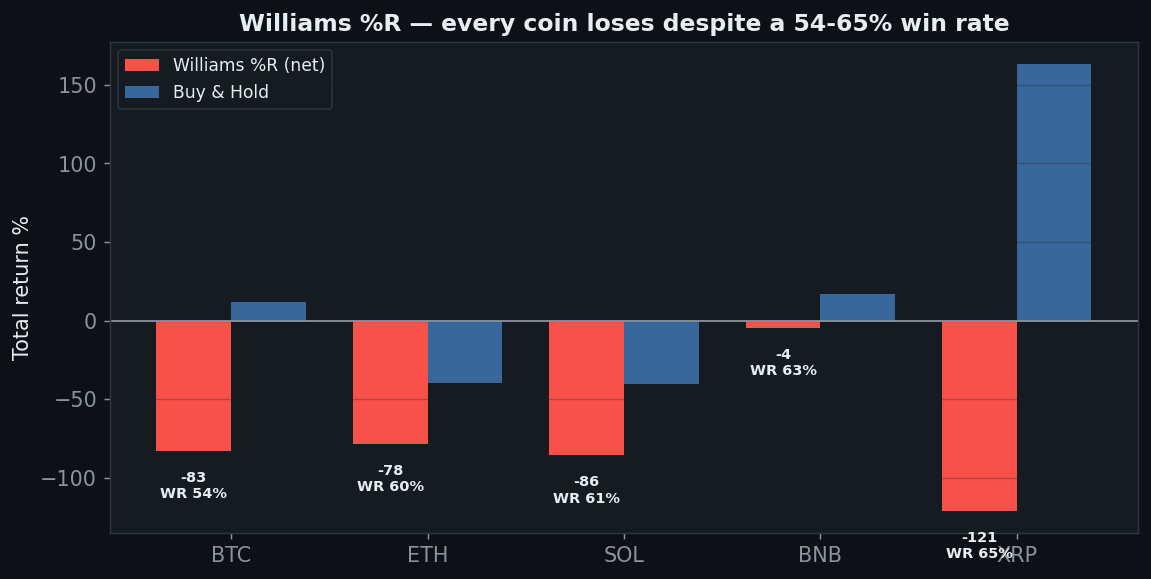
| Coin | Win rate | Williams %R net | Buy & Hold |
|---|---|---|---|
| BTC | 54% | −83% | +12% |
| ETH | 60% | −78% | −40% |
| SOL | 61% | −86% | −40% |
| BNB | 63% | −4% | +17% |
| XRP | 65% | −121% | +163% |
Zero of five coins are profitable — the worst multi-market result on the site. And look at XRP: a 65% win rate and a −121% return. You kept shorting XRP every time it looked “overbought” while it tripled; you were right 65% of the time and it destroyed the account. That single row is the entire argument against win rate as a metric.
Axis 5 — Yearly
| Year | BTC 4H net |
|---|---|
| 2024 | −62% |
| 2025 | −45% |
| 2026 (to Jul) | −20% |
All three years lose: −62%, −45%, −20%. Not one positive year — the only strategy on this site to fail that cleanly. Fading a trending, momentum-driven market is a structural loser regardless of the calendar.
Axis 6 — Friction & Out-of-Sample
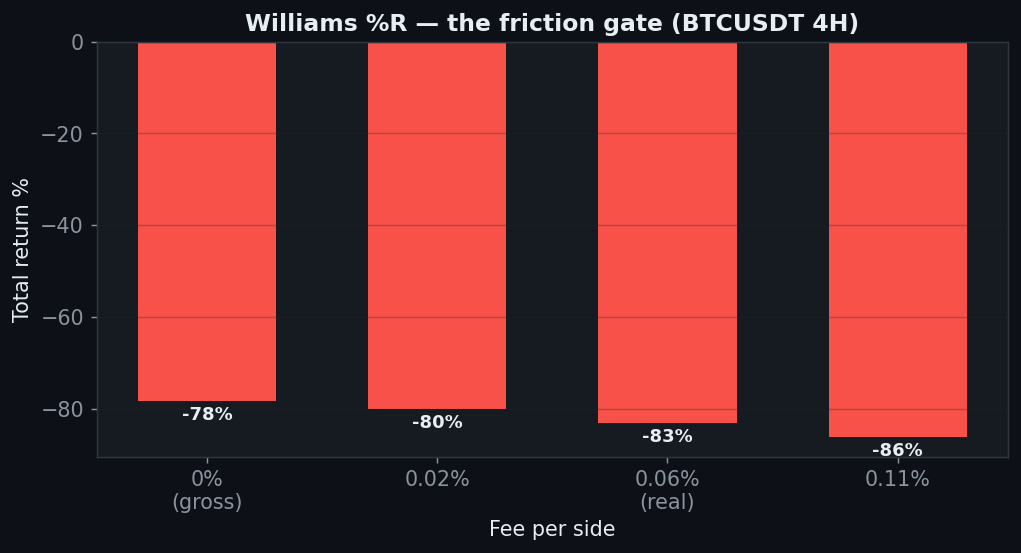
Friction barely matters when the gross is already −78%. Out-of-sample confirms it: 1 of 5 coins positive on unseen data. There is nothing to salvage.
The Verdict: REJECT
- Gate 0 — Indicator fidelity — pass (standard Williams %R(14), −20/−80)
- Gate 1 — Sanity — pass (signal on the closed bar, no look-ahead)
- Gate 2 — Friction — fail (−78% even at zero fees on 4H; 5m → −100%)
- Gate 3 — Yearly consistency — fail (all three years negative: −62 / −45 / −20)
- Gate 4 — Out-of-sample — fail (1 of 5 coins positive out-of-sample)
- Gate 5 — Robustness — fail (every period loses; every TP:SL loses at PF 0.54–0.58)
- Gate 6 — Multi-market — fail (0 of 5 coins positive — the worst on the site)
- Gate 7 — vs Buy & Hold — fail (0 of 5 timeframes, 0 of 5 coins)
A 62% win rate that lost everything. Williams %R traded as an overbought/oversold reversal fades the market: it wins small and often, then hands back everything (and more) when a trend refuses to reverse. Win rate measures frequency, not expectancy — and XRP’s 65%-win, −121% row is the clearest proof you’ll ever see that the two are not the same. It fails every axis: every timeframe, every period, every TP:SL, every coin, every year. As a mechanical reversal signal, Williams %R is a reject — and a permanent reminder to look at the profit factor, never the win rate.
FAQ
Shouldn’t you only take %R signals with the trend?
Adding a trend filter is a different strategy, and worth its own test — but the −20/−80 reversal is what’s taught as “the Williams %R strategy,” so that’s what we measured. A filtered version still has to beat these six gates.
But the win rate is genuinely high — doesn’t that count for something?
Only alongside the average win vs average loss. A 65% win rate with losers 3× the size of winners is a losing system, which is exactly what the profit factors (0.54–0.63) and the XRP row show.
Can I replicate this?
Yes — Williams %R(14), −20/−80 reversal, public Binance data, 0.06%/side, five coins, nine timeframes. Every table reproduces.
See also: Stochastic, RSI 30/70, CCI, Heikin Ashi, and the conditional passes VWAP and Ichimoku (daily).
Disclaimer: educational research, not financial advice. Past performance does not guarantee future results. Never trade money you cannot afford to lose.
Leave a Reply