Every trading YouTube channel eventually makes the same video: “Buy when RSI drops below 30, sell when it crosses 70.” It sounds logical. It looks great on cherry-picked charts. Some videos claim win rates of 80–90%.
So I did what almost nobody does: I coded the exact rules and ran them on 2 years of real Bitcoin data — with real trading fees included.
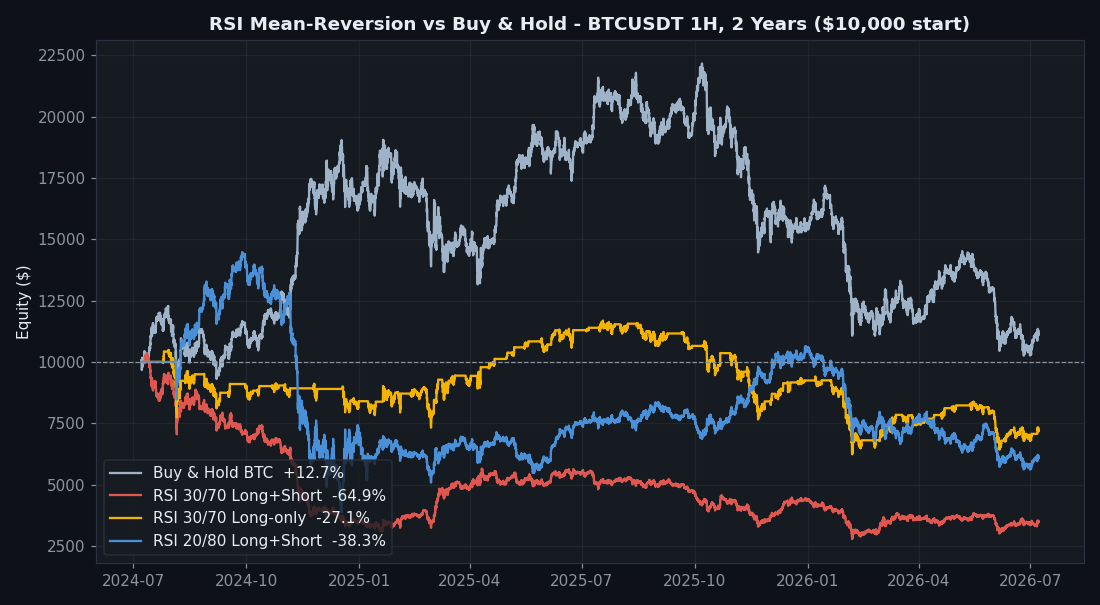
Spoiler: every variant lost money. One lost 65%. Here is the full breakdown, so you don’t have to pay for this lesson with your own account.
The Exact Rules I Tested
No vague “price action confirmation.” Rules a computer can execute:
- Indicator: RSI(14), Wilder’s smoothing, 1-hour candles
- Long entry: RSI crosses up through 30
- Long exit: RSI crosses up through 70
- Short entry (long+short variant): RSI crosses down through 70
- Short exit: RSI crosses down through 30
- Data: BTCUSDT, 17,500+ hourly candles (July 2024 – July 2026)
- Fees: 0.06% per side (typical crypto futures taker fee)
- Position size: 100% of equity per trade, starting from $10,000
The Results
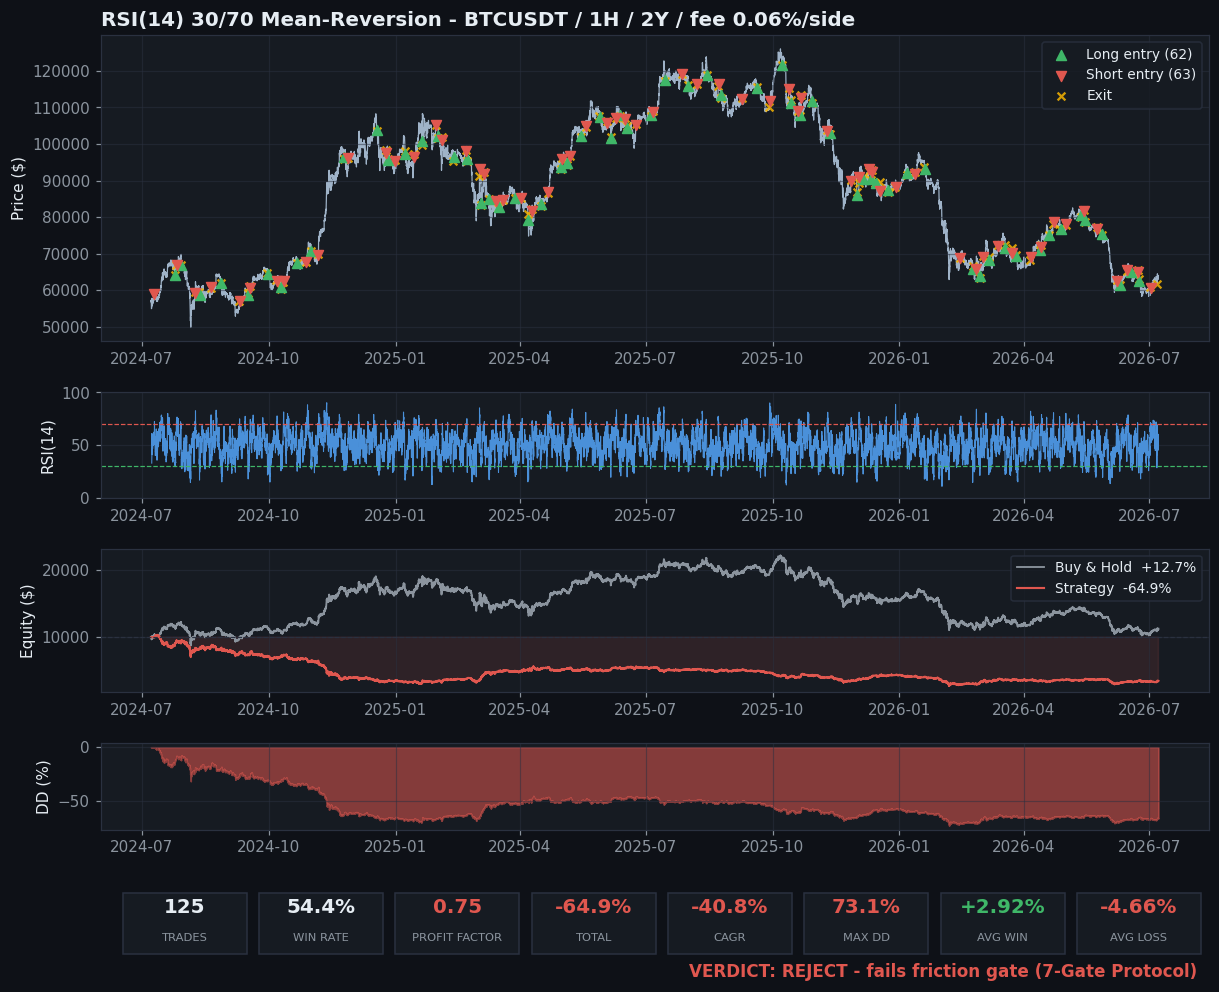
| Variant | Trades | Win rate | Profit factor | Total return | Max drawdown |
|---|---|---|---|---|---|
| RSI 30/70 long+short | 125 | 54.4% | 0.75 | −64.9% | 73.1% |
| RSI 30/70 long-only | 62 | 58.1% | 0.86 | −27.1% | 46.6% |
| RSI 20/80 long+short | 26 | 69.2% | 1.05 | −38.3% | 73.3% |
| Buy & Hold BTC | — | — | — | +12.7% | — |
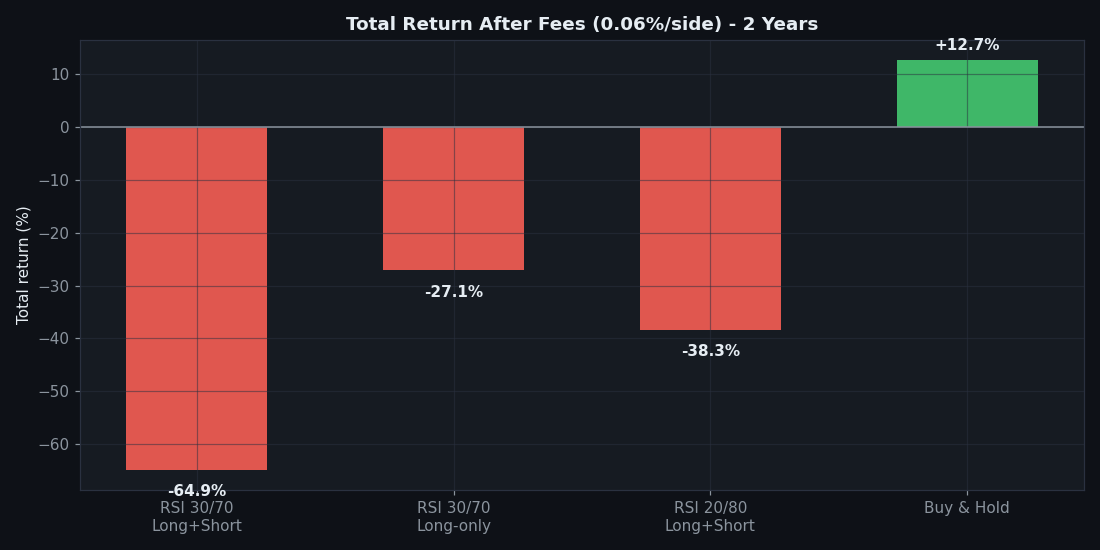
Read that table again. The strictest variant had a 69% win rate and still lost 38%. Meanwhile, doing absolutely nothing — just holding BTC — made +12.7%.
Why a 69% Win Rate Still Loses Money
This is the single most important lesson in this article.
RSI mean-reversion produces many small wins and a few catastrophic losses. When you buy an oversold dip in a real downtrend, RSI doesn’t politely bounce back. It stays oversold while price keeps falling — and the strategy has no stop loss. One bad trend wipes out twenty small wins.
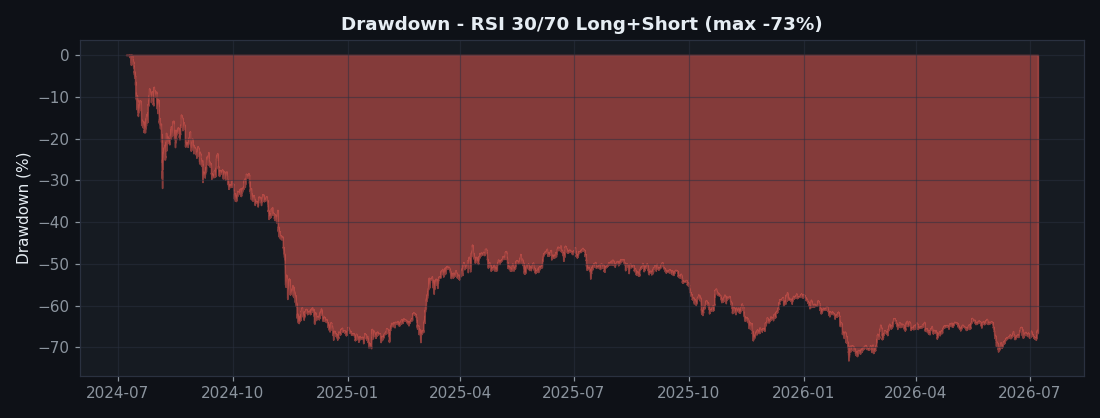
That’s what a 73% drawdown looks like. If you started with $10,000, at the worst point you had $2,700. Nobody keeps trading a system through that.
The math that YouTube never shows:
- Win rate is meaningless without payoff ratio. 69% wins × small size, 31% losses × huge size = net loss.
- Fees compound brutally. 125 round trips × 0.12% ≈ 15% of your account gone to fees alone.
- Buying dips fights the trend. In crypto, trends run further than RSI assumes.
“But It Worked in That YouTube Video…”
- Cherry-picked windows. Any strategy looks amazing during the right 3 months. I tested a full 2-year window.
- No fees or slippage. Add 0.06% per side and high-frequency signals collapse.
- Hindsight entries. In live trading you get every RSI<30 signal, including the twenty that came before the bottom.
Same Rules, Every Timeframe: 5m to 1D
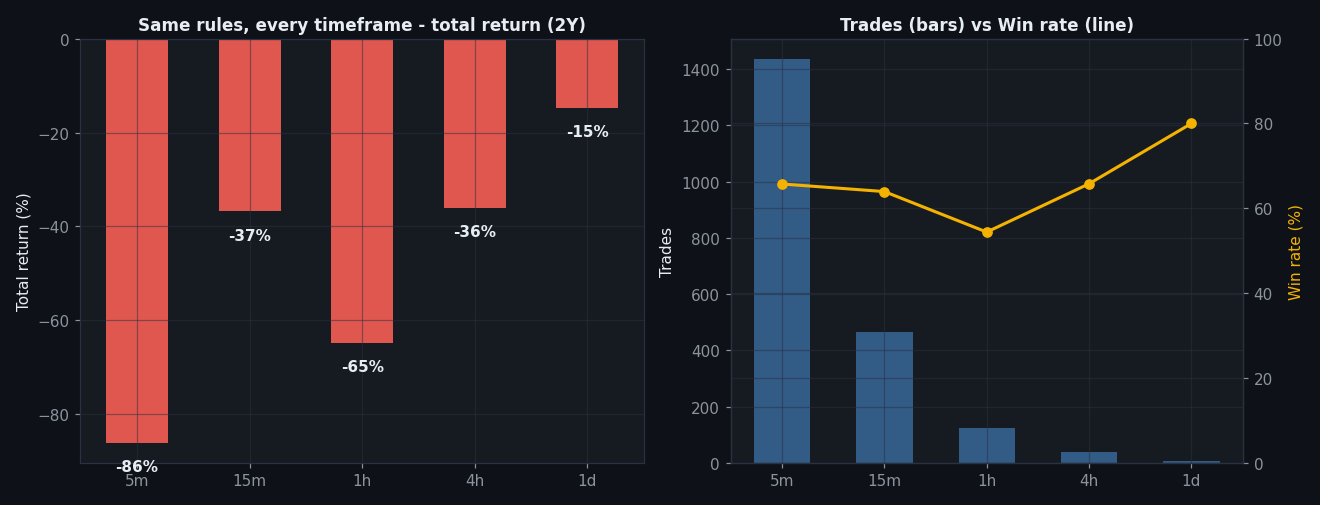
“Maybe it just needs a lower timeframe.” I hear that every time a strategy fails. So the engine re-ran the identical rules on five timeframes — over 240,000 candles in total. Nobody gets to say I didn’t look.
| Timeframe | Trades | Win rate | Profit factor | Total return | Max drawdown |
|---|---|---|---|---|---|
| 5m | 1,436 | 65.7% | 0.99 | −86.0% | 88.2% |
| 15m | 466 | 63.9% | 1.07 | −36.8% | 56.1% |
| 1h | 125 | 54.4% | 0.75 | −64.9% | 73.1% |
| 4h | 38 | 65.8% | 0.93 | −36.0% | 64.0% |
| 1d | 5 | 80.0% | 1.13 | −14.7% | 66.5% |
Two things this table screams:
- 5m is death by fees. A 65.7% win rate across 1,436 trades — and it still lost 86%. At 0.12% per round trip, the fees alone consumed more than the entire account. This is gate 02 in its purest form.
- 1D hit an 80% win rate and still lost money. Five trades, four winners — and the single loser erased them all. Win rate tells you nothing about the size of the loss that’s coming.
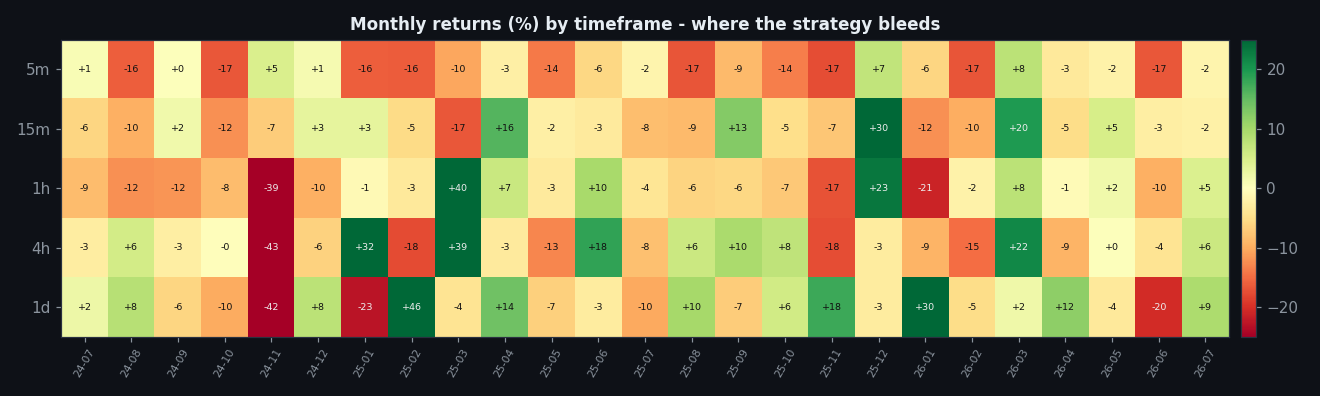
The monthly heatmap exposes the regime problem. In 2025 — an up-trending year — the 1h/4h/1d variants printed +22% to +39%. Then 2024 and 2026 took it all back:
| Timeframe | 2024 (H2) | 2025 | 2026 (H1) |
|---|---|---|---|
| 5m | −24.9% | −71.5% | −34.7% |
| 15m | −26.8% | −3.5% | −10.4% |
| 1h | −64.1% | +22.5% | −20.2% |
| 4h | −47.0% | +38.9% | −13.1% |
| 1d | −41.4% | +23.6% | +17.8% |
A strategy that only works in one market regime isn’t a strategy — it’s a bet on the regime. That’s a gate 03 failure (yearly consistency), stacked on top of the gate 02 failure.
Does a fixed take-profit save it? (TP : SL sweep)
Maybe the RSI-70 exit is the problem. We replaced it with a fixed stop (2×ATR) and a fixed target, and swept the reward-to-risk from 1:0.5 to 1:3 on BTC 1H.
| TP : SL | Trades | Win rate | Profit factor | Net return |
|---|---|---|---|---|
| 1 : 0.5 | 254 | 64.6% | 0.60 | −48% |
| 1 : 1 | 218 | 42.7% | 0.60 | −60% |
| 1 : 1.5 | 210 | 34.3% | 0.69 | −56% |
| 1 : 2 | 203 | 27.6% | 0.71 | −56% |
| 1 : 2.5 | 197 | 23.4% | 0.72 | −56% |
| 1 : 3 | 190 | 20.5% | 0.73 | −56% |
It changes nothing. Every ratio loses 48–60% with a profit factor stuck between 0.60 and 0.73. A tight target lifts the win rate to 65%, but the losers are twice the size; a wide target trims the win rate to 20%. There is no exit that rescues a losing entry — the oversold bounce simply is not there to harvest.
Does This Mean RSI Is Useless?
No — it means RSI as a standalone entry signal is useless on crypto. Tools like RSI or VWAP only stop bleeding money when they’re subordinated to a trend filter with a hard stop loss — and even then they rarely beat a simple trend-following system. (Read the full VWAP backtest here — it made it much further through the gates.)
The general rule: mean reversion without a stop loss is how accounts die slowly, then suddenly.
The 7-Gate Scorecard
- Gate 0 — Indicator fidelity — pass (standard Wilder RSI(14))
- Gate 1 — Sanity — pass (signal on the closed bar, no look-ahead)
- Gate 2 — Friction — fail (5-minute loses 86% on fees alone; negative on every timeframe)
- Gate 3 — Yearly consistency — fail (positive only during 2025’s bull; loses in every other stretch)
- Gate 4 — Out-of-sample — fail (2 of 5 coins positive out-of-sample)
- Gate 5 — Robustness — fail (every take-profit ratio from 1:0.5 to 1:3 loses)
- Gate 6 — Multi-market — fail (0 of 5 coins profitable on 4H; XRP −977% at an 83% win rate)
- Gate 7 — vs Buy & Hold — fail (long+short −65%, long-only −27% vs BTC +12.7%)
How I Validate Any Strategy (The 7-Gate Checklist)
- Code sanity — no lookahead bias, no repainting
- Friction — realistic fees and slippage included
- Yearly breakdown — profits every year, or one lucky year?
- Out-of-sample — does it survive data it wasn’t tuned on?
- Robustness — small parameter changes shouldn’t destroy it
- Multi-market — one coin’s fluke, or a general edge?
- Beats Buy & Hold — otherwise, why bother?
The RSI 30/70 strategy fails gate 2 and never recovers. Most YouTube strategies die at the same gate.
FAQ
What RSI settings did you use?
RSI(14), Wilder’s smoothing, 1H candles — the default in TradingView.
Would a stop loss fix it?
It reduces catastrophic losses but doesn’t create an edge. The entry itself is the problem.
What data and code did you use?
Public Binance OHLCV data and a Python backtester. The rules above are complete — you can replicate every number.
Disclaimer: This is educational research, not financial advice. Past performance does not guarantee future results. Never trade money you cannot afford to lose.
Leave a Reply