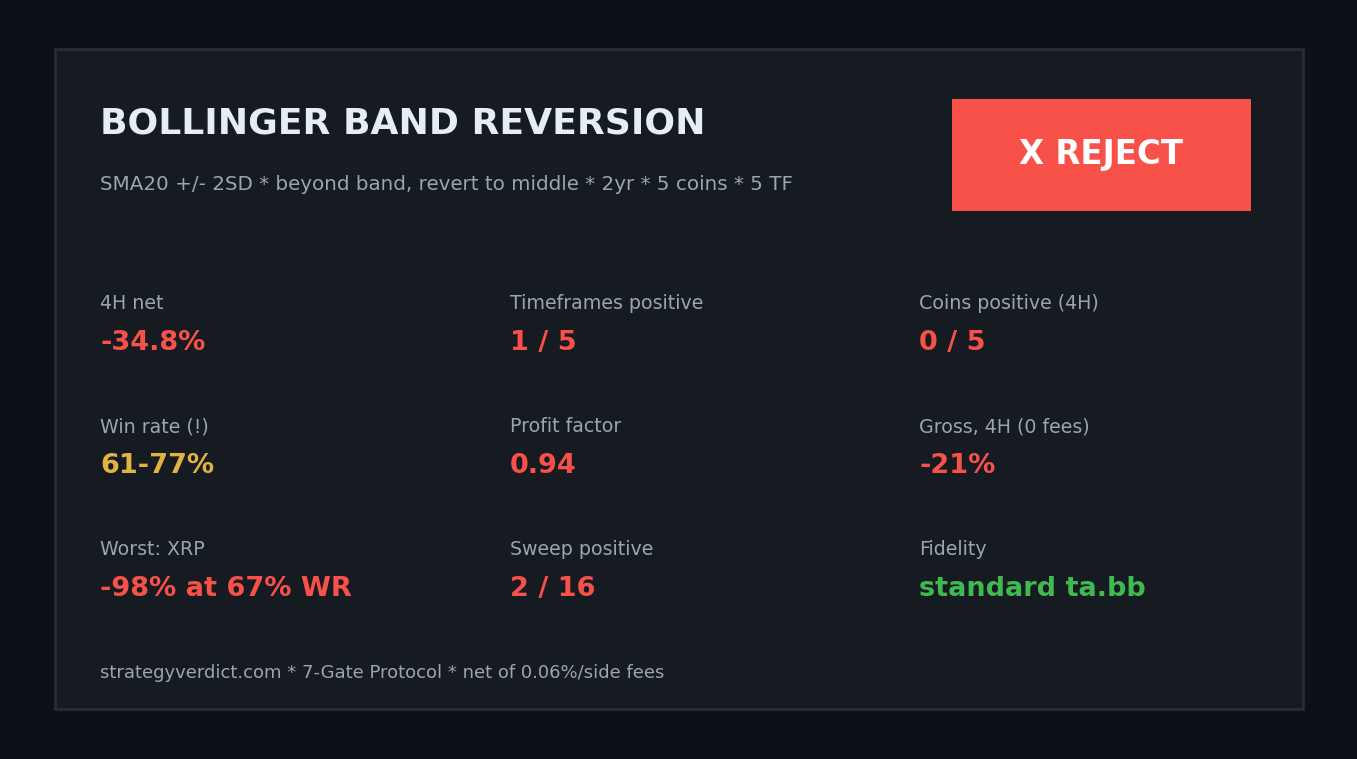
Bollinger Bands are the first indicator almost everyone learns, and the pitch is irresistibly simple: price is “cheap” at the lower band and “expensive” at the upper band, and it always snaps back to the mean. So you buy the lower band, sell the upper band, and collect. It even feels right — the win rate is high, the little green wins pile up. We ran the classic band-reversion through the full 7-Gate Protocol on 2 years, 5 coins and 5 timeframes. It is a reject, and it’s a perfect case study in why win rate is the most dangerous number in trading.
Gate 00 — Fidelity (the easy one)
No machine learning here. A Bollinger Band is a 20-period simple moving average plus/minus two population standard deviations — identical to TradingView’s ta.bb. There is nothing to reimplement incorrectly. The interesting question isn’t whether the bands are right; it’s whether reverting to them makes money.
The Exact Rules
- Bands: SMA(20) ± 2× standard deviation (the universal default)
- Entry: go long when the close is below the lower band; go short when the close is above the upper band
- Exit: close the position when price reverts to the middle band (the SMA)
- Execution: signal on the bar close, enter at that close; costs 0.06%/side; data Binance spot Jul 2024–Jul 2026, BTC/ETH/SOL/BNB/XRP, 5m–1D; benchmark buy & hold
The win-rate trap
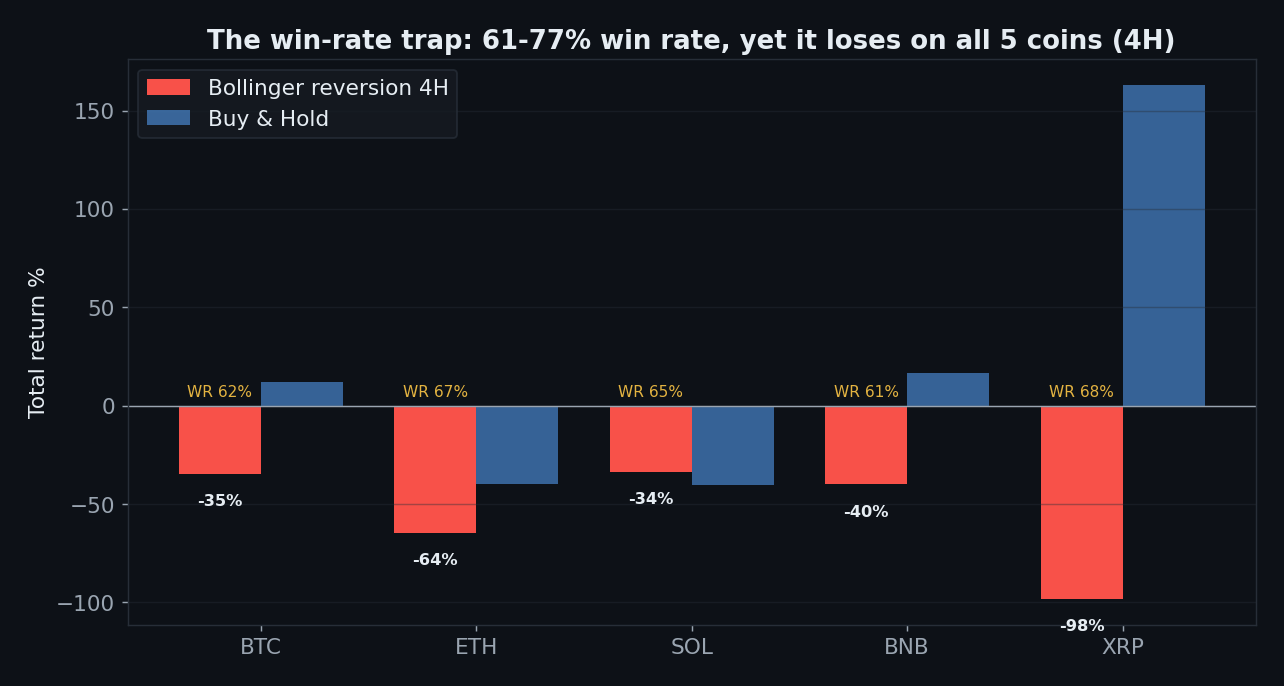
Look at the win rates: 61% to 77% across all five coins. Textbook “high probability.” And yet it loses money on all five. The worst is XRP: a 67.5% win rate and a −98% return — nearly a wipeout. This is the whole lesson of mean reversion: you win often and small (price nudges back to the mean), then lose rarely and enormously (a trend runs and never reverts). A high win rate tells you how often you win, not how much — and here the maths is upside down.
Why it bleeds: it fights every trend
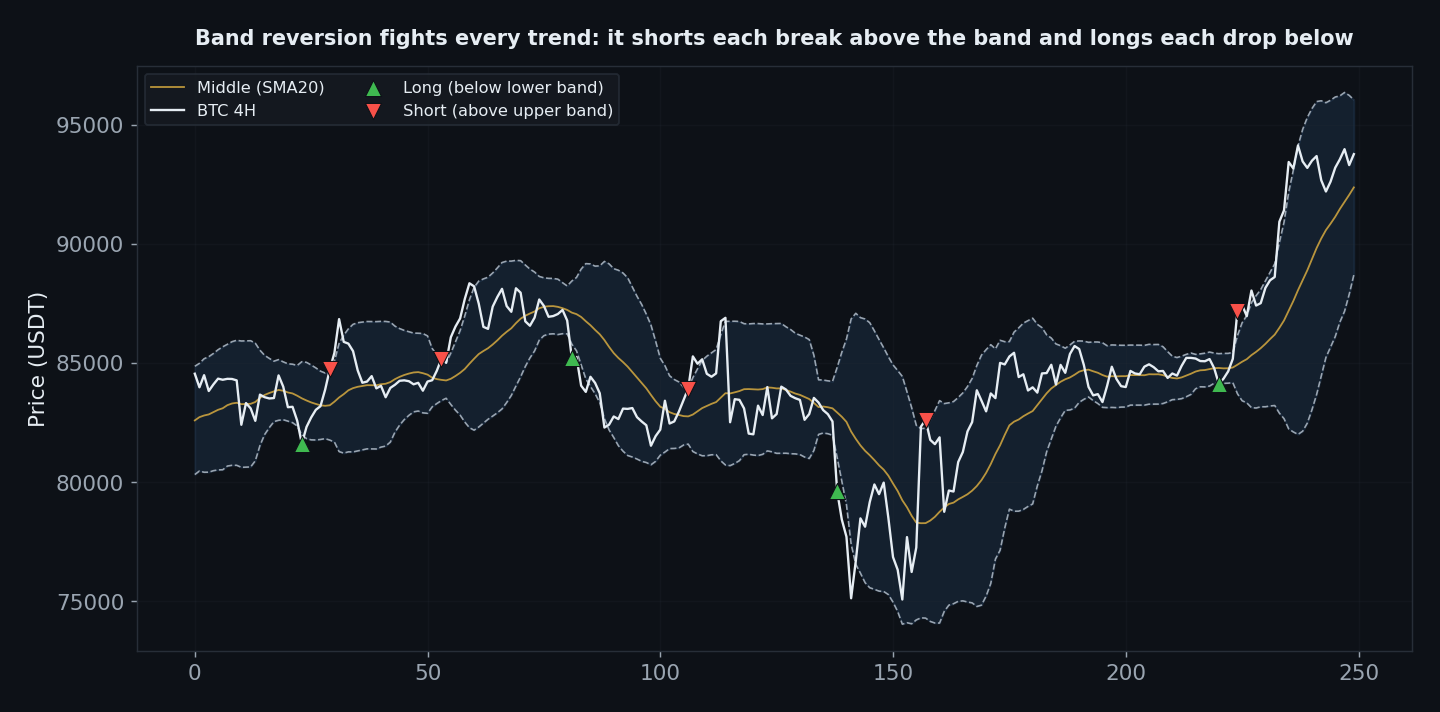
By construction, band-reversion does the exact opposite of trend-following. Every time price breaks above the upper band — the start of many real rallies — it goes short. Every time price craters below the lower band — the middle of many real crashes — it goes long, catching the falling knife. In a ranging market that’s fine. Crypto over 2024–26 was anything but ranging, and the strategy spent two years standing in front of freight trains.
Gate 06a — Every Timeframe
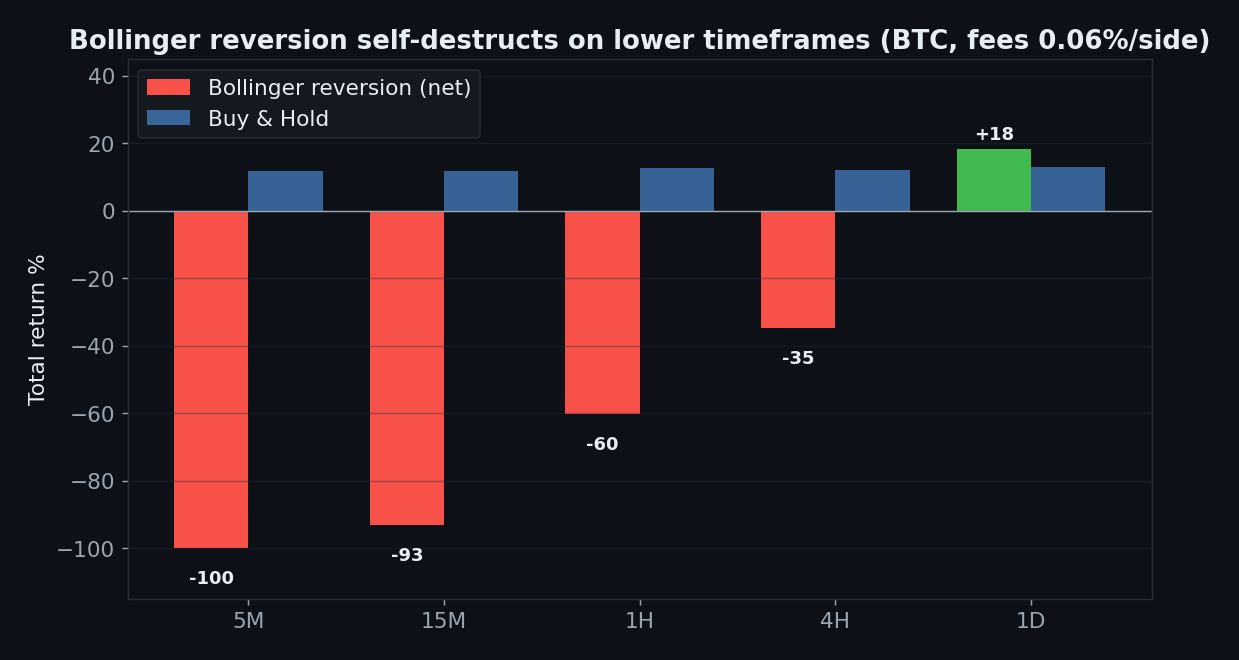
On the timeframes the “scalping” clips love, it detonates: 5-minute bars → −100% (7,600 trades, account gone), 15m → −93%, 1h → −60%, 4h → −35%. Only the daily squeaks out +18% (30 trades, one symbol) — the familiar pattern where a strategy only survives where it barely trades.
Gate 02 — Friction
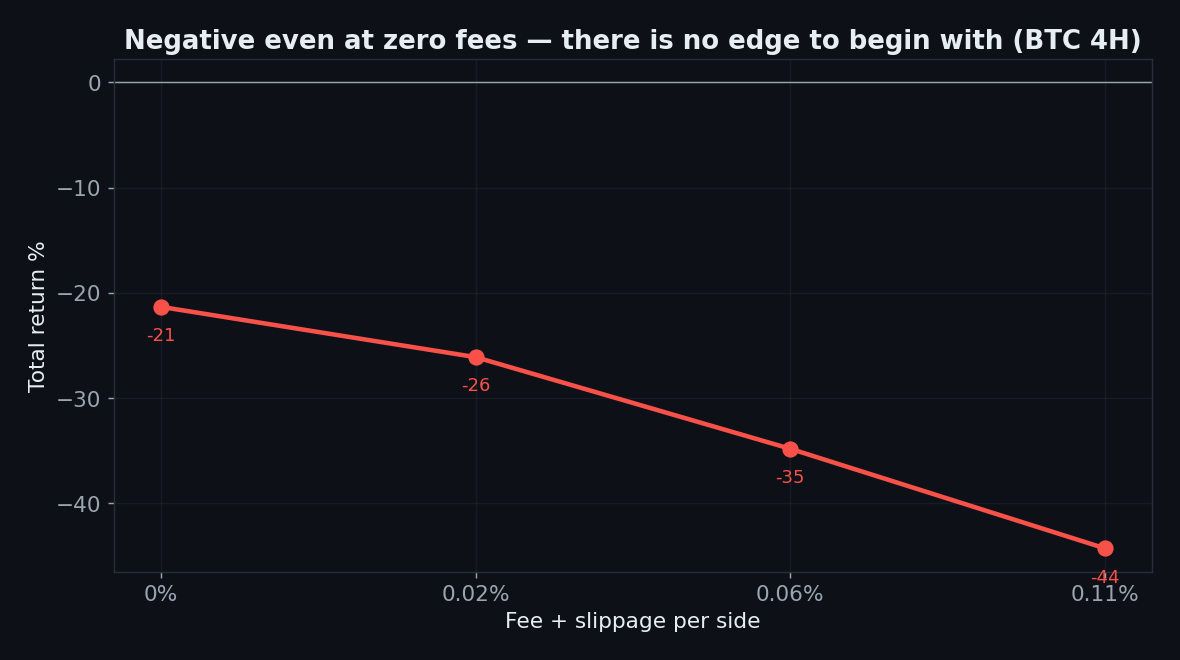
Here’s the tell that separates this from a merely fee-sensitive strategy: on BTC 4H it is negative even with zero fees (−21%). There is no gross edge for costs to erode — the reversion premise itself is a loser in a trending asset. Fees just deepen the hole.
Gate 05 — Parameter Robustness
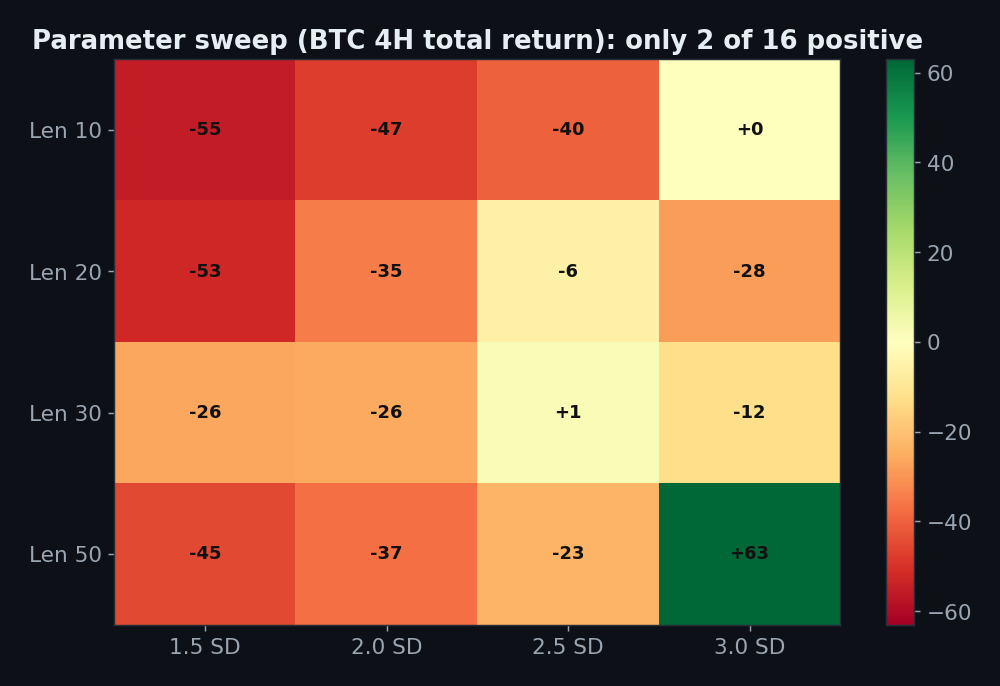
Maybe a different length or band width rescues it? We swept SMA length (10–50) against band width (1.5–3.0 SD): 2 of 16 combinations positive. There is no robust setting — only a couple of lucky cells.
Gate 04 — Out-of-Sample
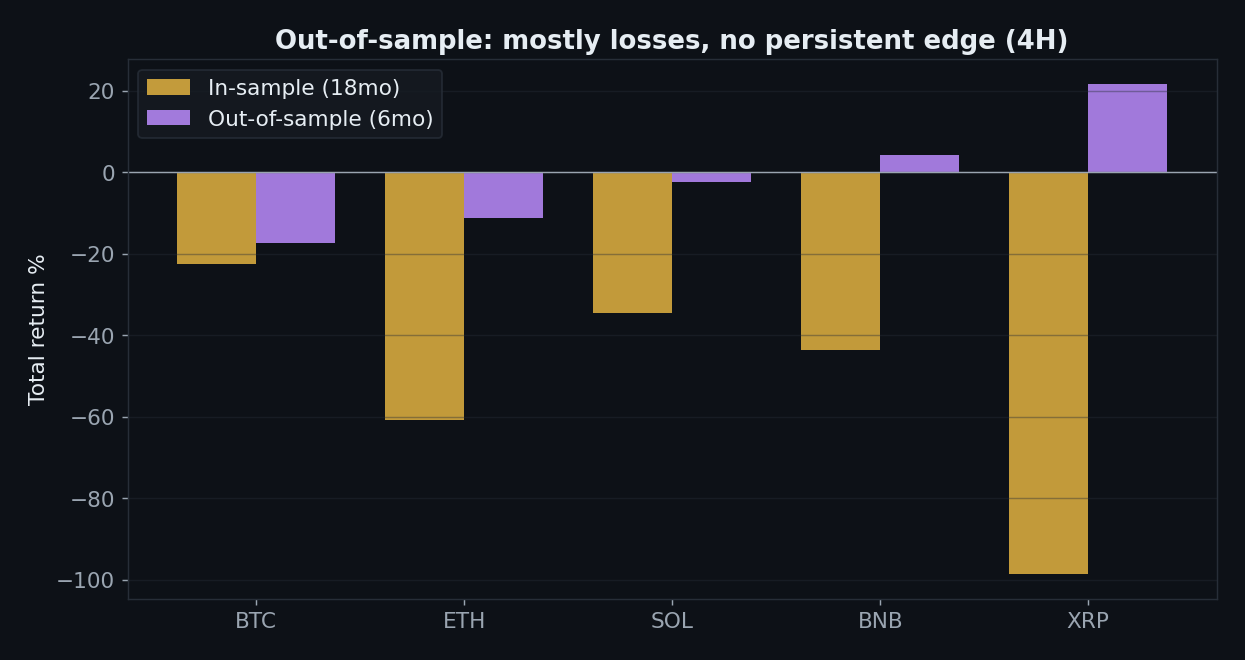
Split 18 months in / 6 months out: mostly losses, only 2 of 5 coins positive out-of-sample, profit factors flipping across the boundary. Nothing stable to carry forward.
The Verdict: REJECT
- Gate 0 — Indicator fidelity — pass (standard SMA(20) ± 2 standard deviations, identical to TradingView’s ta.bb)
- Gate 1 — Sanity — pass (signal on the closed bar, no look-ahead)
- Gate 2 — Friction — fail (negative even at zero fees on 4H — there is no gross edge to erode)
- Gate 3 — Yearly consistency — fail (unstable; it only survives in ranging stretches, not trending years)
- Gate 4 — Out-of-sample — fail (2/5 positive out-of-sample)
- Gate 5 — Robustness — fail (only 2 of 16 length × band-width cells positive)
- Gate 6 — Multi-market — fail (loses money on all 5 coins; XRP −98% at a 67% win rate)
- Gate 7 — vs Buy & Hold — fail (a 61–77% win rate and still behind simply holding)
“Buy the lower band, sell the upper band” has a 60–77% win rate and loses money on every coin we tested. The high win rate is exactly the trap: it hides the rare, ruinous losses that happen when a trend refuses to revert. Mean reversion is not wrong as a concept — but naked band-reversion, with no regime filter, in a trending market, is a slow-motion blow-up. XRP: 67% winners, −98% equity.
FAQ
Doesn’t it work with an ADX / regime filter?
Possibly — mean reversion is meant for ranging markets, and an ADX gate to sit out trends is the standard fix. But that is a different, more complex strategy, and choosing the filter after seeing the results is curve-fitting. The point of this test is the version that’s actually taught to beginners: bands only.
How can a 77% win rate lose money?
Because average win << average loss. You bank many tiny reversions and occasionally hold a losing position all the way through a trend. Win rate without payoff ratio is meaningless.
Can I replicate this?
Yes — SMA(20) ± 2SD, public Binance data, 0.06%/side. Every number falls out of those inputs.
See also: RSI 30/70 (the other high-win-rate mean-reversion trap), Lorentzian Classification, UT Bot, and VWAP pullback (our one conditional pass).
Disclaimer: educational research, not financial advice. Past performance does not guarantee future results. Never trade money you cannot afford to lose.
Leave a Reply