Open any “trade like a pro” video and you’ll meet Heikin Ashi — the modified candles that look magically smooth, painting long runs of clean green in an uptrend and clean red in a down. The pitch writes itself: the smoothing “filters out the noise” so you can hold the trend and ignore the chop. The simplest rule taught is the colour flip: go long when the Heikin Ashi candle turns green, short when it turns red. So do those beautiful smooth candles actually make money? We ran the colour flip through the 7-Gate Protocol across six axes. Verdict: reject — and the reason is hiding in plain sight, inside the very smoothness people love.
Methodology
- Data: Binance spot, Jul 2024–Jul 2026 (2 years), BTC/ETH/SOL/BNB/XRP
- Timeframes: 5m–1D (9 buckets, incl. resampled)
- Execution: Heikin Ashi from standard OHLC; colour read on the closed bar, no look-ahead
- Friction: 0.06%/side (real); 0-fee gross reported too. Benchmark: buy & hold
- Six axes: timeframe, smoothing, TP:SL, multi-coin, yearly, out-of-sample
Gate 0 — Fidelity
Standard Heikin Ashi: HA close = (O+H+L+C)/4; HA open = (prior HA open + prior HA close)/2; the candle is green when HA close ≥ HA open. Long on green, short on red. Reproduced exactly (pass).
The Exact Rules
- Signal: HA candle turns green → long; turns red → short (stop-and-reverse)
- Default: raw Heikin Ashi, no extra smoothing
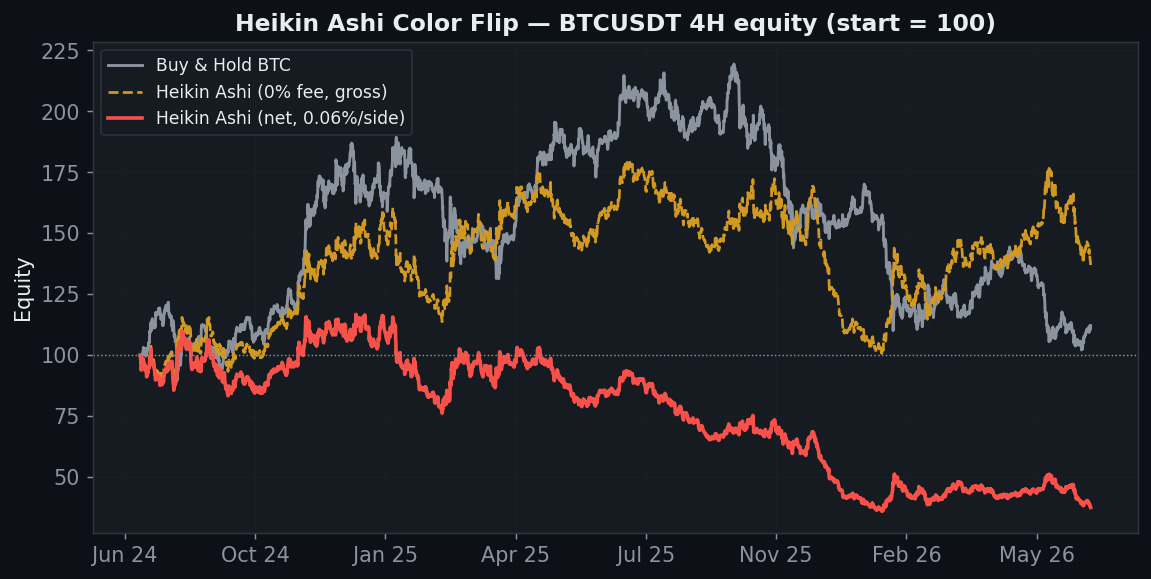
BTC 4H ends at −63% versus buy & hold’s +12%. But notice something unusual: the gross (0-fee) line finishes at +37%. Unlike most rejects on this site, Heikin Ashi does have a real gross edge — the smoothing genuinely captures some direction. So why does it lose 63% net? One word.
Why It Bleeds: the Smooth-Candle Illusion
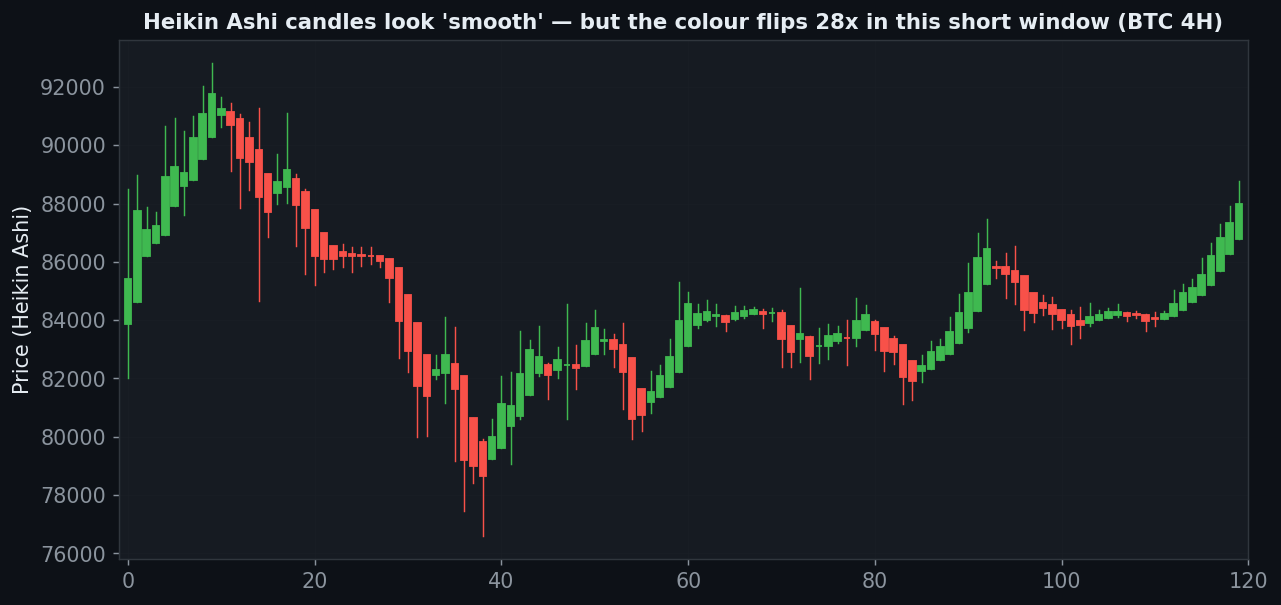
These are real Heikin Ashi candles. They look smooth — long clean runs of one colour — which is exactly what makes traders feel confident. But count the colour changes: in this short 120-bar window the candle flips colour 28 times. Zoom out and the raw colour-flip trades 1,079 times on 4H and 51,928 times on the 5-minute. The smoothing that makes the chart look calm is a visual sedative; underneath, the signal whipsaws relentlessly. A +37% gross edge spread across 1,079 round-trips cannot survive 0.06% a side.
Axis 1 — Timeframe (gross vs net)
| Timeframe | Trades | Gross (0 fee) | Net (real) |
|---|---|---|---|
| 5m | 51,928 | −89% | −100% |
| 15m | 17,484 | −60% | −100% |
| 30m | 8,796 | +5% | −100% |
| 1h | 4,454 | −63% | −100% |
| 2h | 2,176 | −30% | −95% |
| 4h | 1,079 | +37% | −63% |
| 6h | 685 | −5% | −58% |
| 12h | 330 | +31% | −12% |
| 1D | 180 | −7% | −25% |
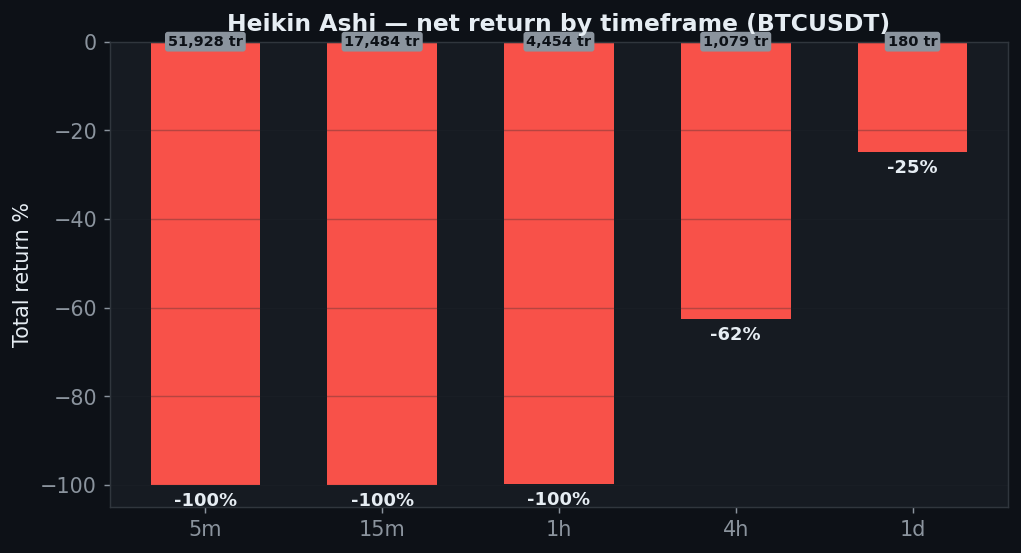
Zero net-positive timeframes. Several buckets are gross-positive (4h +37%, 12h +31%, 30m +5%) — the edge is real — but the trade counts (51,928 on 5m) mean fees bury every one. The 12H is the least-bad at −12%; the daily is −25%.
Axis 2 — Smoothing (the popular “fix”)
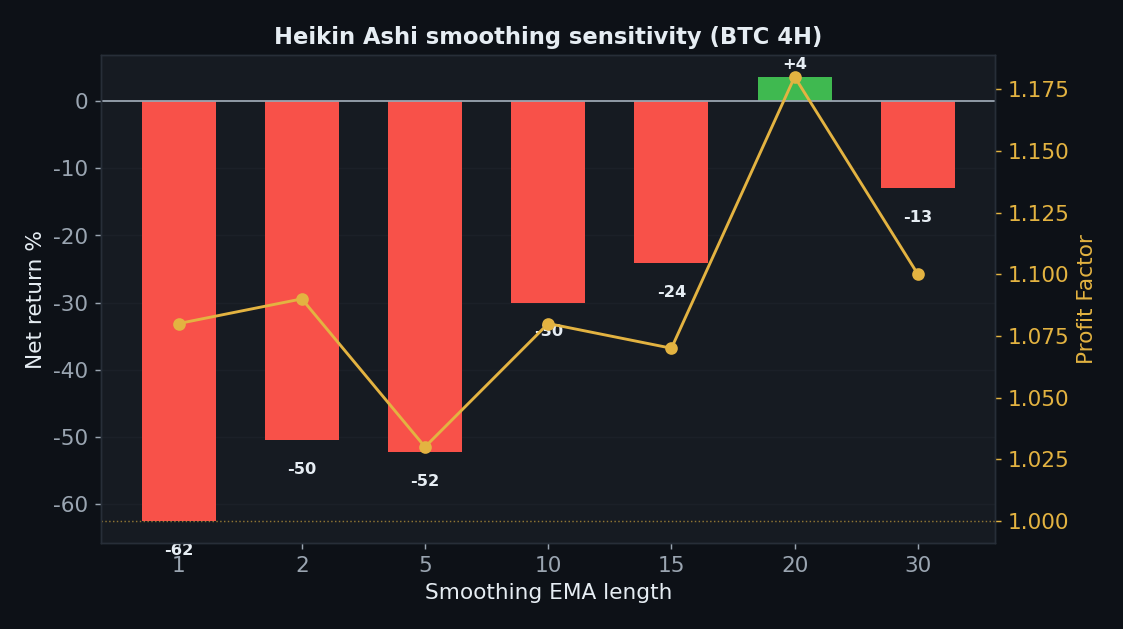
Retail knows the raw flip is choppy, so the favourite variant is “Smoothed Heikin Ashi” — EMA the price before building the candles. Does more smoothing help? We swept the EMA length on BTC 4H.
| Smoothing (EMA) | Trades | Net | PF |
|---|---|---|---|
| 1 (raw HA) | 1,079 | −63% | 1.08 |
| 2 | 853 | −51% | 1.09 |
| 5 | 563 | −52% | 1.03 |
| 10 | 388 | −30% | 1.08 |
| 15 | 324 | −24% | 1.07 |
| 20 | 278 | +4% | 1.18 |
| 30 | 236 | −13% | 1.10 |
Smoothing does exactly what you’d expect: it cuts the trade count (1,079 → 236) and steadily reduces the loss. At EMA-20 it finally scrapes +4% — but that’s it. The “fix” turns a 63% loss into a rounding error, not a strategy, and even that razor-thin result is one coin, one timeframe, and (as the yearly table shows) would have been destroyed in 2025. The raw colour flip that most people actually trade loses badly at every setting.
Axis 3 — TP:SL
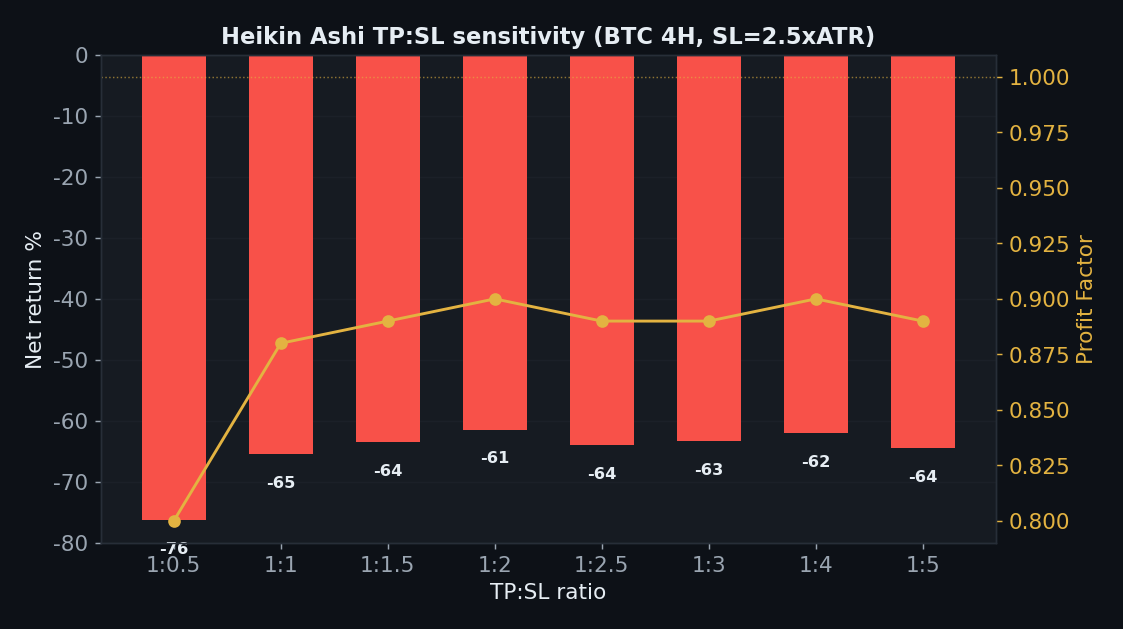
| TP:SL | Net | PF |
|---|---|---|
| 1:0.5 | −76% | 0.80 |
| 1:1 | −65% | 0.88 |
| 1:1.5 | −64% | 0.89 |
| 1:2 | −61% | 0.90 |
| 1:2.5 | −64% | 0.89 |
| 1:3 | −63% | 0.89 |
| 1:4 | −62% | 0.90 |
| 1:5 | −65% | 0.89 |
No take-profit setting rescues it — every ratio from 1:0.5 to 1:5 loses 61–76%. A 34% win rate that flips a thousand times can’t be saved by where you place the target.
Axis 4 — Five Coins
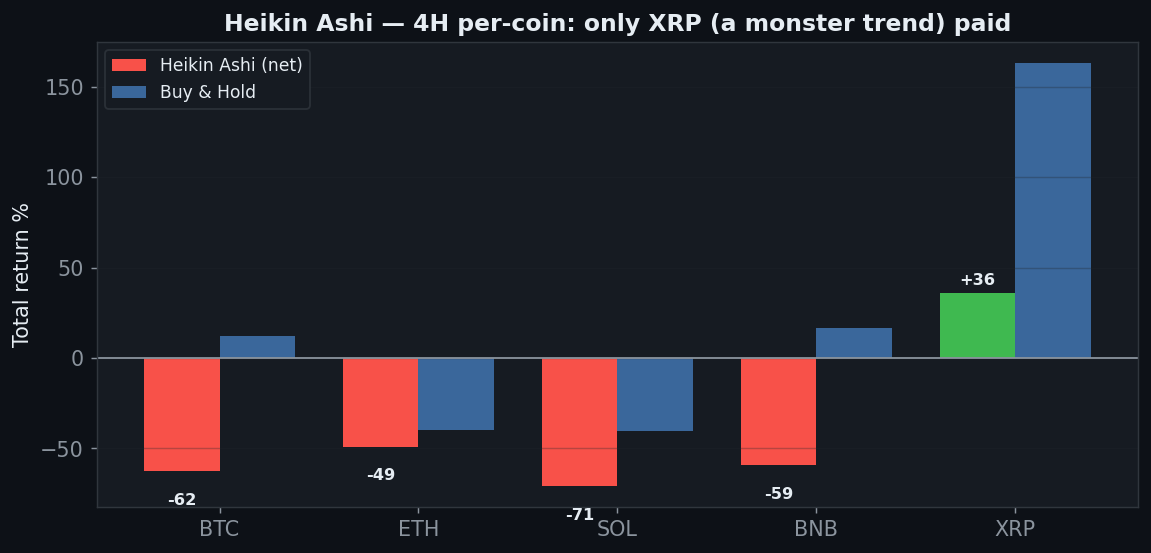
| Coin | HA net | Buy & Hold | Excess |
|---|---|---|---|
| BTC | −63% | +12% | −75pp |
| ETH | −49% | −40% | −9pp |
| SOL | −71% | −40% | −31pp |
| BNB | −59% | +17% | −76pp |
| XRP | +36% | +163% | −127pp |
Only XRP (1 of 5) is net-positive, and even it (+36%) badly trails its own buy & hold (+163%). BTC −63%, SOL −71%. The one green coin is, again, the biggest trender — trend-luck, not edge.
Axis 5 — Yearly
| Year | BTC 4H net |
|---|---|
| 2024 | +5% |
| 2025 | −60% |
| 2026 (to Jul) | −10% |
Only 2024 is (barely) positive; 2025’s −60% is catastrophic and 2026 is also red. Two of three years lose. A smoothed, lagging colour flip in a choppy, mean-reverting market is a fee-paying machine.
Axis 6 — Friction & Out-of-Sample
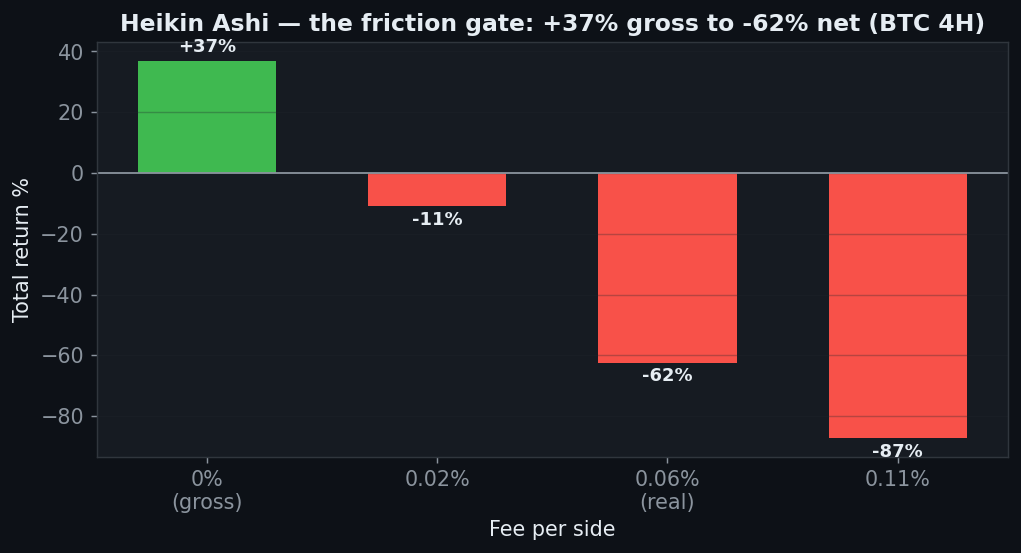
The friction gate is the whole story: +37% at zero fees → −11% at 0.02% → −62% at 0.06% → −87% at 0.11%. This is the second-most fee-sensitive strategy on the site, behind only the Stochastic crossover — the same over-trading disease. Out-of-sample, 3 of 5 coins are positive over the final six months, but the full sample is a 63% wipeout; that green patch is a window artifact, not evidence of edge.
The Verdict: REJECT
- Gate 0 — Indicator fidelity — pass (standard Heikin Ashi construction)
- Gate 1 — Sanity — pass (colour read on the closed bar, no look-ahead)
- Gate 2 — Friction — fail (+37% gross → −62% net on 4H; 5m → −100% over 51,928 trades)
- Gate 3 — Yearly consistency — fail (2024 +5 / 2025 −60 / 2026 −10 — two of three years lose)
- Gate 4 — Out-of-sample — fail (3/5 over 6 months, but the full sample is a 63% wipeout)
- Gate 5 — Robustness — fail (raw flip loses at every setting; smoothing to EMA-20 scrapes +4%, marginal and single-coin)
- Gate 6 — Multi-market — fail (1 of 5 coins; only XRP, a monster trender)
- Gate 7 — vs Buy & Hold — fail (0 of 5 timeframes beat holding)
Heikin Ashi’s smoothness is a feeling, not an edge. The candles look calm and trend-like, which is precisely why traders trust them — but the colour underneath flips a thousand-plus times, and a genuine +37% gross edge is shredded into a 62% net loss by fees. Smoothing the candles further just trims the bleeding toward zero without ever producing a real system, and 2025 buried even that. The lesson is a recurring one: a signal that looks clean on the chart can still be an over-trading machine once you price in the toll of acting on it.
FAQ
You should use Smoothed Heikin Ashi, not raw.
We tested that — sweeping the EMA length. It helps (fewer trades), and at EMA-20 it reaches +4% on BTC 4H, but that’s a marginal, single-coin, single-timeframe result that still fails the yearly gate. It’s a smaller loss, not an edge.
Heikin Ashi is for reading trends, not a mechanical signal.
Agreed, and that’s the honest takeaway: as a visual context it can be useful; as a mechanical colour-flip entry it over-trades and loses. We test the rule people actually trade.
Can I replicate this?
Yes — standard Heikin Ashi from Binance OHLC, colour-flip entries, 0.06%/side, five coins, nine timeframes. Every table reproduces.
See also: Stochastic (the other over-trading autopsy), ADX / DMI, Donchian / Turtle, Triple SuperTrend, and the conditional passes VWAP and Ichimoku (daily).
Disclaimer: educational research, not financial advice. Past performance does not guarantee future results. Never trade money you cannot afford to lose.
Leave a Reply