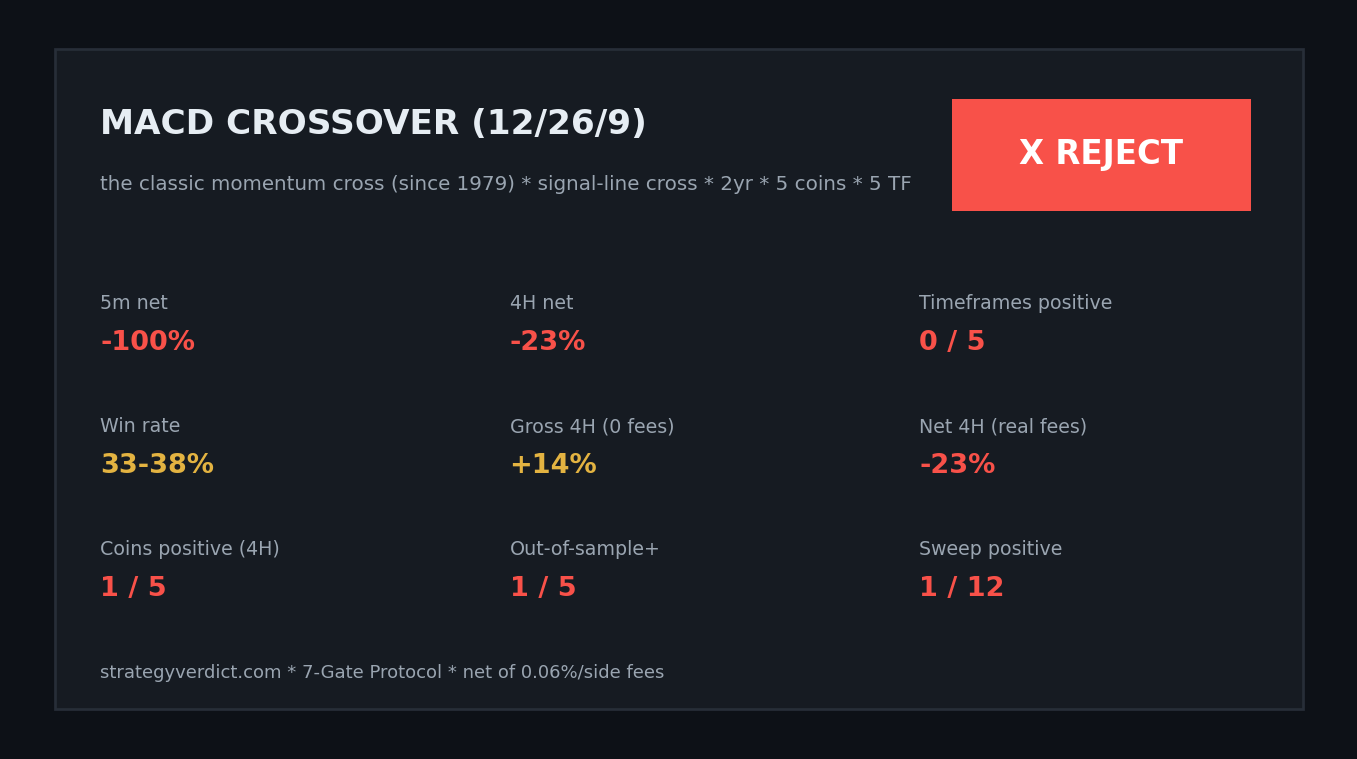
MACD is the indicator on the first page of every “Trading 101” course. Gerald Appel built it in the late 1970s; nearly half a century later it is still the default momentum tool on every platform, and the crossover rule — buy when the MACD line crosses above its signal line, sell when it crosses below — is taught to more beginners than any other single signal. So does the most famous crossover in trading actually work? We ran the standard 12/26/9 through the 7-Gate Protocol. Verdict: reject.
Gate 00 — Fidelity
Standard MACD: the 12-period EMA minus the 26-period EMA, with a 9-period EMA of that as the signal line. Identical to every platform’s default. Nothing to get wrong — the only question is whether crossing those lines makes money.
The Exact Rules
- Signal: MACD line crosses above the signal line → long; crosses below → short. Stop-and-reverse (always in the market)
- Settings: 12 / 26 / 9 (the universal default)
- Execution: on the bar close, no look-ahead; costs 0.06%/side; data Binance spot Jul 2024–Jul 2026, BTC/ETH/SOL/BNB/XRP, 5m–1D; benchmark buy & hold
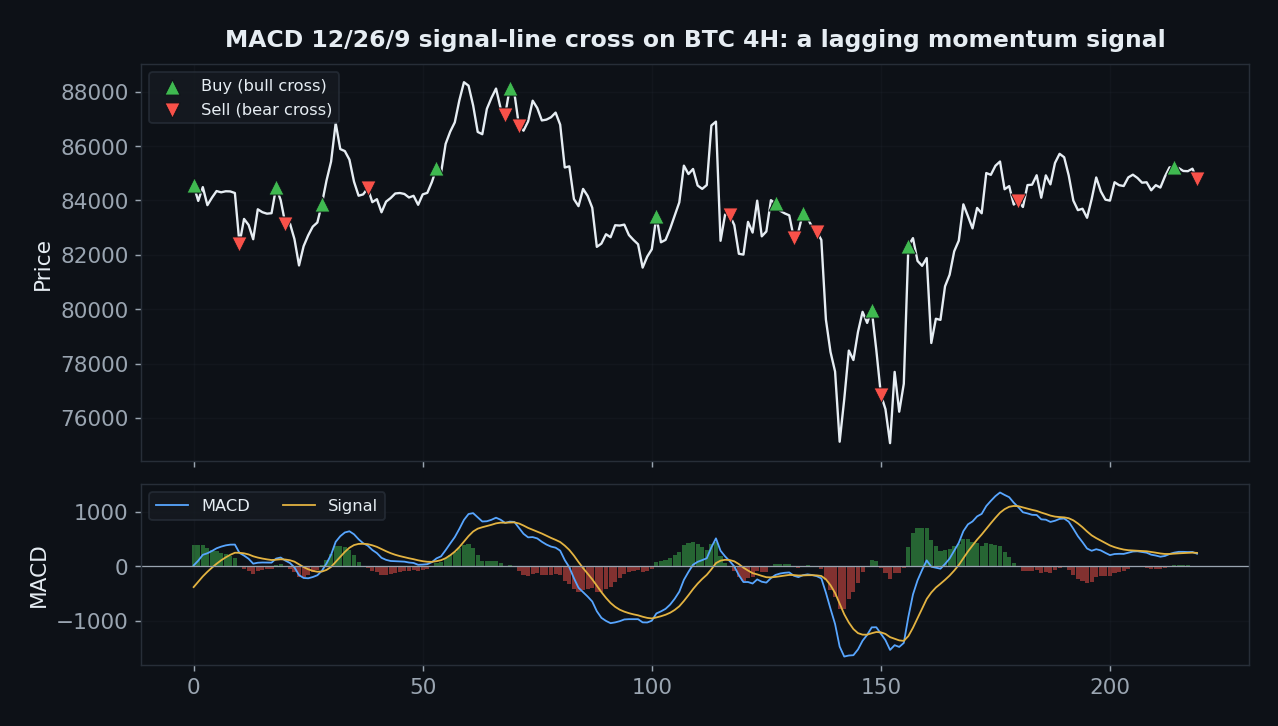
Notice the shape of the signal: MACD is a lagging momentum oscillator. By the time the lines cross, a good chunk of the move has already happened — you buy after the bounce and sell after the drop. That lag is the whole story.
Gate 06a — Every Timeframe
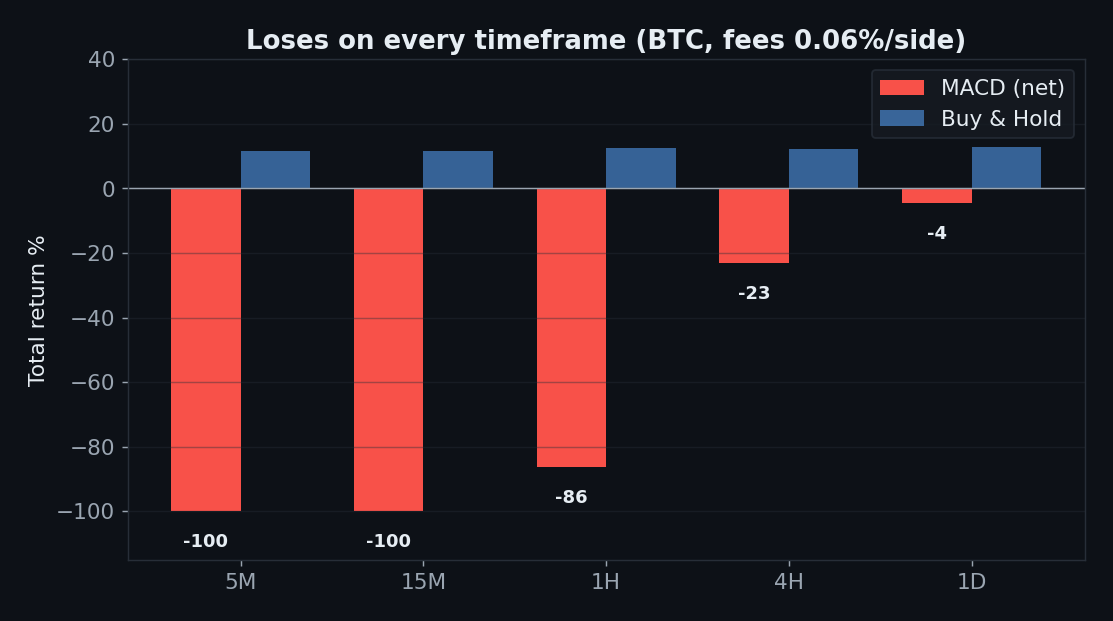
It loses on all five: 5m −100% (16,762 trades — the account is vaporised), 15m −100%, 1h −86%, 4h −23%, and even the daily is negative at −4%. Zero timeframes positive, zero beat buy & hold. A 33–38% win rate with tiny wins and a lagging entry is a recipe for exactly this.
Gate 02 — Friction
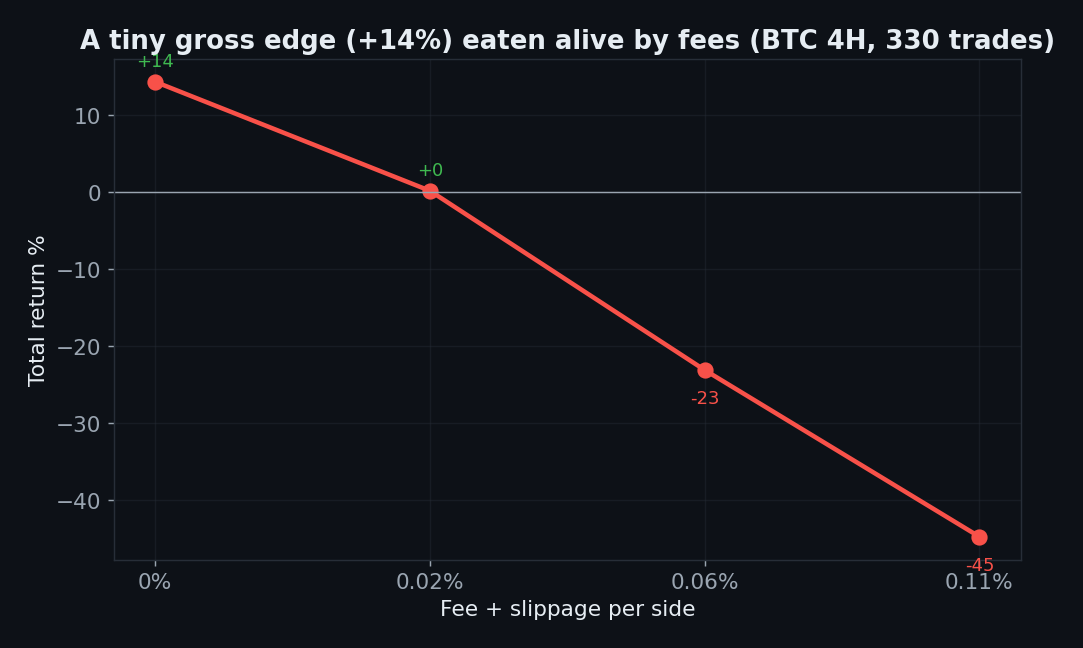
MACD does have a whisper of a gross edge — +14% on BTC 4H with zero fees. But it takes 330 trades to collect it, and at a realistic 0.06%/side that +14% becomes −23%. The edge is smaller than the toll. This is the recurring epitaph on this site: a real-but-tiny signal, over-traded until the fees are bigger than the alpha.
Gate 04 — Out-of-Sample
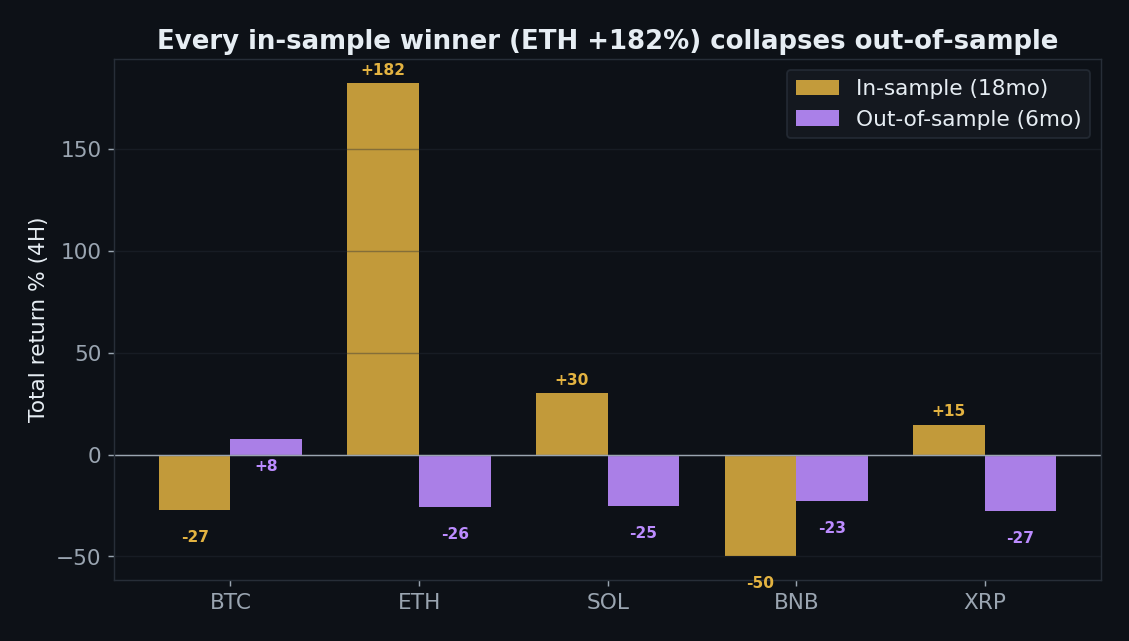
Split 18 months in / 6 months out and the overfit is glaring. ETH looks like a miracle in-sample at +182% — and prints −26% out-of-sample. SOL +30% → −25%. XRP +15% → −28%. Only 1 of 5 coins is positive out-of-sample. The in-sample winners were the strategy memorising the past, not predicting the future.
Gate 06b & 05 — Coins and Robustness
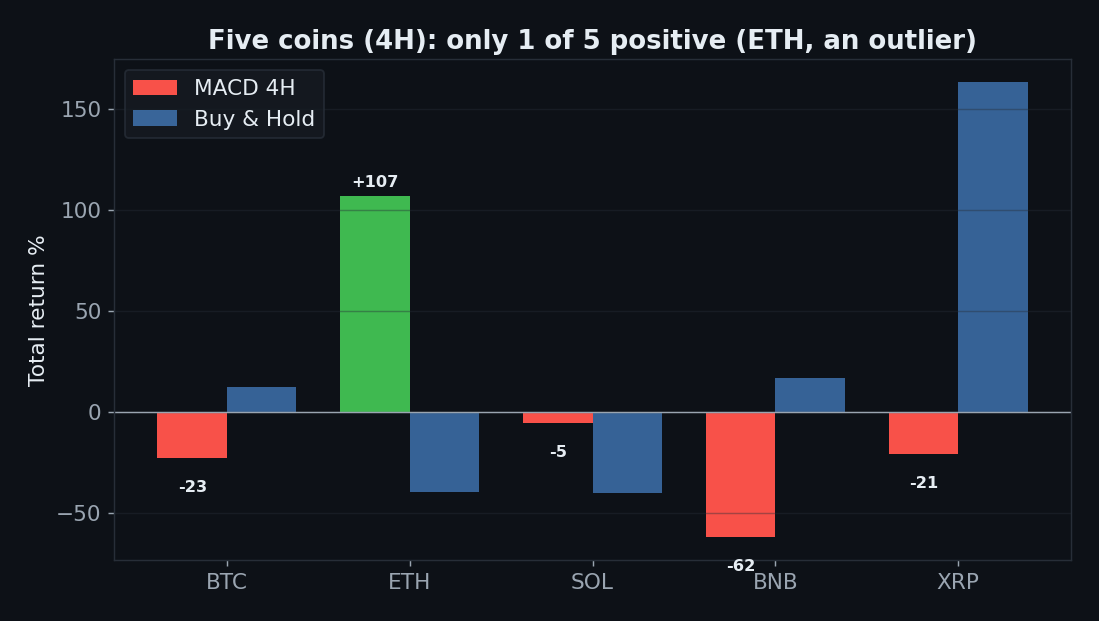
On 4H only 1 of 5 coins is profitable, and that one (ETH, +107%) is the same coin that dies out-of-sample. The parameter sweep is 1 of 12 positive, and neither popular fix helps: the zero-line cross is −55%, the EMA-200 trend filter −15%. Every reasonable variation of MACD-alone loses money.
The Verdict: REJECT
- Gate 0 — Indicator fidelity — pass (standard 12/26/9, identical to every platform’s default)
- Gate 1 — Sanity — pass (signal on the closed bar, no look-ahead)
- Gate 2 — Friction — fail (+14% gross → −23% net on 4H across 330 trades)
- Gate 3 — Yearly consistency — fail (no consistently positive year on any timeframe)
- Gate 4 — Out-of-sample — fail (1/5 positive; ETH +182% in-sample → −26% out)
- Gate 5 — Robustness — fail (1 of 12 sweep cells positive; zero-cross −55%, EMA-200 filter −15%)
- Gate 6 — Multi-market — fail (1 of 5 coins on 4H, and that one is an outlier)
- Gate 7 — vs Buy & Hold — fail (0 of 5 timeframes beat buy & hold)
The MACD crossover is 45 years old and still cannot beat holding. It is a lagging momentum signal: by the time the lines cross the move is half over, so you buy high-ish and sell low-ish, hundreds of times, paying a fee on each. There’s a faint gross edge, but it’s smaller than the cost of harvesting it, it doesn’t generalize across coins, and every in-sample star collapses out-of-sample. MACD is a fine way to read momentum on a chart. As a mechanical entry/exit, it’s a museum piece.
FAQ
Everyone says to combine MACD with RSI / a filter.
Exactly — because MACD alone doesn’t work, which is what we measured. “Add a second indicator until the backtest looks good” is a different, and easily over-fit, strategy. We test the thing that’s actually taught: the crossover.
Isn’t the daily at least okay?
No — the daily is −4% and still loses to simply holding (+13%). It’s the least-bad timeframe, not a good one.
Can I replicate this?
Yes — MACD(12,26,9), public Binance data, 0.06%/side. Signal-line cross, five coins, five timeframes.
See also: RSI 30/70, UT Bot, Range Filter, Bollinger reversion, and the conditional passes VWAP and Ichimoku (daily).
Disclaimer: educational research, not financial advice. Past performance does not guarantee future results. Never trade money you cannot afford to lose.
Leave a Reply