Last time, the RSI 30/70 strategy died at gate 2 — fees ate it alive before we even got to the interesting questions. This strategy is different. It’s the first one to make it deep into the 7-Gate Protocol: five symbols, sixteen parameter sets, and a full out-of-sample split.
It survived more gates than anything we’ve tested. It still didn’t survive all of them. Here’s the complete autopsy — including exactly where it works and where it dies.
The Exact Rules
- Timeframe: 4H candles
- Trend filter: EMA(100) — longs only above it, shorts only below it
- Entry: price pulls back and touches the daily VWAP, then closes back in the trend direction
- Stop loss: fixed at entry ± 2.0 × ATR(14) — never trailed
- Exit: close crossing back through the EMA(100) (trend over), or the stop
- Fees: 0.06% per side, intrabar stop fills
- Data: 2 years (July 2024 – July 2026), Binance public data
One counterintuitive detail from our earlier testing: a trailing stop destroys this strategy (PF 0.76). Pullback entries get shaken out by noise. The fixed stop is not a preference — it’s the difference between profit and ruin.
The Baseline: BTC, 4H
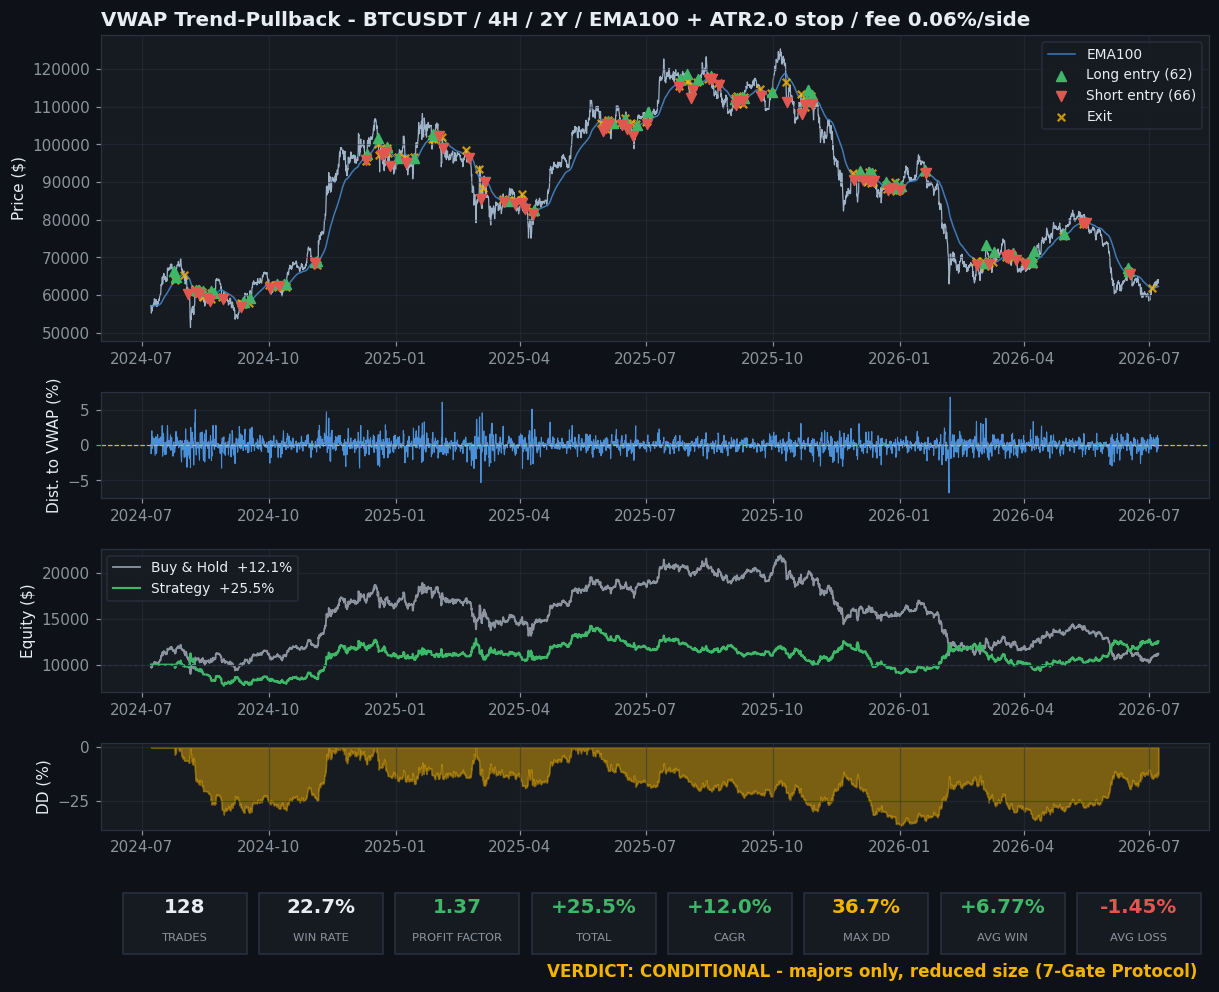
Look at that win rate: 22.7%. Three losses out of four trades — and it still made +25.5%, double Buy & Hold. This is the exact mirror image of the RSI lesson: average win +6.77%, average loss −1.45%. Win rate is a vanity metric. Payoff asymmetry is the business model.
Gate 03 — Monthly Consistency
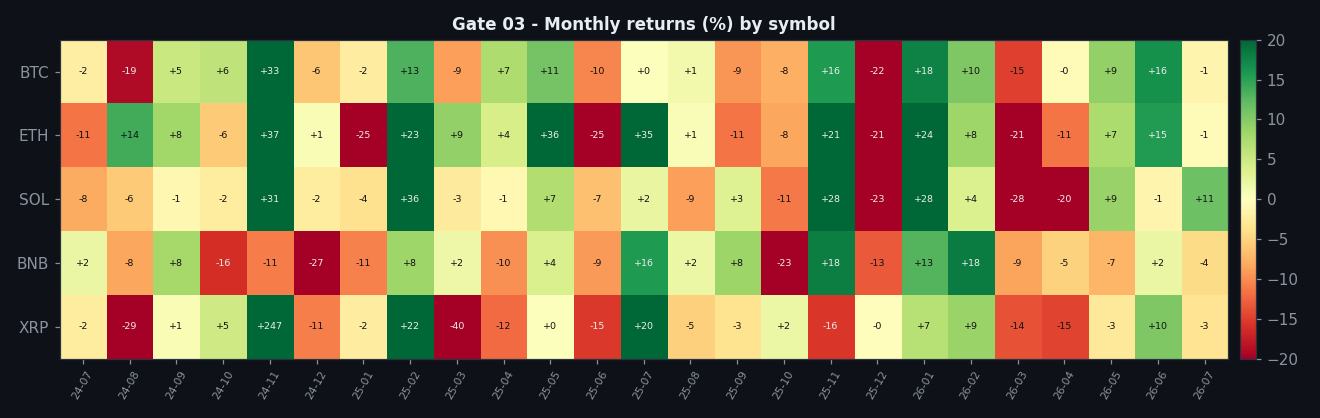
Not pretty, not terrible. Long flat-to-red stretches punctuated by big green months — the classic trend-following profile. You don’t get paid monthly; you get paid when trends happen.
Gate 04 — Out-of-Sample
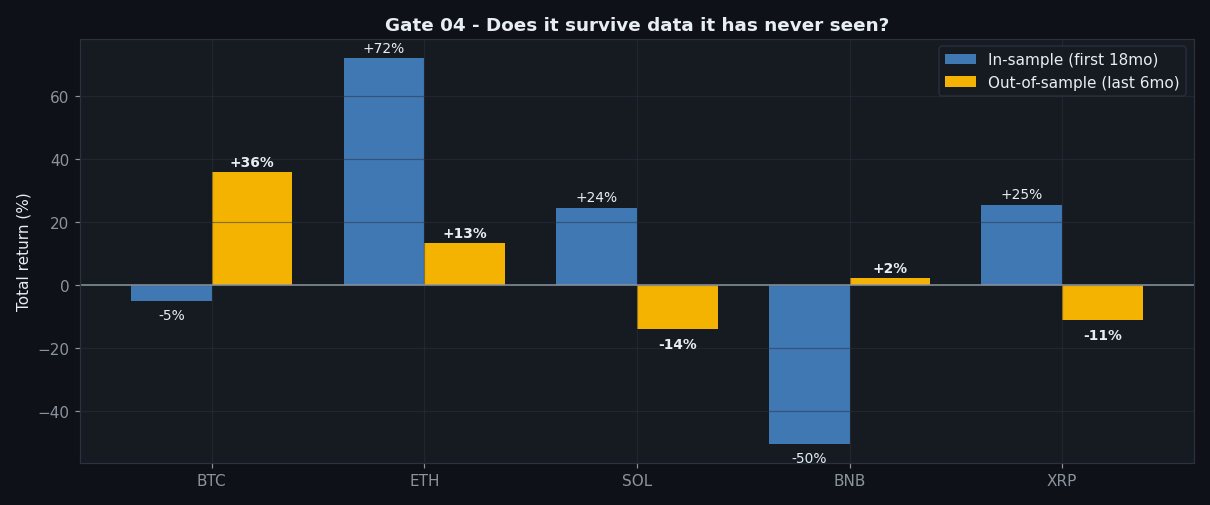
We split the data: first 18 months in-sample, last 6 months untouched. 3 of 5 symbols stayed positive out-of-sample. BTC actually got better (PF 2.46 out-of-sample). SOL and XRP flipped negative. Partial pass — the edge doesn’t evaporate on unseen data, but it’s not universal either.
Gate 05 — Parameter Robustness
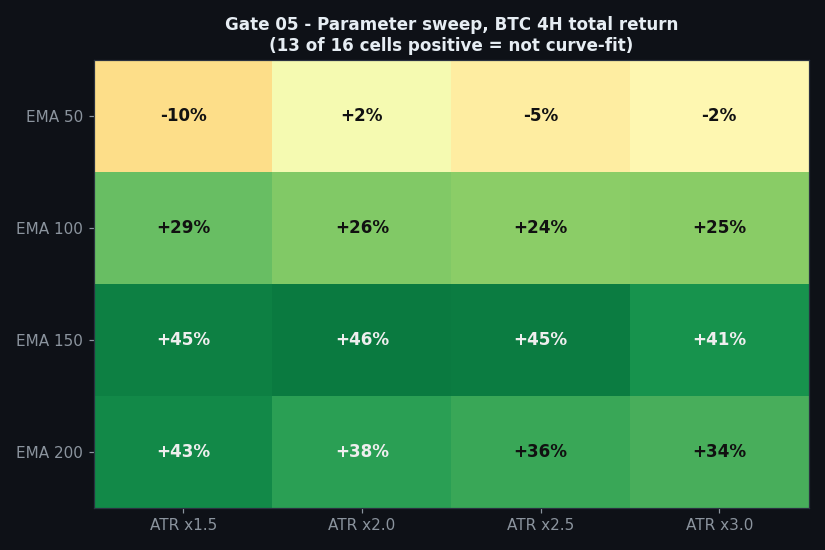
Sixteen combinations of EMA length (50–200) and ATR stop multiple (1.5–3.0): 13 of 16 positive. This is what a real edge looks like — it degrades gracefully when you wiggle the knobs. A curve-fit strategy shows one green cell in a sea of red.
Gate 06 — Five Symbols, Same Rules
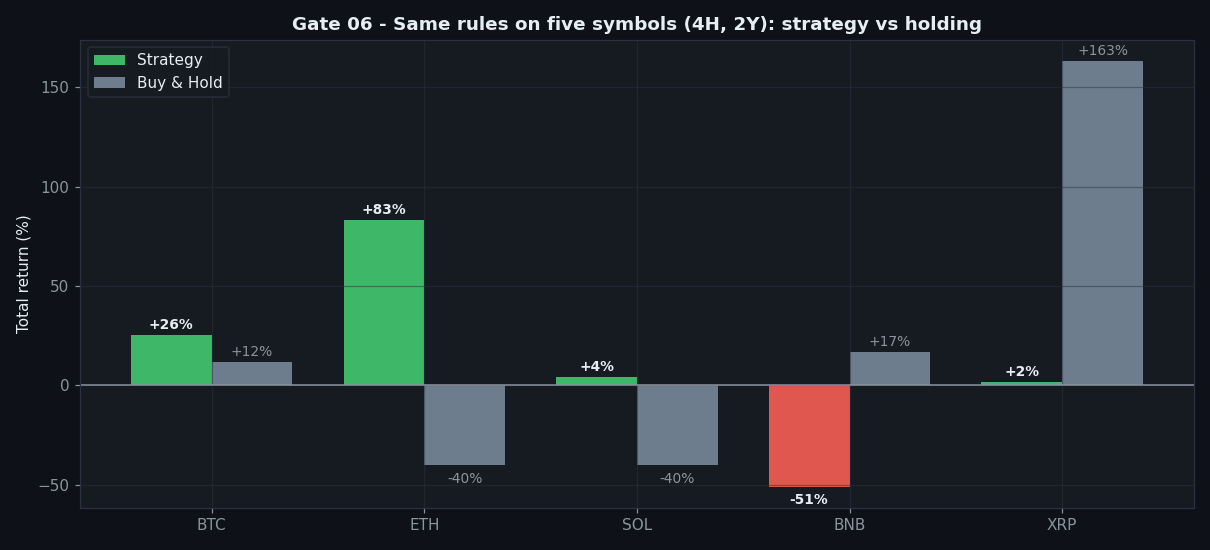
| Symbol | Trades | PF | Total return | Max DD | Buy & Hold | Verdict |
|---|---|---|---|---|---|---|
| BTC | 128 | 1.37 | +25.5% | 36.7% | +12.1% | beats holding |
| ETH | 128 | 1.51 | +83.3% | 41.8% | −39.8% | crushes holding |
| SOL | 133 | 1.15 | +4.2% | 51.1% | −40.2% | beats holding |
| BNB | 165 | 0.80 | −50.8% | 60.6% | +16.8% | fails |
| XRP | 148 | 1.68 | +1.5% | 75.9% | +163.2% | loses to holding |
This is why gate 06 exists. Test on BTC alone and you’d call it a winner. Test on BNB and you’d call it garbage. Both would be wrong: the edge is real on majors and absent elsewhere. Anyone selling you a strategy that “works on everything” hasn’t run this test.
Every timeframe (why 4-hour is the whole story)
A conditional pass comes with a condition, and for VWAP pullback it is the timeframe. The identical rules, run from 5-minute to daily:
| Timeframe | Trades | Win rate | Profit factor | Net return |
|---|---|---|---|---|
| 5-minute | 9,124 | 11.7% | 0.22 | −100% |
| 15-minute | 3,097 | 15.1% | 0.37 | −100% |
| 30-minute | 1,442 | 18.4% | 0.54 | −93% |
| 1-hour | 709 | 20.3% | 0.71 | −68% |
| 4-hour (baseline) | 159 | 22.6% | 1.20 | +21% |
| 1-day | 30 | 20.0% | 0.73 | −28% |
Every intraday interval loses — a total wipe on 5-minute — and the edge appears only on the 4-hour. Push to daily and the sample thins and it slips back to −28%. This is not a strategy you can run anywhere; it is a 4-hour phenomenon, which is precisely why the verdict is conditional.
Take-profit to stop-loss (4-hour)
Swapping the exit for a fixed stop (2×ATR) and a swept target:
| TP : SL | Trades | Win rate | Profit factor | Net return |
|---|---|---|---|---|
| 1 : 0.5 | 102 | 69.6% | 0.93 | −8% |
| 1 : 1 | 77 | 57.1% | 1.15 | +13% |
| 1 : 1.5 | 72 | 50.0% | 1.29 | +31% |
| 1 : 2 | 61 | 41.0% | 1.16 | +14% |
| 1 : 2.5 | 55 | 38.2% | 1.29 | +27% |
| 1 : 3 | 53 | 32.1% | 1.11 | +5% |
Unlike the rejects on this site, VWAP’s edge survives the exit sweep: for every reward-to-risk from 1:1 to 1:3 the profit factor holds above 1.0, peaking at 1.29. That resilience across exits is what separates a conditional pass from a rejection — though a very tight 1:0.5 target still tips it slightly negative.
The Verdict: CONDITIONAL
Adding up the gates:
- Gate 0 — Indicator fidelity — pass (standard daily VWAP with an EMA trend filter and ATR stop)
- Gate 1 — Sanity — pass (signals on closed bars, no look-ahead)
- Gate 2 — Friction — pass (still profitable after 0.06%/side — the gate where RSI died)
- Gate 3 — Yearly consistency — partial (trend-dependent, with long flat stretches)
- Gate 4 — Out-of-sample — partial (3 of 5 positive)
- Gate 5 — Robustness — pass (13 of 16 sweep cells positive)
- Gate 6 — Multi-market — partial (works on majors; BNB fatal)
- Gate 7 — vs Buy & Hold — partial (beats it on 3 of 5 coins)
Our verdict stamp says CONDITIONAL, and now the conditions are precise:
Majors only (BTC/ETH). Reduced position size — the 37–42% drawdowns are real. As a portfolio component, not a standalone system. Traded outside those conditions, expect the BNB outcome.
That nuance is the whole point of this site. A YouTube title would say “this VWAP strategy made 83% on ETH!” A different YouTube title would say “I tested VWAP and lost 50%!” Both are technically true. Neither is the truth.
FAQ
Why does it fail on BNB?
BNB spent much of the window in choppy, range-bound conditions where trend filters generate false regime signals. The strategy needs trends; BNB didn’t provide them.
Would a different VWAP (weekly, anchored) help?
In our earlier tests, weekly VWAP performed worse as a touch level. Volume-profile POC levels also degraded results — daily VWAP carried all the edge.
What about the low win rate — can I handle 3 losses out of 4?
That’s the real question. Statistically it works; psychologically most people abandon it during the losing streaks. That’s a you-parameter, not a strategy parameter.
Can I replicate this?
Yes — the rules above are complete, data is public Binance OHLCV, fees 0.06%/side. Every number in this article falls out of those inputs.
Disclaimer: This is educational research, not financial advice. Past performance does not guarantee future results. Never trade money you cannot afford to lose.
Leave a Reply