The Stochastic oscillator is on every beginner’s screen, usually with the same rule attached: buy when %K crosses above %D, sell when it crosses below. George Lane popularised it in the 1950s as a way to measure momentum’s speed. Seventy years later the %K/%D crossover is still one of the most-taught mechanical signals in retail trading. It also generates an astonishing number of trades — which turns out to be exactly the problem. We ran the standard 14/3/3 through the 7-Gate Protocol. Verdict: reject.
Gate 0 — Fidelity
Standard Stochastic: %K is a 3-period smoothing of where price closed within its 14-bar high–low range; %D is a 3-period average of %K. Buy when %K crosses above %D, sell when it crosses below. Identical to every platform’s default. The only question is what happens when you actually trade the cross.
The Exact Rules
- Signal: %K crosses above %D → long; %K crosses below %D → short (stop-and-reverse, always in the market)
- Settings: 14 / 3 / 3 (the universal default)
- Execution: on the bar close, no look-ahead; 0.06%/side; Binance spot Jul 2024–Jul 2026; BTC/ETH/SOL/BNB/XRP; 5m–1D; benchmark buy & hold
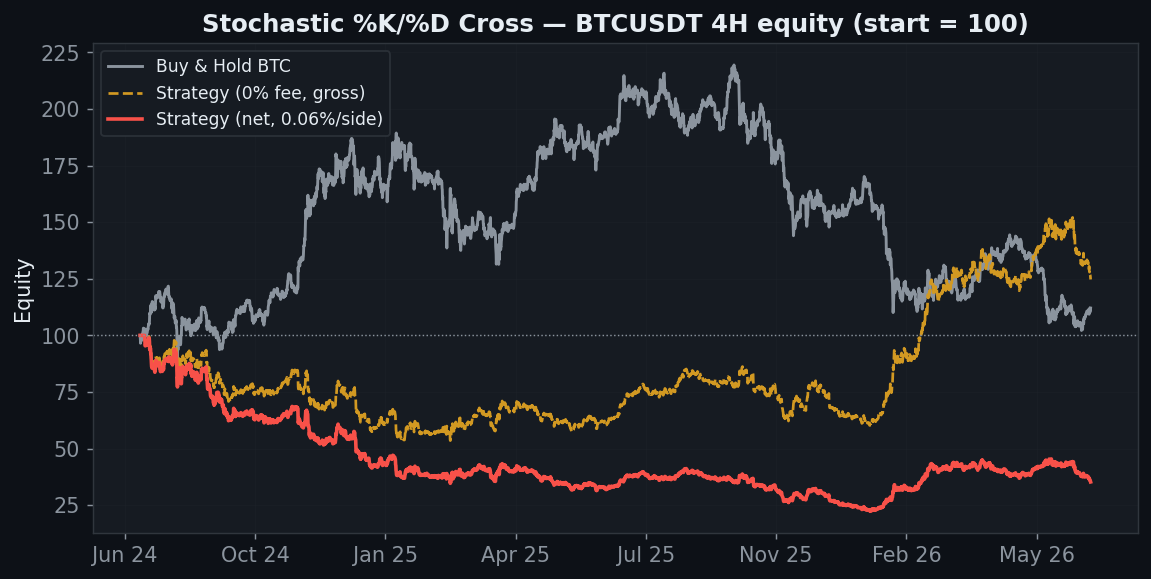
BTC 4H ends at −65%. But look at the two strategy lines: the gross (0-fee) curve actually finishes up around +25%, while the net curve craters. That gap is the entire story of this indicator — and it is the widest gap on this whole site.
Gate 2 — The Most Fee-Sensitive Strategy We’ve Tested
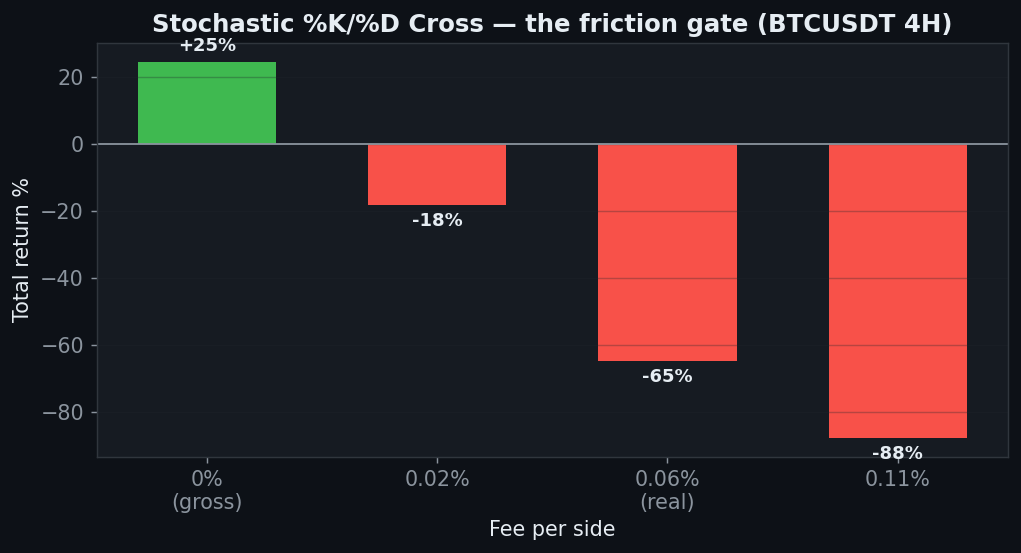
At zero fees, BTC 4H makes +25%. Add a gentle 0.02%/side and it drops to −18%. At a realistic 0.06% it is −65%. At 0.11% it is −88%. There is a faint gross edge in the crossover — but harvesting it requires so many trades that the toll dwarfs the prize several times over. No strategy we’ve examined loses more of its gross return to friction than this one.
Gate 6 — The Whipsaw Machine
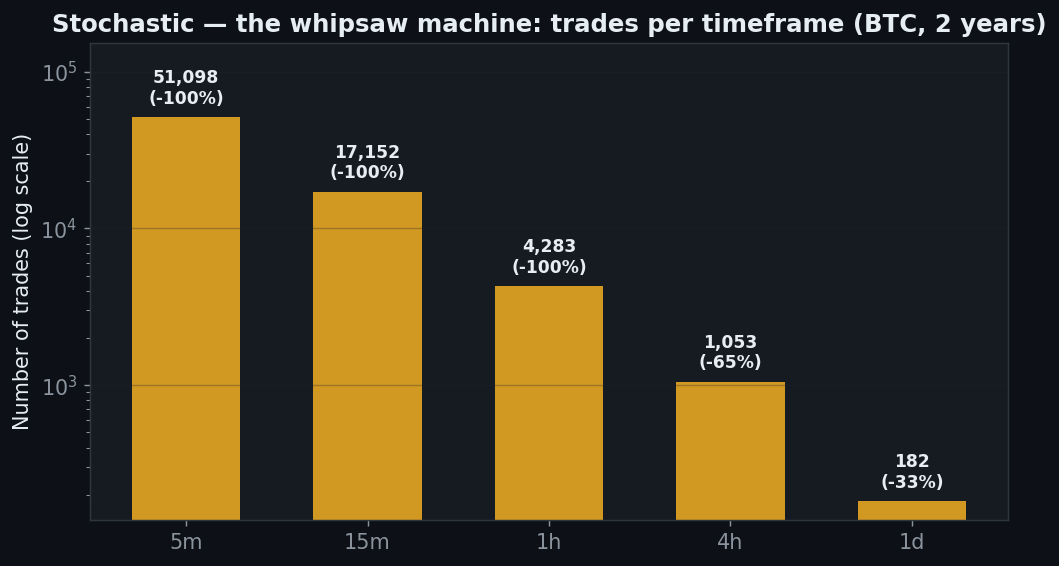
Why so fee-sensitive? Because %K and %D cross constantly. On BTC 5m the crossover takes 51,098 trades in two years — and the account goes to −100%. 15m: 17,152 trades, −100%. 1h: 4,283, −100%. Even the 4H, the slowest liquid timeframe, is 1,053 trades. Every one of those round-trips pays a fee. Stochastic doesn’t lose because it’s wrong more often than right — it loses because it trades so much that being 40% right at a 0.06% toll is a guaranteed bleed.
Gate 6b — Five Coins, and a Green Cell That Lies
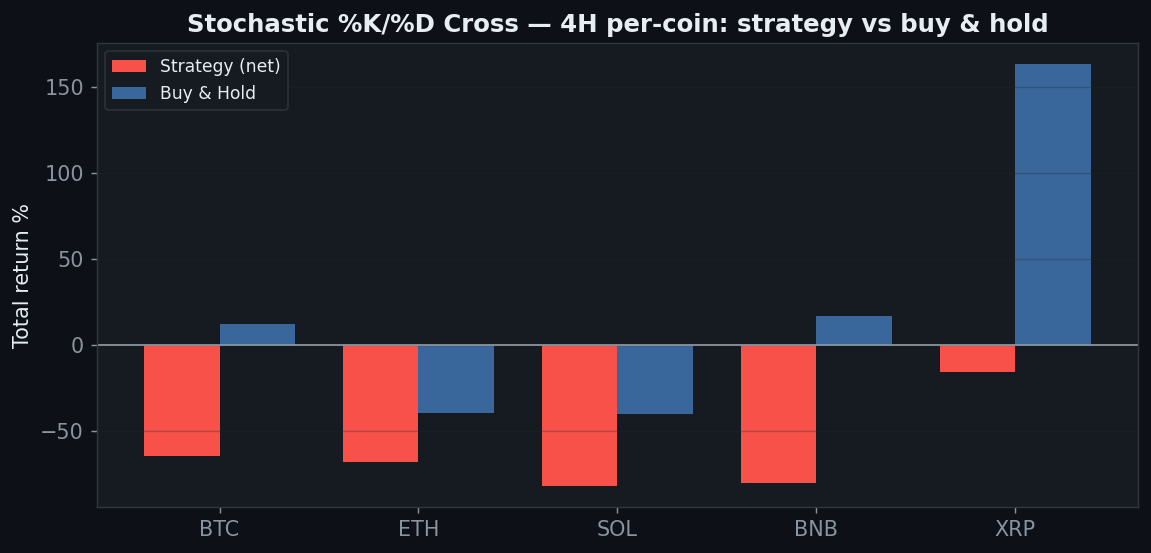
On 4H, all five coins lose — BTC −65%, ETH −68%, SOL −82%, BNB −80%, XRP −16%. Zero of five. Now, one gate does flash green in the raw data: the out-of-sample split shows 5/5 coins positive over the final six months. Do not be fooled by it. That is a few dozen trades in one short window, sitting at the tail end of a run that lost 65–82% per coin. A brief green patch after a multi-year wipeout is the definition of small-sample noise. It is precisely why we weight full-sample behaviour and friction above a single lucky window — and why we report it rather than cherry-pick it.
The Verdict: REJECT
- Gate 0 — Indicator fidelity — pass (standard 14/3/3 %K/%D)
- Gate 1 — Sanity — pass (signal on the closed bar, no look-ahead)
- Gate 2 — Friction — fail (a +25% gross edge on 4H collapses to −65% net — the most fee-sensitive strategy on this site)
- Gate 3 — Yearly consistency — fail (negative on every timeframe overall)
- Gate 4 — Out-of-sample — fail (noise) (the lone green gate — 5/5 over the last 6 months — is a few-dozen-trade window after a 65–82% loss, not an edge)
- Gate 5 — Robustness — fail (0 of 6 %K × %D-smoothing cells positive)
- Gate 6 — Multi-market — fail (0 of 5 coins positive on 4H)
- Gate 7 — vs Buy & Hold — fail (0 of 5 timeframes beat holding)
The Stochastic crossover is a machine for converting your capital into exchange fees. There is a whisper of a gross edge in the signal, but the crossover fires so relentlessly — tens of thousands of times on fast charts — that friction buries it many times over. Being right 40% of the time is fine if you trade 20 times; it is fatal if you trade 20,000. Stochastic is a reasonable way to read momentum. As a mechanical trade trigger, it is the clearest over-trading autopsy we have.
FAQ
You should only take crosses in oversold/overbought zones.
That’s a filter, and a fair idea — but it’s a different strategy, and “add conditions until the curve turns up” is how over-fitting happens. We tested the crossover that’s actually taught first. A zone-filtered version has to clear the same seven gates, friction included.
Isn’t the daily better?
Less catastrophic, not good: the daily is −33% and still loses to holding. Fewer trades means less fee bleed, but the underlying signal still doesn’t predict.
Can I replicate this?
Yes — Stochastic(14,3,3), public Binance data, 0.06%/side, %K/%D cross, five coins, five timeframes.
See also: RSI 30/70, RSI Divergence, MACD crossover, Parabolic SAR, and the conditional passes VWAP and Ichimoku (daily).
Disclaimer: educational research, not financial advice. Past performance does not guarantee future results. Never trade money you cannot afford to lose.