Tag: Momentum

  • True Strength Index Backtest: the Taught Default Is the One That Loses

    True Strength Index Backtest: the Taught Default Is the One That Loses

    The True Strength Index is a double-smoothed momentum oscillator — a close cousin of TRIX, which earned a conditional pass. Does TSI clear the same bar? We ran the standard TSI(25,13) through the 7-Gate Protocol. Verdict: reject.

    Methodology

    • Data: Binance spot, Jul 2024–Jul 2026 (2 years), BTC/ETH/SOL/BNB/XRP
    • Timeframes: 5m–1D (9 buckets, incl. resampled)
    • Execution: TSI is a double-smoothed ratio of price momentum. Long when TSI crosses above its signal line, short when below. Closed-bar, no look-ahead
    • Friction: 0.06%/side (real); 0-fee gross reported too. Benchmark: buy & hold
    • Six axes: timeframe, tsi slow, TP:SL, multi-coin, yearly, out-of-sample

    Gate 0 — Fidelity

    TSI is a double-smoothed ratio of price momentum. Long when TSI crosses above its signal line, short when below. Reproduced exactly (pass).

    True Strength Index equity chart, StrategyVerdict 7-gate backtest

    How It Behaves

    True Strength Index sig chart, StrategyVerdict 7-gate backtest

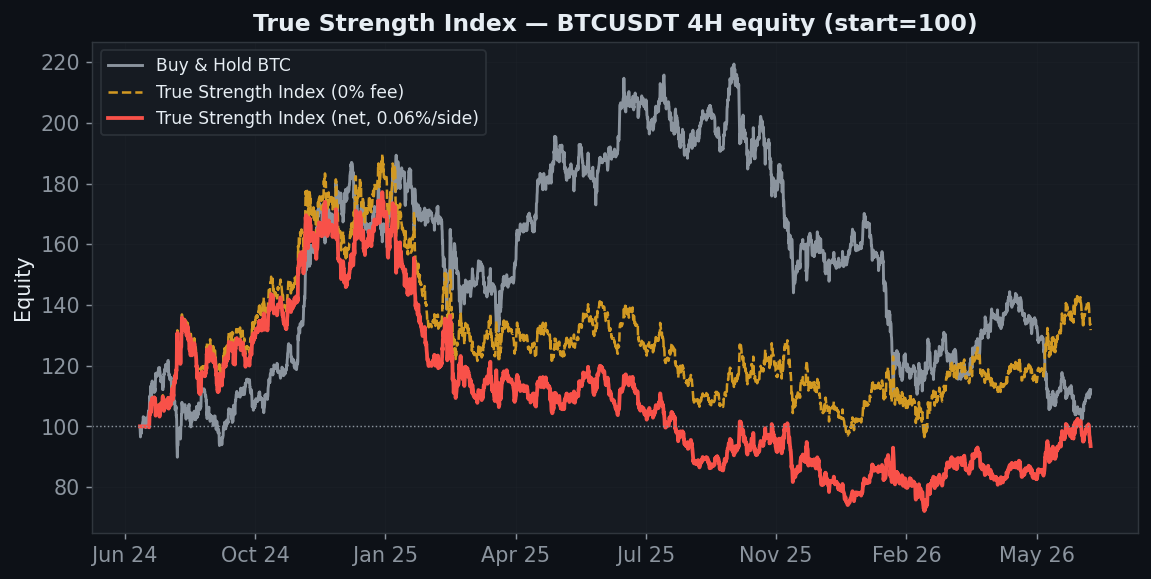
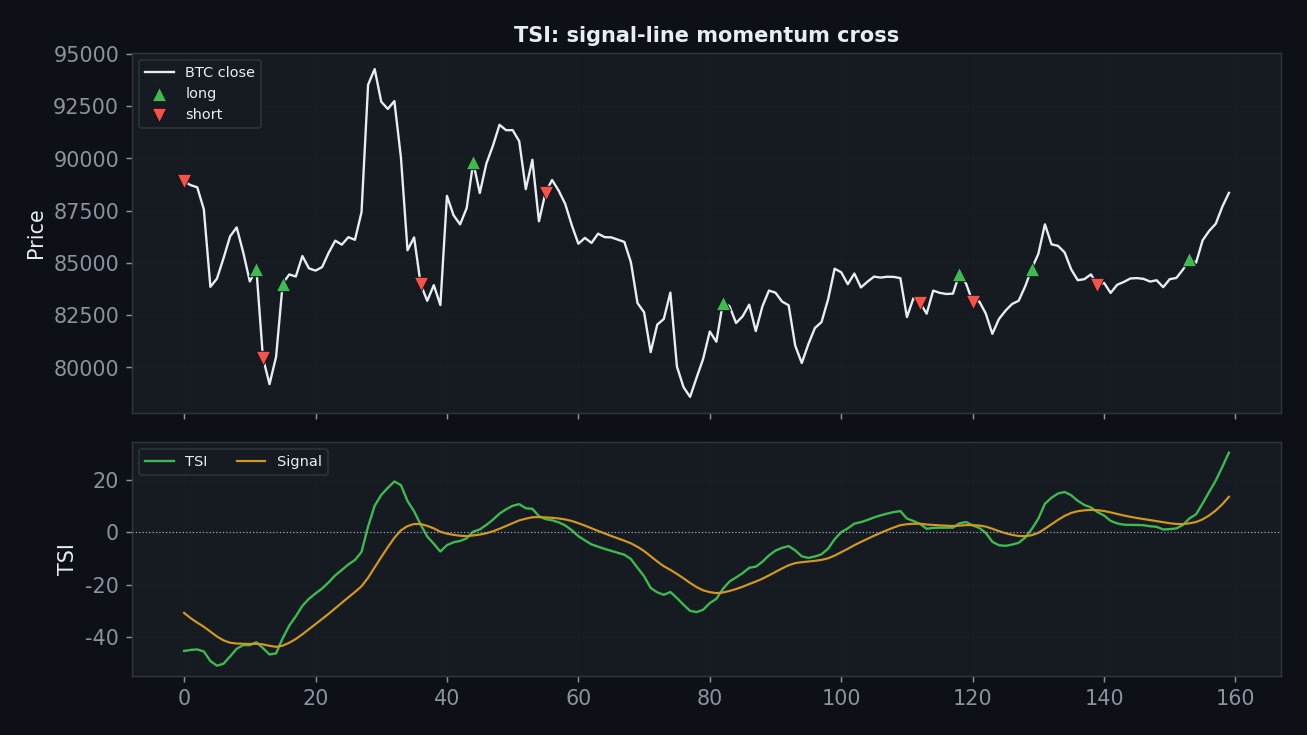
    Like TRIX, TSI is heavily smoothed. But the signal-line cross fires more often than TRIX’s, and on the 4H the default settings produce a small net loss — the smoothing isn’t enough to overcome the whipsaw at this speed.

    Axis 1 — Timeframe

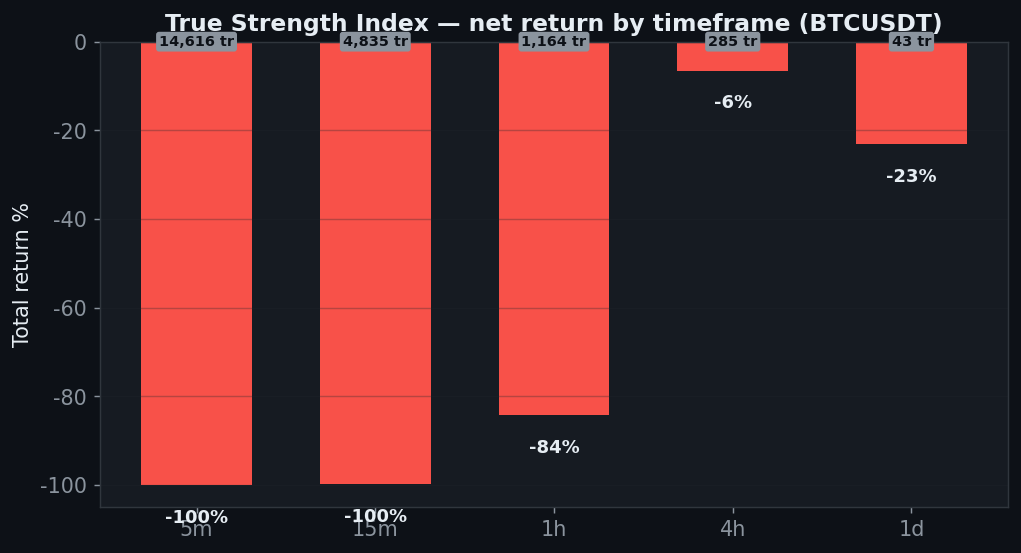
    Timeframe Trades Gross (0 fee) Net (real)
    5분 14,616 −39% −100%
    15분 4,835 −25% −100%
    30분 2,286 +68% −89%
    1시간 1,164 −36% −84%
    2시간 568 +5% −47%
    4시간 285 +32% −6%
    6시간 204 −25% −41%
    12시간 79 +47% +33%
    1일 43 −19% −23%

    Every timeframe is net-negative, including the 4H (−6.5%) and daily (−23%). Unlike TRIX, TSI has no timeframe where the standard settings pay.

    True Strength Index tf chart, StrategyVerdict 7-gate backtest

    Axis 2 — TSI slow

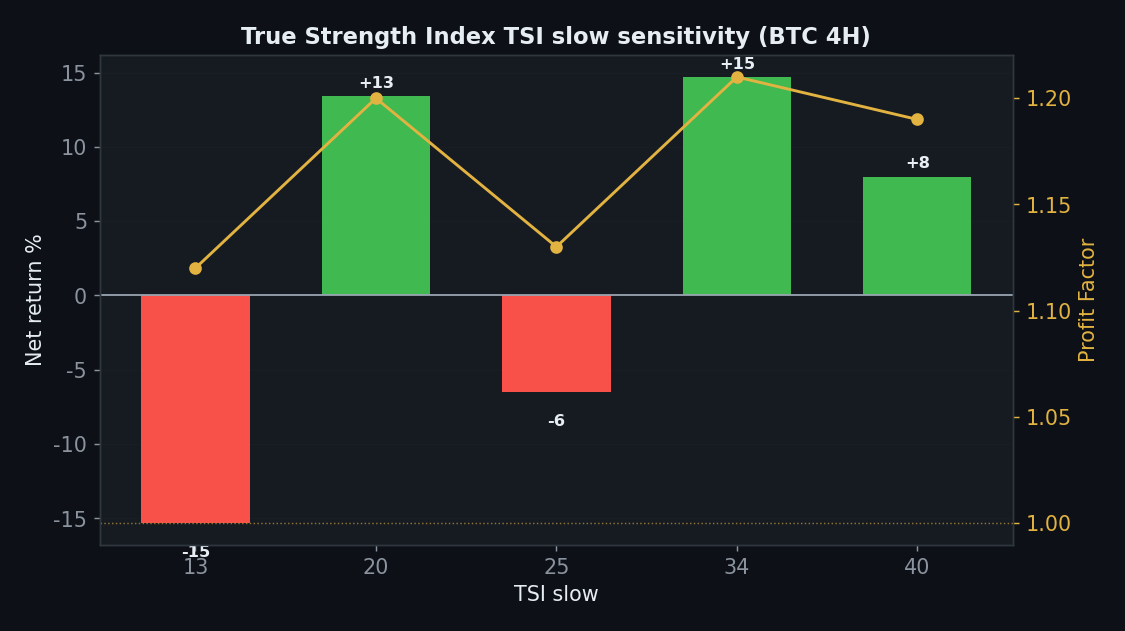
    TSI slow Net PF
    13 −15% 1.12
    20 +13% 1.20
    25 −6% 1.13
    34 +15% 1.21
    40 +8% 1.19

    Tellingly, the taught slow length (25) loses; only 20, 34 and 40 are positive. The default sits in a losing pocket surrounded by mixed results — the opposite of a stable plateau.

    True Strength Index sens_param chart, StrategyVerdict 7-gate backtest

    Axis 3 — TP:SL

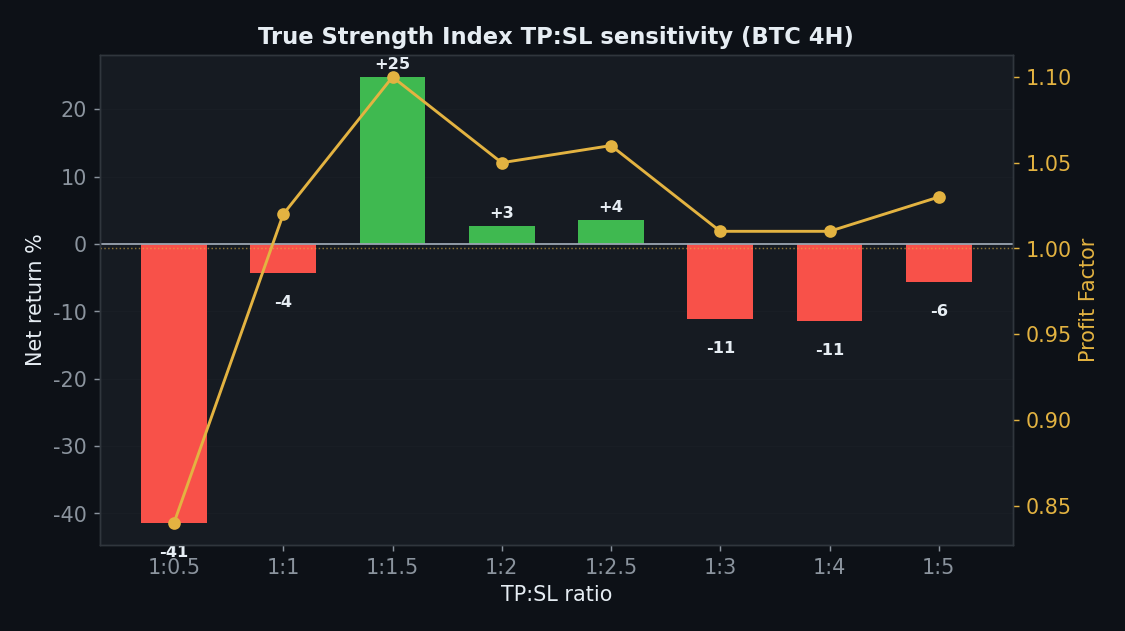
    TP:SL Net PF
    1:0.5 −41% 0.84
    1:1 −4% 1.02
    1:1.5 +25% 1.10
    1:2 +3% 1.05
    1:2.5 +4% 1.06
    1:3 −11% 1.01
    1:4 −11% 1.01
    1:5 −6% 1.03

    Only 3 of 8 TP:SL ratios are positive. A weak, inconsistent exit surface.

    True Strength Index sens_tpsl chart, StrategyVerdict 7-gate backtest

    Axis 4 — Five Coins

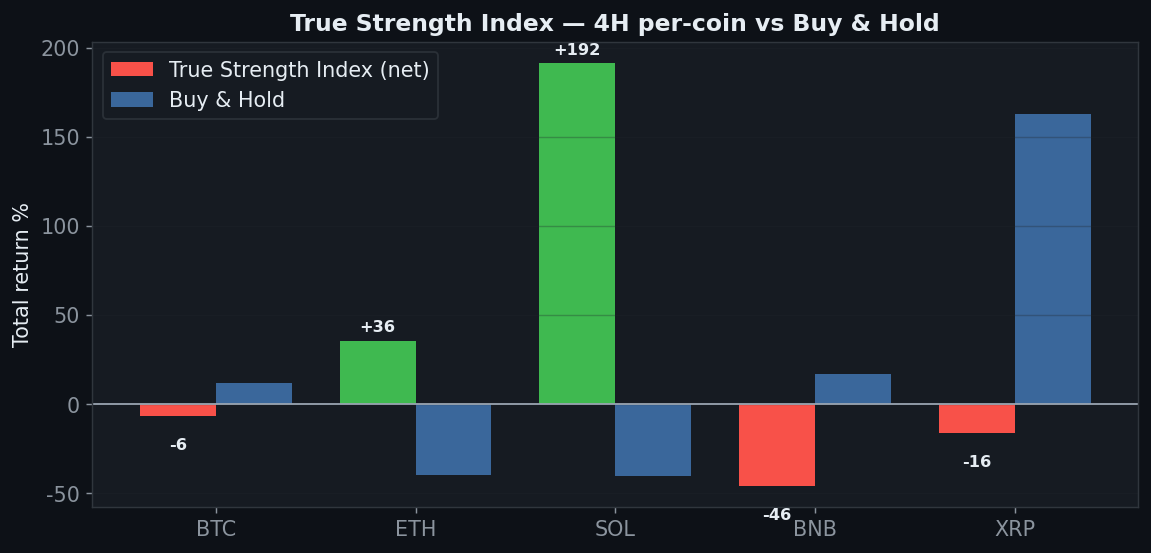
    Coin Strategy net Buy & Hold
    BTC −6% +12%
    ETH +36% −40%
    SOL +192% −40%
    BNB −46% +17%
    XRP −16% +163%

    2 of 5 positive, and the headline (SOL +192%) is a coin that fell 40% — a shorted downtrend, not a beat over a rising benchmark. ETH is the only other winner; BTC, BNB and XRP lose.

    True Strength Index coins chart, StrategyVerdict 7-gate backtest

    Axis 5 — Yearly

    Year BTC 4H net
    2024 +60%
    2025 −53%
    2026 +24%

    2024 +60%, 2025 −53%, 2026 +24%. A catastrophic chop year, unlike TRIX which stayed positive through 2025.

    Axis 6 — Friction

    True Strength Index friction chart, StrategyVerdict 7-gate backtest

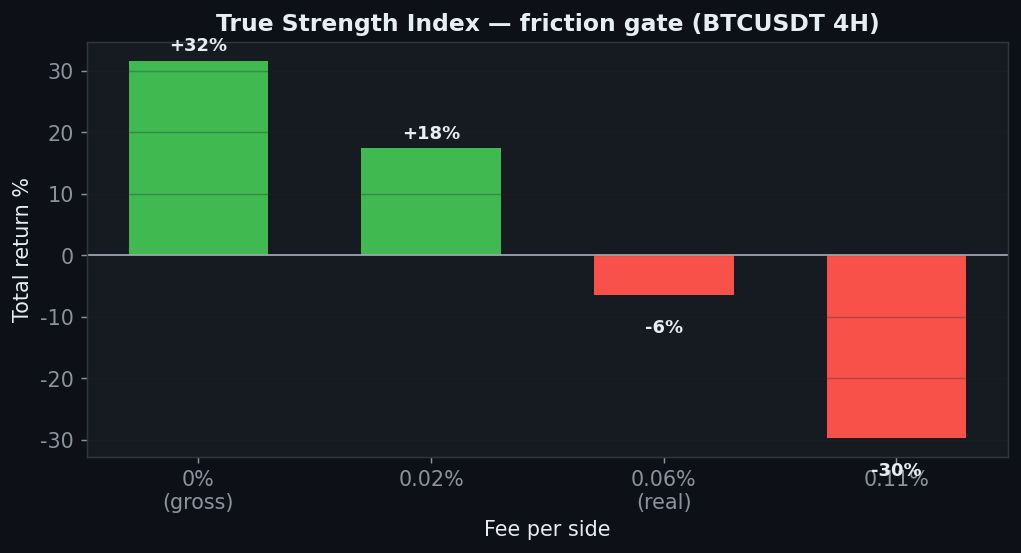
    +32% gross → −6.5% net → −30% at 0.11%. The gross edge doesn’t survive real fees at this trade count.

    The Verdict: REJECT

    • Gate 0 — Indicator fidelitypass (standard TSI(25,13))
    • Gate 1 — Sanitypass
    • Gate 2 — Frictionfail — +32% gross, −6.5% net on 4H
    • Gate 3 — Yearlyfail — +60 / −53 / +24
    • Gate 4 — Robustness (slow length)fail — the default 25 loses; wins are non-default
    • Gate 5 — Robustness (TP:SL)fail — 3 of 8 positive
    • Gate 6 — Multi-marketfail — 2 of 5, SOL win is a shorted downtrend
    • Gate 7 — vs Buy & Holdfail — negative on every timeframe

    TSI is TRIX’s cousin, but it doesn’t clear the same bar. The taught default (25,13) loses on BTC 4H, is negative on all five timeframes, and — damningly — the standard slow length is one of the settings that loses. Its one eye-catching number, SOL +192%, is a shorted downtrend, not a benchmark-beating edge. Where TRIX survived 2025, TSI lost 53%. Reject.

    FAQ

    Why does TRIX pass but TSI doesn’t?
    TRIX’s construction and default happen to land a robust daily edge that held through 2025; TSI’s signal-line cross fires more often, its default setting loses, and its 2025 was −53%. Similar family, different gate results — which is exactly why each indicator gets tested rather than assumed.

    SOL made +192% though.
    On a coin that fell 40% — that’s shorting a downtrend, not beating a rising market. BTC, BNB and XRP all lose, and the default settings lose on the 4H.

    Can I replicate this?
    Yes — TSI(25,13) signal cross, public Binance data, 0.06%/side, five coins, nine timeframes. Every table reproduces.

    See also its cousin the conditional TRIX, and the rejects Awesome Oscillator and Chande Momentum.


    Disclaimer: educational research, not financial advice. Past performance does not guarantee future results. Never trade money you cannot afford to lose.

  • Chande Momentum Oscillator Backtest: a Big Gross Edge That 542 Trades Erase

    Chande Momentum Oscillator Backtest: a Big Gross Edge That 542 Trades Erase

    Tushar Chande’s Momentum Oscillator is a pure momentum zero-cross. It produced a familiar pattern in this series: a genuine gross edge destroyed by turnover. We ran the standard CMO(14) through the 7-Gate Protocol. Verdict: reject.

    Methodology

    • Data: Binance spot, Jul 2024–Jul 2026 (2 years), BTC/ETH/SOL/BNB/XRP
    • Timeframes: 5m–1D (9 buckets, incl. resampled)
    • Execution: CMO measures the balance of up-moves versus down-moves over 14 bars, scaled −100 to +100. Long above zero, short below. Closed-bar, no look-ahead
    • Friction: 0.06%/side (real); 0-fee gross reported too. Benchmark: buy & hold
    • Six axes: timeframe, cmo length, TP:SL, multi-coin, yearly, out-of-sample

    Gate 0 — Fidelity

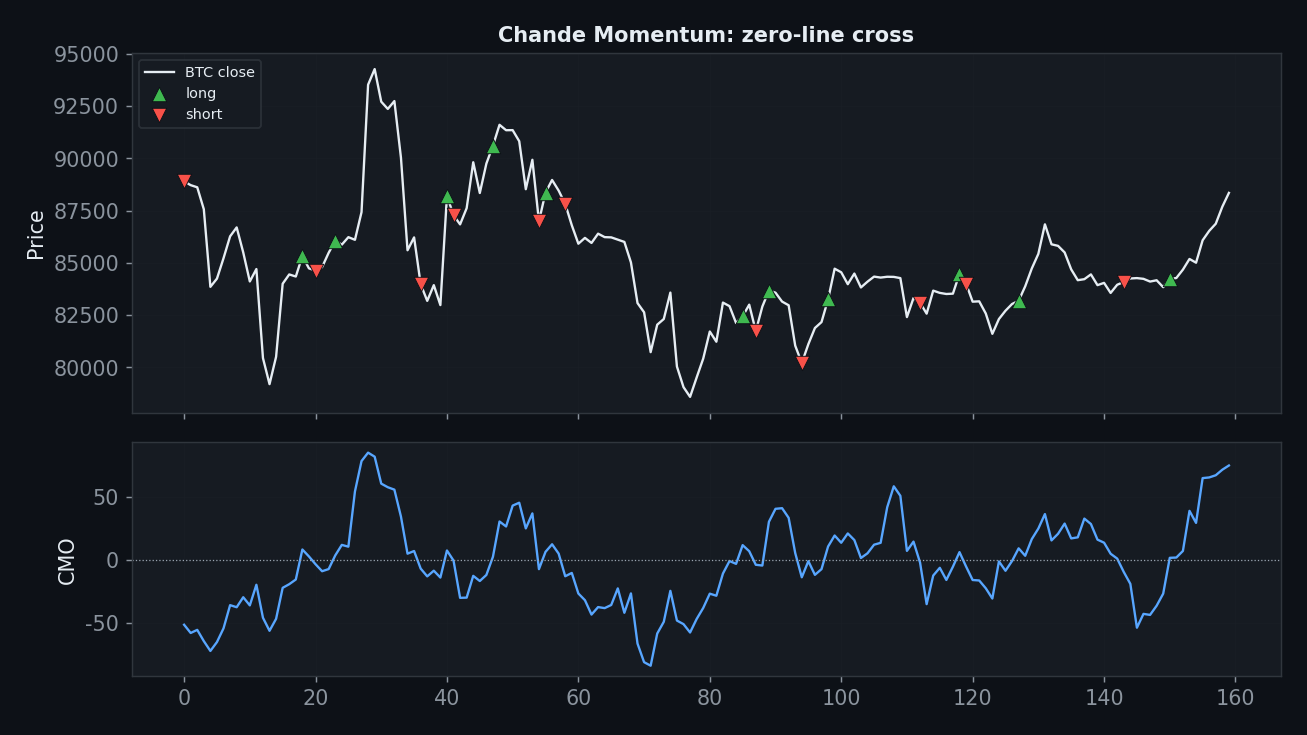
    CMO measures the balance of up-moves versus down-moves over 14 bars, scaled −100 to +100. Long above zero, short below. Reproduced exactly (pass).
    Chande Momentum equity chart, StrategyVerdict 7-gate backtest

    How It Behaves

    Chande Momentum sig chart, StrategyVerdict 7-gate backtest

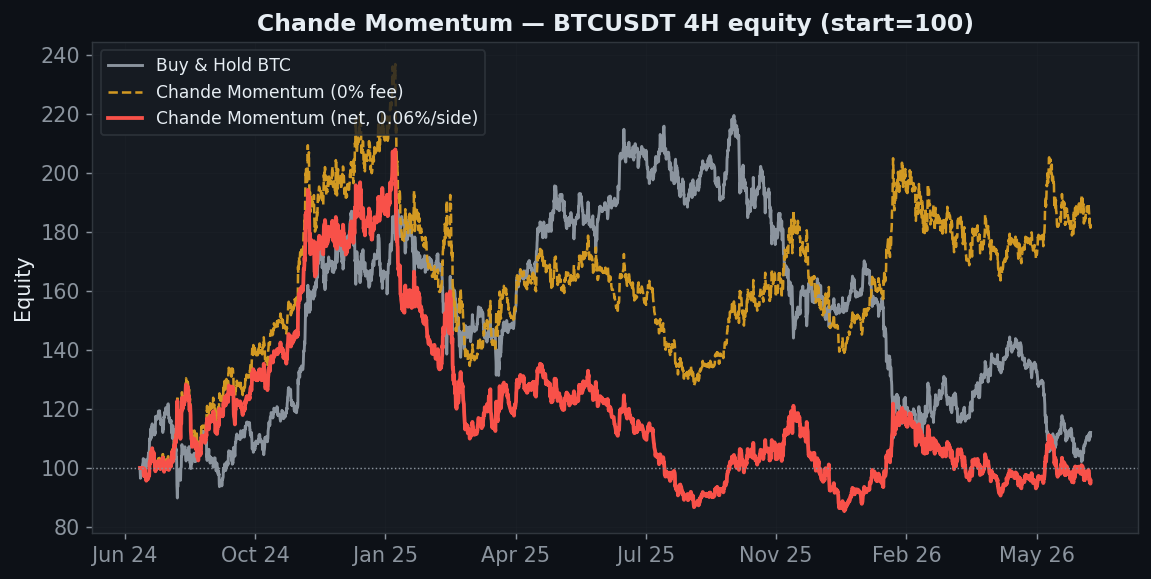
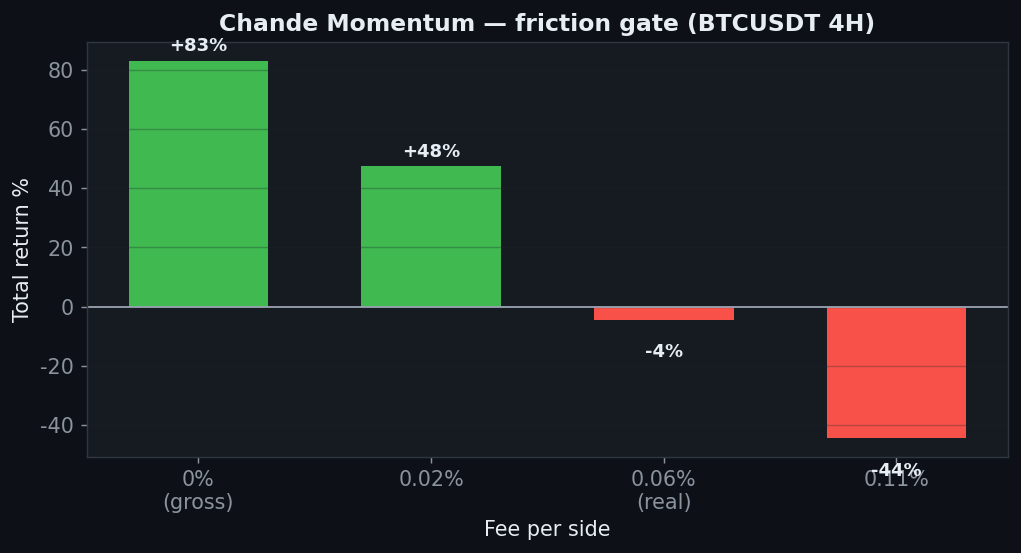
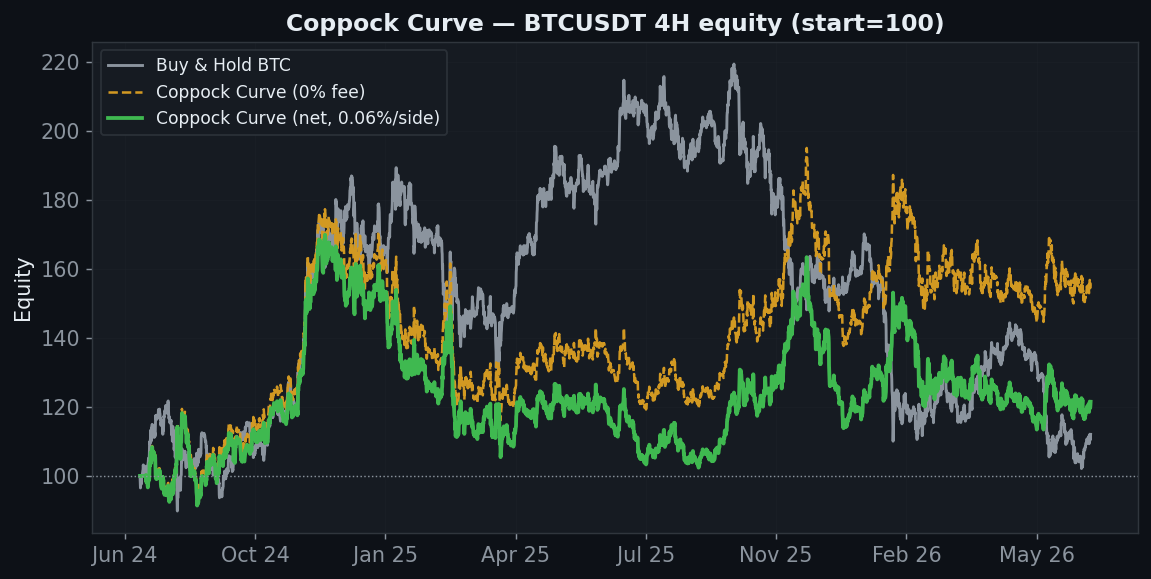
    CMO catches momentum — at zero fees the BTC 4H returns +83%. But the zero-line is noisy, so the strategy flips 542 times, and at real fees that churn erases the entire edge.

    Axis 1 — Timeframe

    Timeframe Trades Gross (0 fee) Net (real)
    5분 26,670 +4% −100%
    15분 9,248 −52% −100%
    30분 4,675 +11% −100%
    1시간 2,271 −35% −96%
    2시간 1,137 −38% −84%
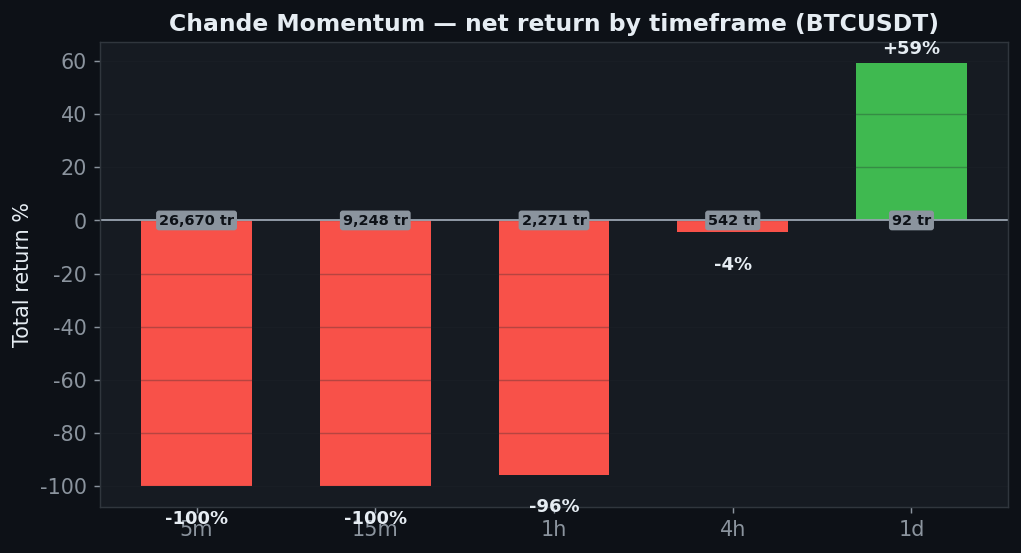
    4시간 542 +83% −4%
    6시간 362 −31% −56%
    12시간 174 +35% +9%
    1일 92 +78% +59%

    The 4H is +83% gross but −4.5% net; the daily is the lone net-positive timeframe (+59%). Everything else loses. A real signal, buried under transaction costs.

    Chande Momentum tf chart, StrategyVerdict 7-gate backtest

    Axis 2 — CMO length

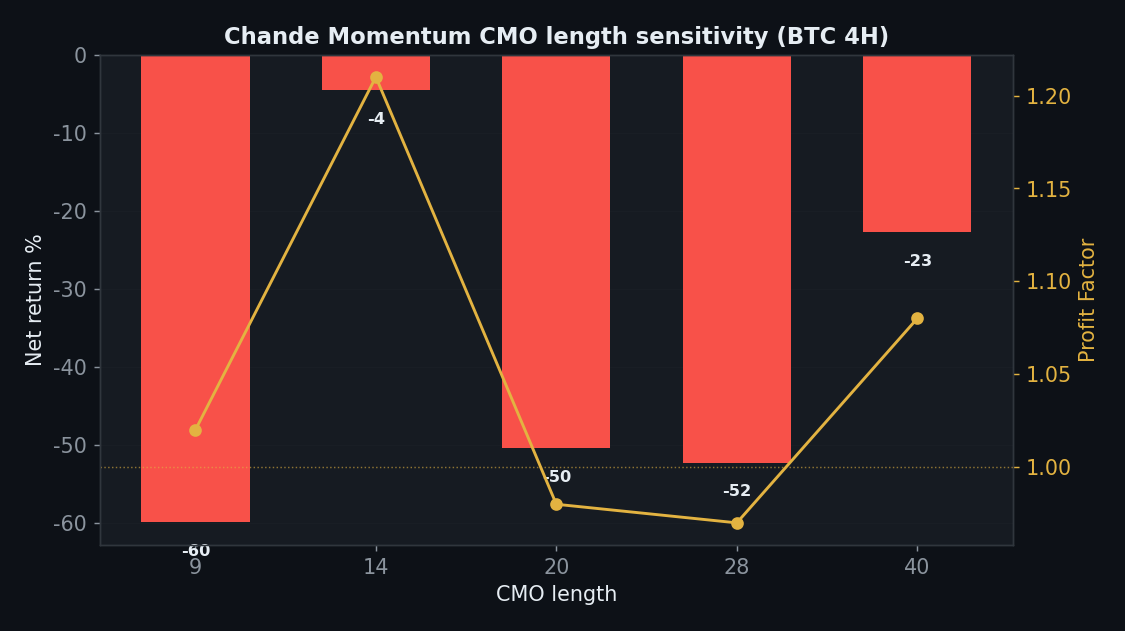
    CMO length Net PF
    9 −60% 1.02
    14 −4% 1.21
    20 −50% 0.98
    28 −52% 0.97
    40 −23% 1.08

    Every period length loses net — including the default 14 (−4.5%). The gross edge exists, but no length converts it to a net profit after the churn.

    Chande Momentum sens_param chart, StrategyVerdict 7-gate backtest

    Axis 3 — TP:SL

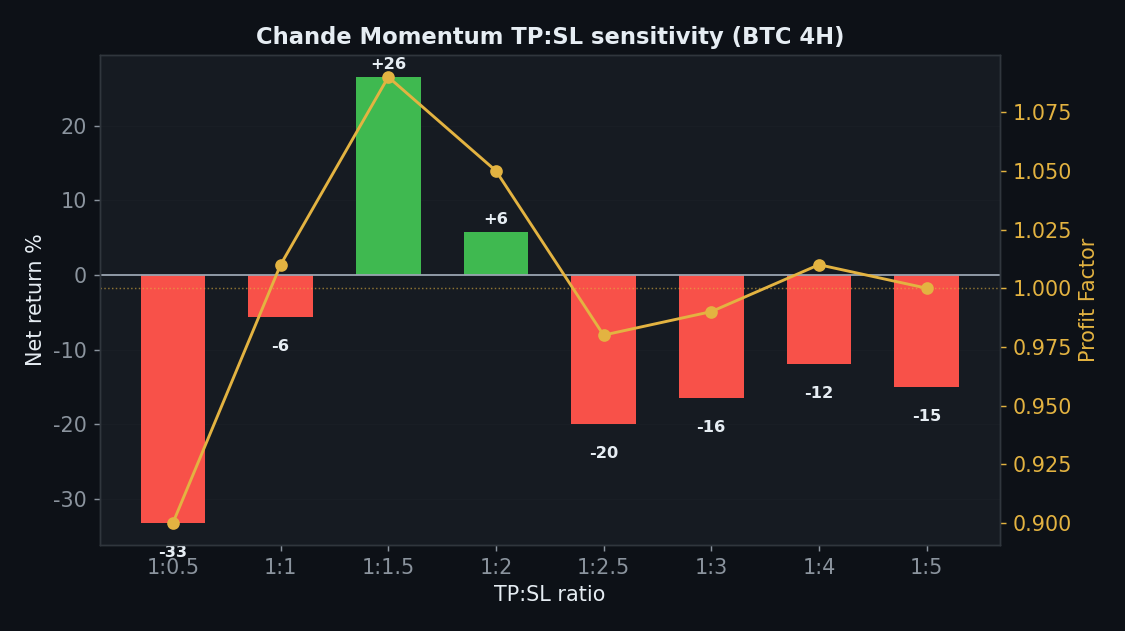
    TP:SL Net PF
    1:0.5 −33% 0.90
    1:1 −6% 1.01
    1:1.5 +26% 1.09
    1:2 +6% 1.05
    1:2.5 −20% 0.98
    1:3 −16% 0.99
    1:4 −12% 1.01
    1:5 −15% 1.00

    Only 2 of 8 TP:SL ratios are positive. Some exits help a little, but not enough to overcome the turnover.

    Chande Momentum sens_tpsl chart, StrategyVerdict 7-gate backtest

    Axis 4 — Five Coins

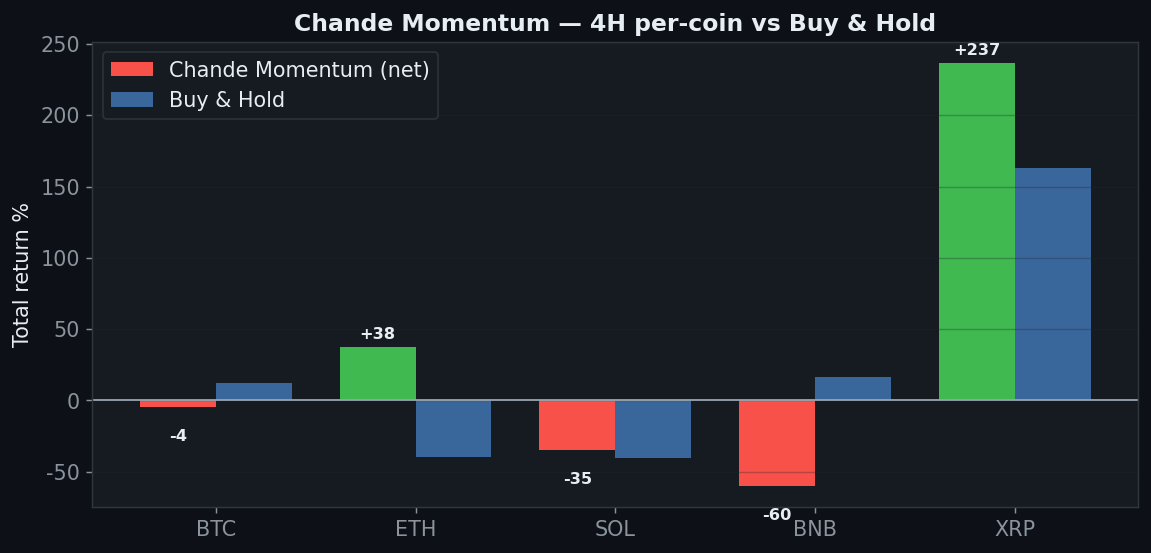
    Coin Strategy net Buy & Hold
    BTC −4% +12%
    ETH +38% −40%
    SOL −35% −40%
    BNB −60% +17%
    XRP +237% +163%

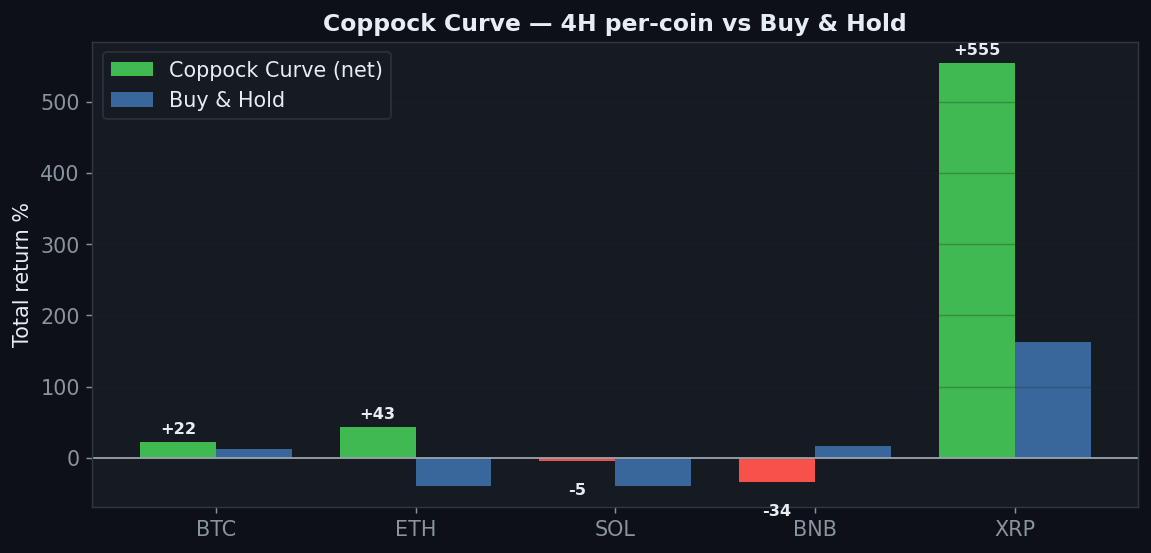
    2 of 5 positive (ETH +38%, XRP +237%), but BTC, SOL and BNB lose. As usual the wins concentrate in the big trenders.

    Chande Momentum coins chart, StrategyVerdict 7-gate backtest

    Axis 5 — Yearly

    Year BTC 4H net
    2024 +80%
    2025 −51%
    2026 +9%

    2024 huge (+80%), 2025 −51%, 2026 +9%. Extreme regime dependence with a brutal chop year.

    Axis 6 — Friction

    Chande Momentum friction chart, StrategyVerdict 7-gate backtest

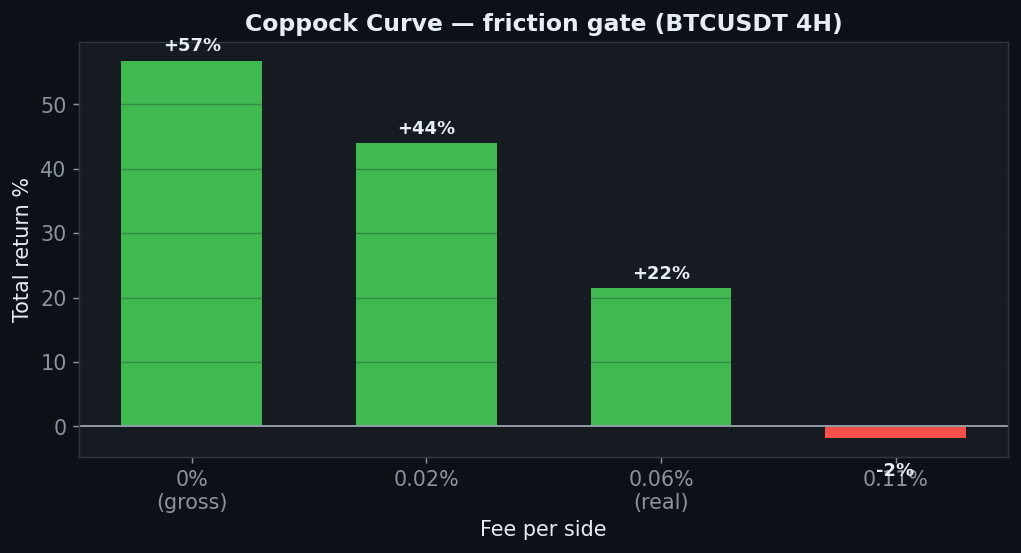
    This is the whole story: +83% gross → −4.5% at the real 0.06% → −45% at 0.11%. 542 trades convert one of the largest gross edges in the series into a net loss.

    The Verdict: REJECT

    • Gate 0 — Indicator fidelitypass (standard CMO(14))
    • Gate 1 — Sanitypass
    • Gate 2 — Frictionfail — +83% gross collapses to −4.5% net; churn wins
    • Gate 3 — Yearlyfail — +80 / −51 / +9
    • Gate 4 — Robustness (length)fail — 0 of 5 lengths net-positive
    • Gate 5 — Robustness (TP:SL)fail — 2 of 8 positive
    • Gate 6 — Multi-marketfail — 2 of 5 coins
    • Gate 7 — vs Buy & Holdfail — 4H net negative, loses to holding

    Chande’s Momentum Oscillator has one of the biggest gross edges in this whole series (+83% on BTC 4H) — and 542 trades of churn turn it into a −4.5% net loss. Every period length loses after fees. Like SSL and CMF, it’s a friction casualty: a real signal you cannot trade because the turnover eats it. Reject.

    FAQ

    If the gross edge is +83%, can’t I just trade fewer signals?
    Only with a filter that cuts turnover without killing the edge — a different, unproven system. As taught (flip on every zero-cross), 542 trades erase it, and every length we tested lands net-negative.

    The daily is +59% though.
    On one timeframe, while every period length loses net on the 4H and 3 of 5 coins lose. One good timeframe doesn’t offset a signal that fails its friction and robustness gates.

    Can I replicate this?
    Yes — CMO(14) zero-cross, public Binance data, 0.06%/side, five coins, nine timeframes. Every table reproduces.

    See also the fellow friction casualties SSL Channel and Chaikin Money Flow, and the conditional Vortex.


    Disclaimer: educational research, not financial advice. Past performance does not guarantee future results. Never trade money you cannot afford to lose.
  • Chaikin Money Flow Strategy Backtest: Volume Doesn’t Save the Zero-Cross

    Chaikin Money Flow Strategy Backtest: Volume Doesn’t Save the Zero-Cross

    Chaikin Money Flow adds a volume dimension to momentum — the promise is that ‘smart money’ accumulation shows up before price. We ran the standard CMF(20) zero-cross through the 7-Gate Protocol to see whether volume adds a real edge. Verdict: reject.

    Methodology

    • Data: Binance spot, Jul 2024–Jul 2026 (2 years), BTC/ETH/SOL/BNB/XRP
    • Timeframes: 5m–1D (9 buckets, incl. resampled)
    • Execution: CMF sums volume weighted by where each close lands in its range, over 20 bars. Long when CMF is above zero (accumulation), short below (distribution). Closed-bar, no look-ahead
    • Friction: 0.06%/side (real); 0-fee gross reported too. Benchmark: buy & hold
    • Six axes: timeframe, cmf length, TP:SL, multi-coin, yearly, out-of-sample

    Gate 0 — Fidelity

    CMF sums volume weighted by where each close lands in its range, over 20 bars. Long when CMF is above zero (accumulation), short below (distribution). Reproduced exactly (pass).

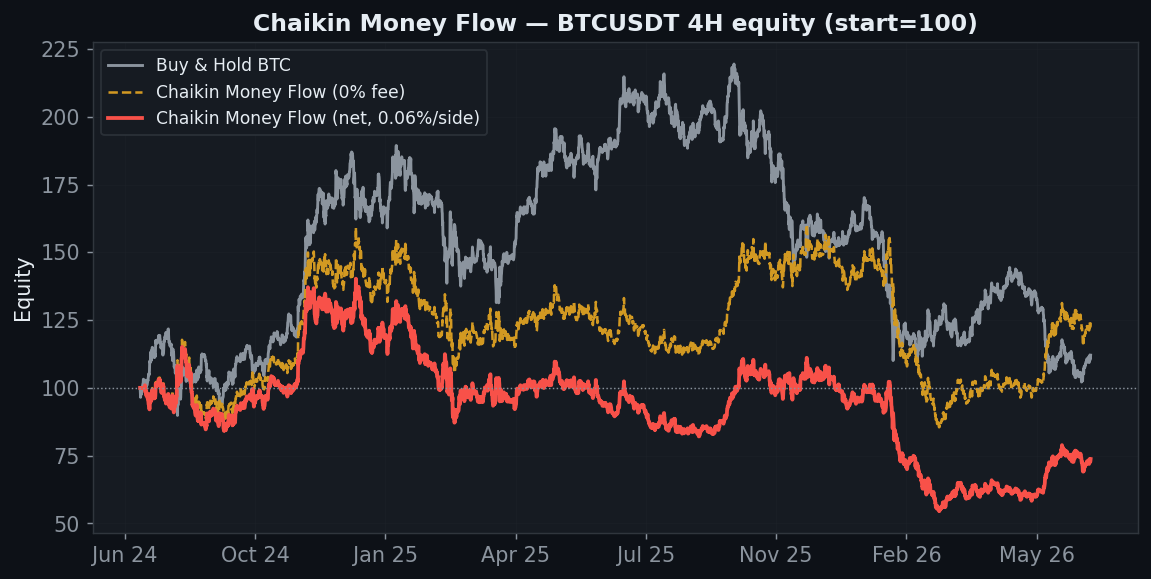
    Chaikin Money Flow equity chart, StrategyVerdict 7-gate backtest

    How It Behaves

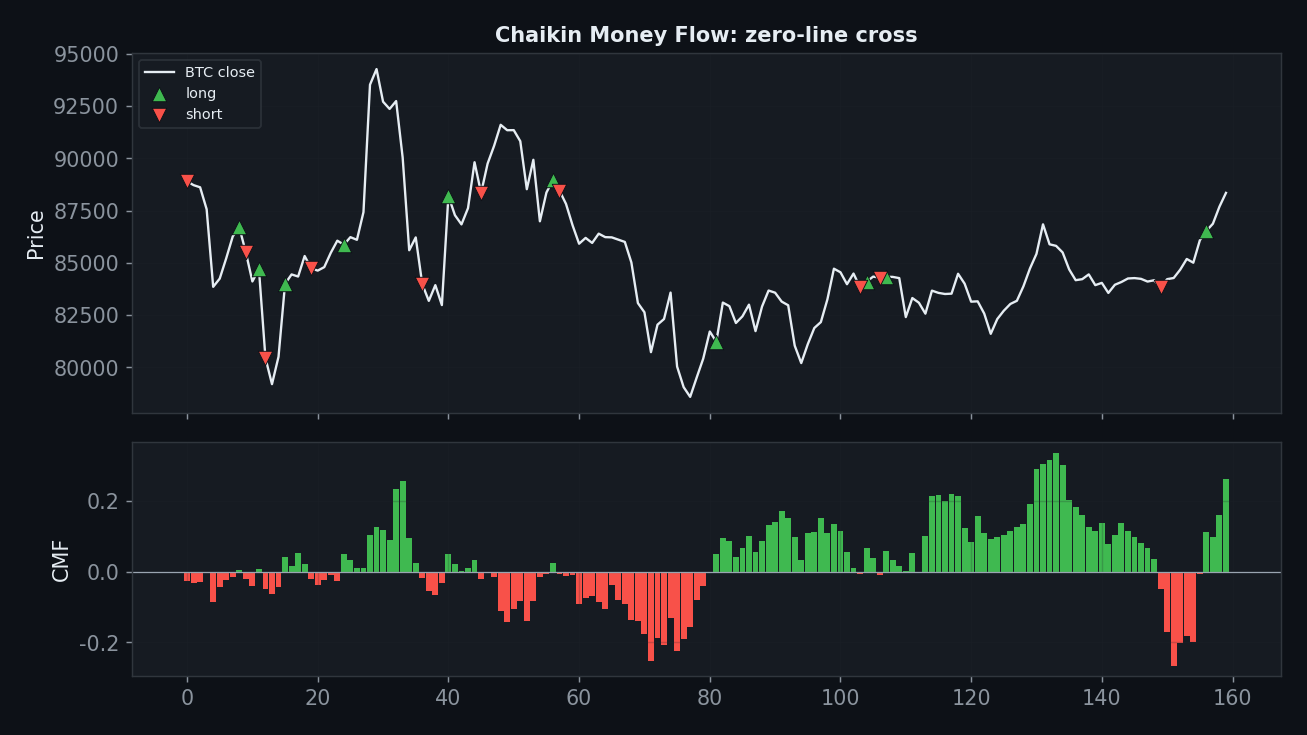
    Chaikin Money Flow sig chart, StrategyVerdict 7-gate backtest

    CMF is a zero-line oscillator, and zero-line crosses whipsaw in ranges just like price-based ones — the volume weighting doesn’t change that. It flips 434 times on the 4H, turning a small gross figure into a real loss.

    Axis 1 — Timeframe

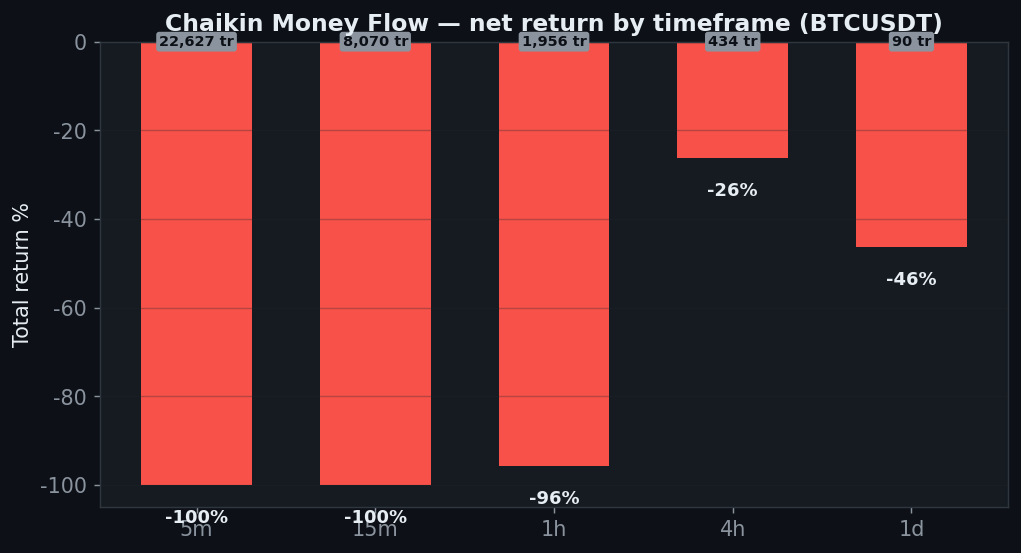
    Timeframe Trades Gross (0 fee) Net (real)
    5분 22,627 −81% −100%
    15분 8,070 −84% −100%
    30분 4,004 −79% −100%
    1시간 1,956 −55% −96%
    2시간 1,064 −71% −92%
    4시간 434 +24% −26%
    6시간 322 −52% −67%
    12시간 178 −67% −73%
    1일 90 −40% −46%

    Not one timeframe is positive. The 4H loses 26% net (and the daily 46%), so the volume signal doesn’t carry a directional edge on any horizon.

    Chaikin Money Flow tf chart, StrategyVerdict 7-gate backtest

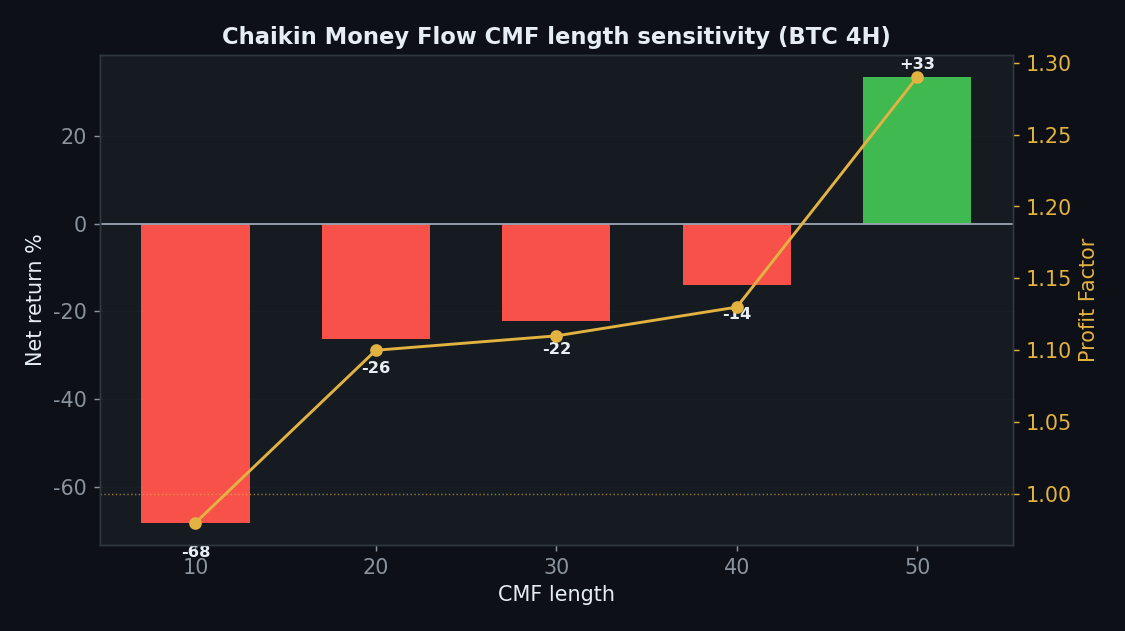
    Axis 2 — CMF length

    CMF length Net PF
    10 −68% 0.98
    20 −26% 1.10
    30 −22% 1.11
    40 −14% 1.13
    50 +33% 1.29

    Only the longest length (50) is positive, the shorter ones all lose — a single outlier at the far end, not a robust setting.

    Chaikin Money Flow sens_param chart, StrategyVerdict 7-gate backtest

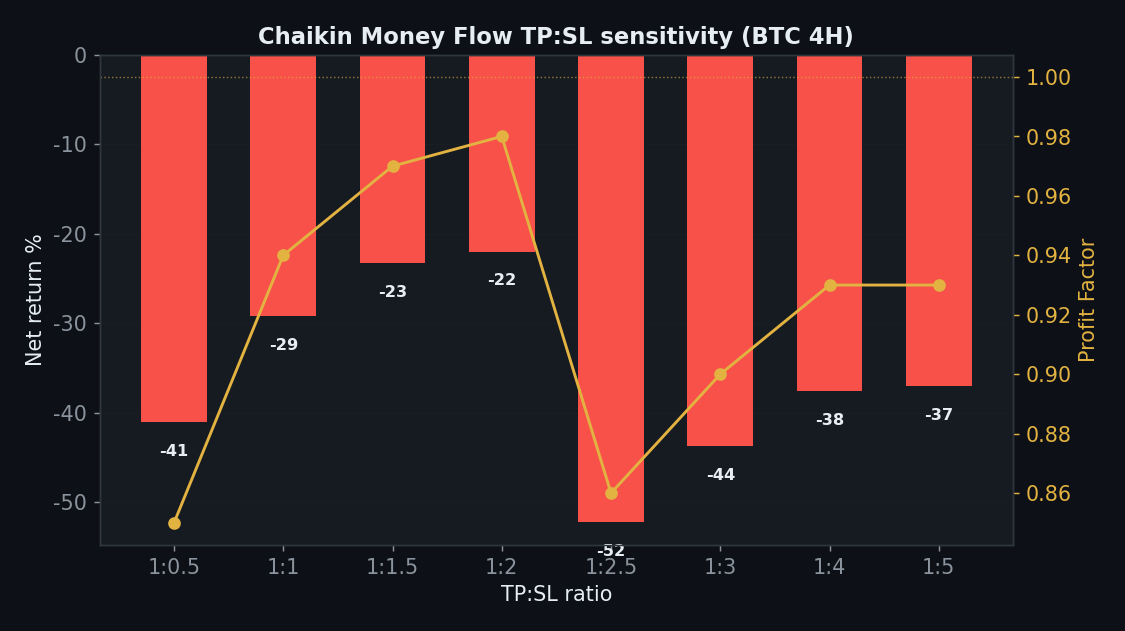
    Axis 3 — TP:SL

    TP:SL Net PF
    1:0.5 −41% 0.85
    1:1 −29% 0.94
    1:1.5 −23% 0.97
    1:2 −22% 0.98
    1:2.5 −52% 0.86
    1:3 −44% 0.90
    1:4 −38% 0.93
    1:5 −37% 0.93

    All eight TP:SL ratios lose. With no gross edge worth protecting, no exit scheme helps.

    Chaikin Money Flow sens_tpsl chart, StrategyVerdict 7-gate backtest

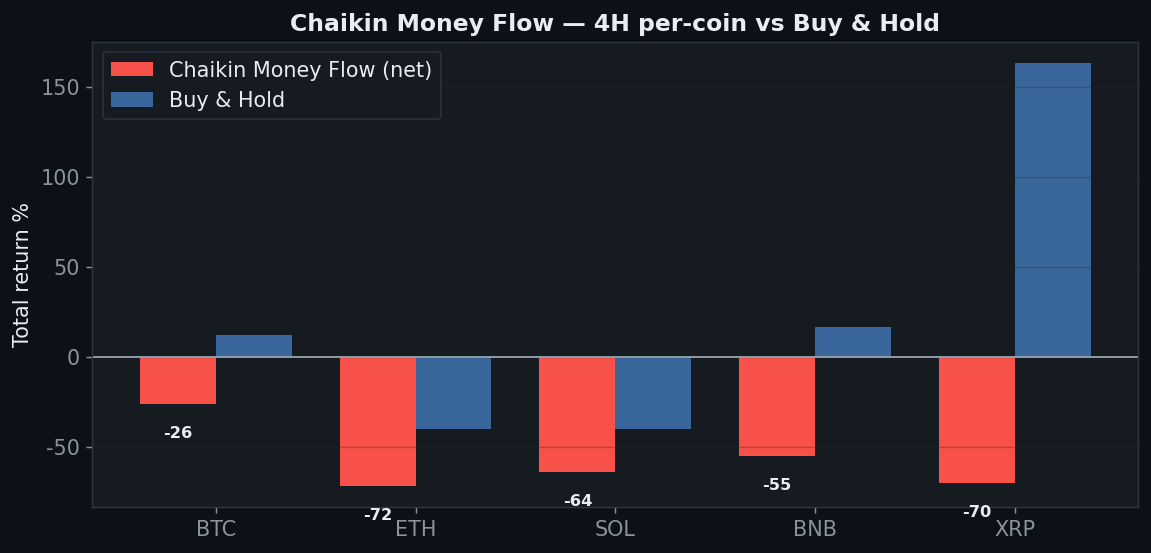
    Axis 4 — Five Coins

    Coin Strategy net Buy & Hold
    BTC −26% +12%
    ETH −72% −40%
    SOL −64% −40%
    BNB −55% +17%
    XRP −70% +163%

    0 of 5 coins positive. CMF loses on every market, including the ones that trended hard — missing XRP’s +163% entirely (−70%). Volume didn’t help pick direction anywhere.

    Chaikin Money Flow coins chart, StrategyVerdict 7-gate backtest

    Axis 5 — Yearly

    Year BTC 4H net
    2024 +14%
    2025 −17%
    2026 −21%

    2024 +14%, then 2025 (−17%) and 2026 (−21%) both lost. Net-negative and fading.

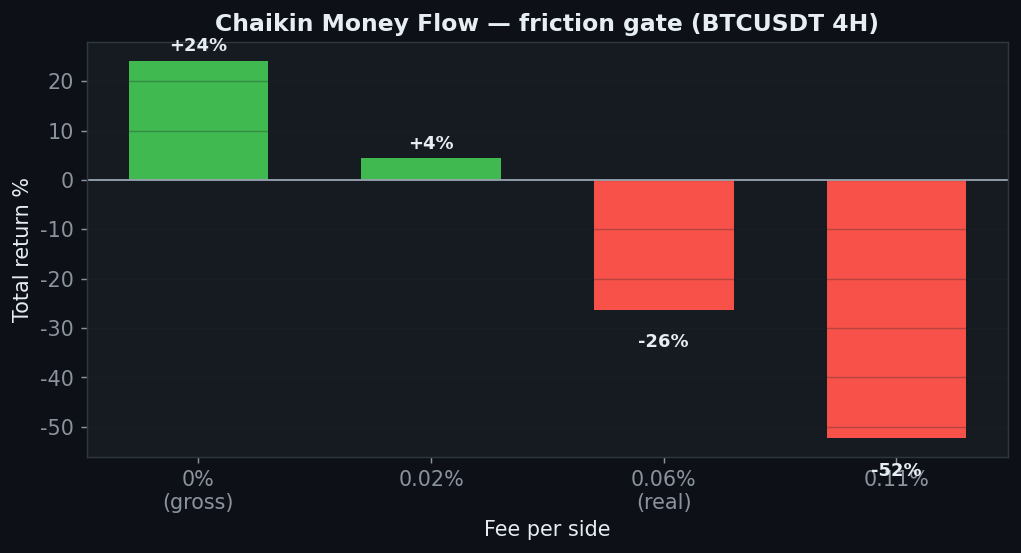
    Axis 6 — Friction

    Chaikin Money Flow friction chart, StrategyVerdict 7-gate backtest

    +24% gross → −26% net → −52% at 0.11%. 434 trades of churn convert a small gross number into a clear loss.

    The Verdict: REJECT

    • Gate 0 — Indicator fidelitypass (standard CMF(20))
    • Gate 1 — Sanitypass
    • Gate 2 — Frictionfail — +24% gross, −26% net on 4H
    • Gate 3 — Yearlyfail — +14 / −17 / −21
    • Gate 4 — Robustness (length)fail — only 1 of 5 positive
    • Gate 5 — Robustness (TP:SL)fail — 0 of 8 positive
    • Gate 6 — Multi-marketfail — 0 of 5 coins
    • Gate 7 — vs Buy & Holdfail — negative on every timeframe

    Chaikin Money Flow tests the popular idea that volume reveals direction before price. It doesn’t — not as a zero-cross. CMF is net-negative on every timeframe, loses on all 5 coins, and every TP:SL ratio loses. The volume weighting adds nothing a plain zero-cross oscillator didn’t already fail at. Reject.

    FAQ

    Isn’t volume supposed to lead price?
    That’s the theory, and it’s appealing. But as a mechanical zero-cross the volume weighting produces the same whipsaw as any oscillator, with no directional payoff on any timeframe or coin here.

    Would CMF work as a filter instead?
    Possibly as a confirmation layer on another entry — a different, unproven system. The standalone zero-cross we tested fails outright.

    Can I replicate this?
    Yes — CMF(20) zero-cross, public Binance data, 0.06%/side, five coins, nine timeframes. Every table reproduces.

    See also the rejects Awesome Oscillator and Hull MA, and the conditional Vortex.


    Disclaimer: educational research, not financial advice. Past performance does not guarantee future results. Never trade money you cannot afford to lose.
  • QQE Indicator Strategy Backtest: 5-of-5 Coins Positive, Yet It Loses to Buy & Hold

    QQE Indicator Strategy Backtest: 5-of-5 Coins Positive, Yet It Loses to Buy & Hold

    QQE is a favourite of crypto ‘free signal’ channels — a smoothed-RSI trailing system that fires clean-looking long/short arrows. We ran the standard QQE(14) through the 7-Gate Protocol. Verdict: reject.

    Methodology

    • Data: Binance spot, Jul 2024–Jul 2026 (2 years), BTC/ETH/SOL/BNB/XRP
    • Timeframes: 5m–1D (9 buckets, incl. resampled)
    • Execution: QQE smooths RSI, then wraps it in an ATR-of-RSI trailing line. Long when the smoothed RSI is above the trailing line, short when below. Closed-bar, no look-ahead
    • Friction: 0.06%/side (real); 0-fee gross reported too. Benchmark: buy & hold
    • Six axes: timeframe, rsi length, TP:SL, multi-coin, yearly, out-of-sample

    Gate 0 — Fidelity

    QQE smooths RSI, then wraps it in an ATR-of-RSI trailing line. Long when the smoothed RSI is above the trailing line, short when below. Reproduced exactly (pass).

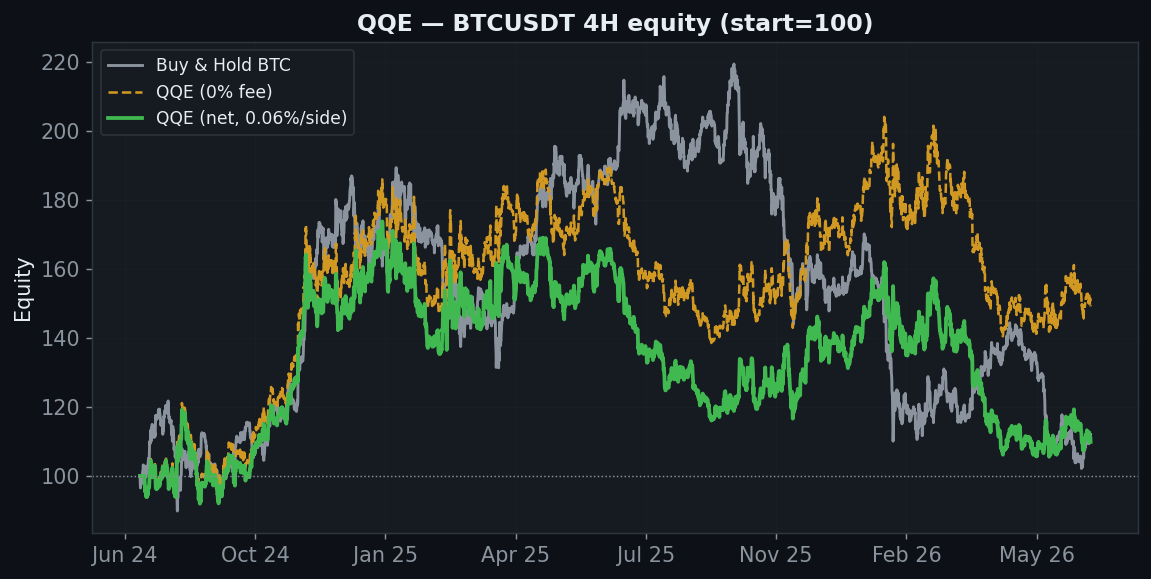
    QQE equity chart, StrategyVerdict 7-gate backtest

    How It Behaves

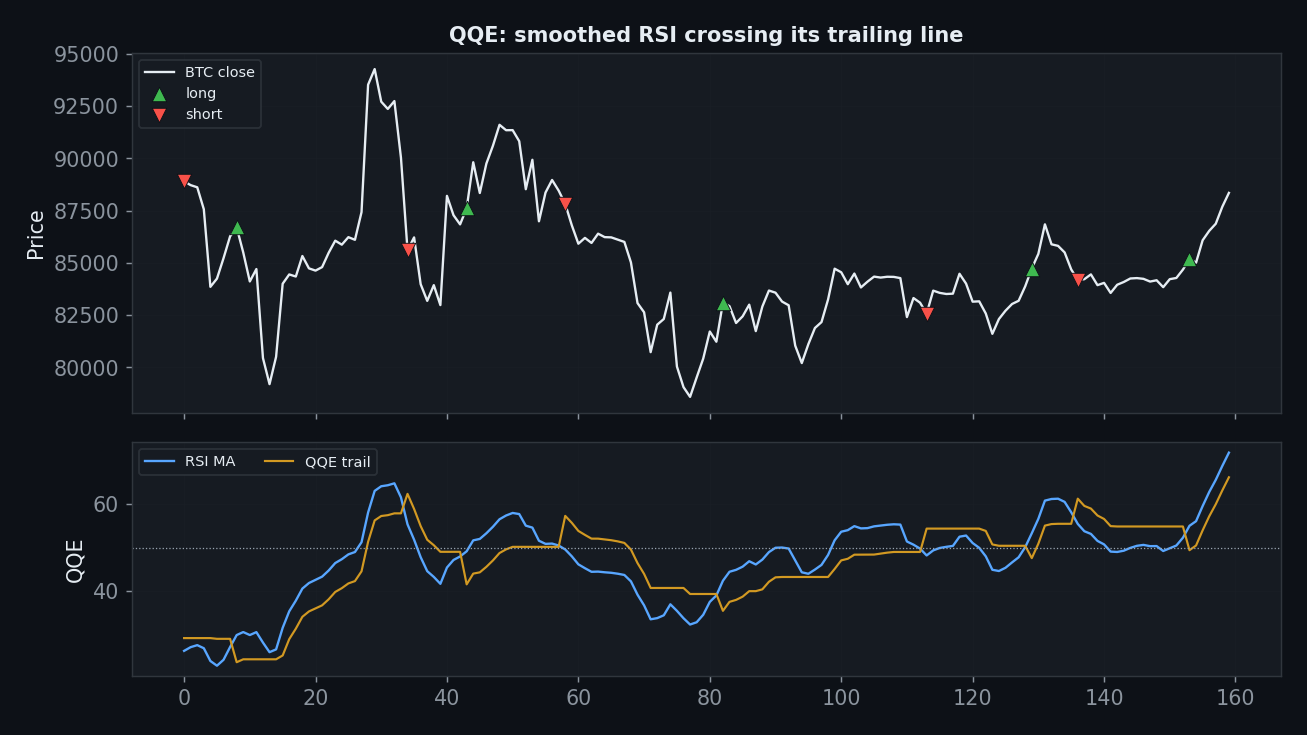
    QQE sig chart, StrategyVerdict 7-gate backtest

    QQE is essentially a slower, smoothed RSI trend-follower. It holds through trends but, like every oscillator cross, flips during consolidations. On BTC 4H the smoothing keeps trades down (254) but the net still lands just under buy & hold.

    Axis 1 — Timeframe

    Timeframe Trades Gross (0 fee) Net (real)
    5분 12,936 −73% −100%
    15분 4,225 −49% −100%
    30분 2,053 −17% −93%
    1시간 1,057 −66% −91%
    2시간 525 −52% −75%
    4시간 254 +49% +10%
    6시간 169 +28% +4%
    12시간 86 +16% +5%
    1일 45 −19% −23%

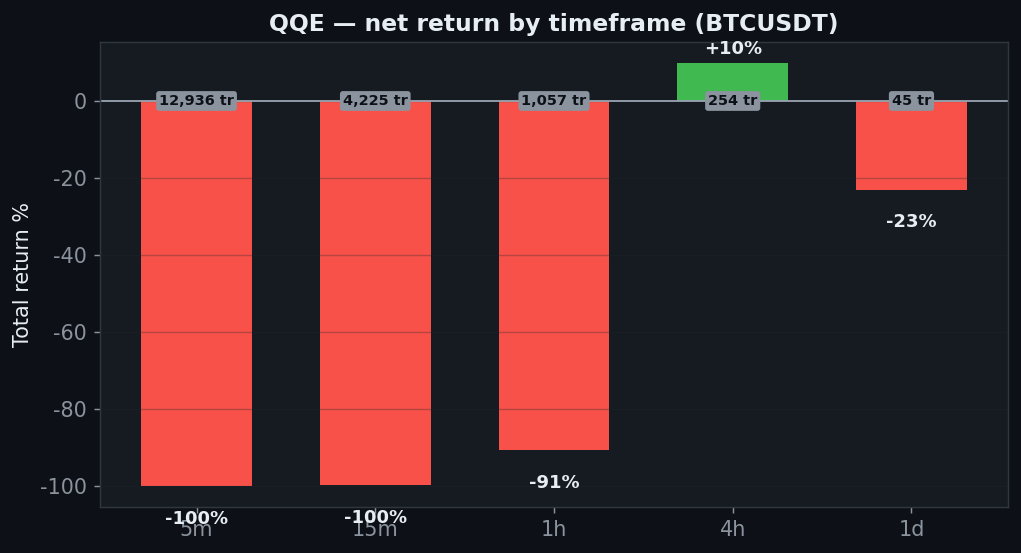
    Only the 4H is positive (+10% net), and it sits just under buy & hold’s +12%. The daily loses 23%. One barely-positive timeframe is not an edge.

    QQE tf chart, StrategyVerdict 7-gate backtest

    Axis 2 — RSI length

    RSI length Net PF
    8 +28% 1.23
    14 +10% 1.18
    21 −19% 1.09
    28 −38% 0.97
    35 −40% 0.96

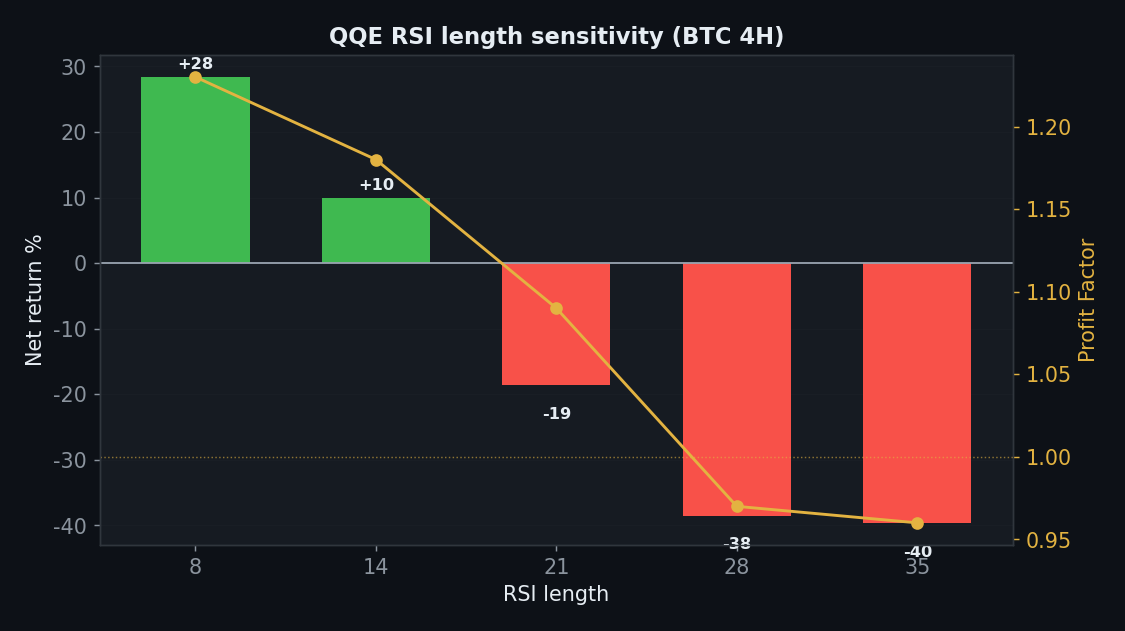
    Only the short RSI lengths (8, 14) work; 21, 28 and 35 all lose. The taught default sits at the edge of the working zone, and the profit falls off a cliff just past it.

    QQE sens_param chart, StrategyVerdict 7-gate backtest

    Axis 3 — TP:SL

    TP:SL Net PF
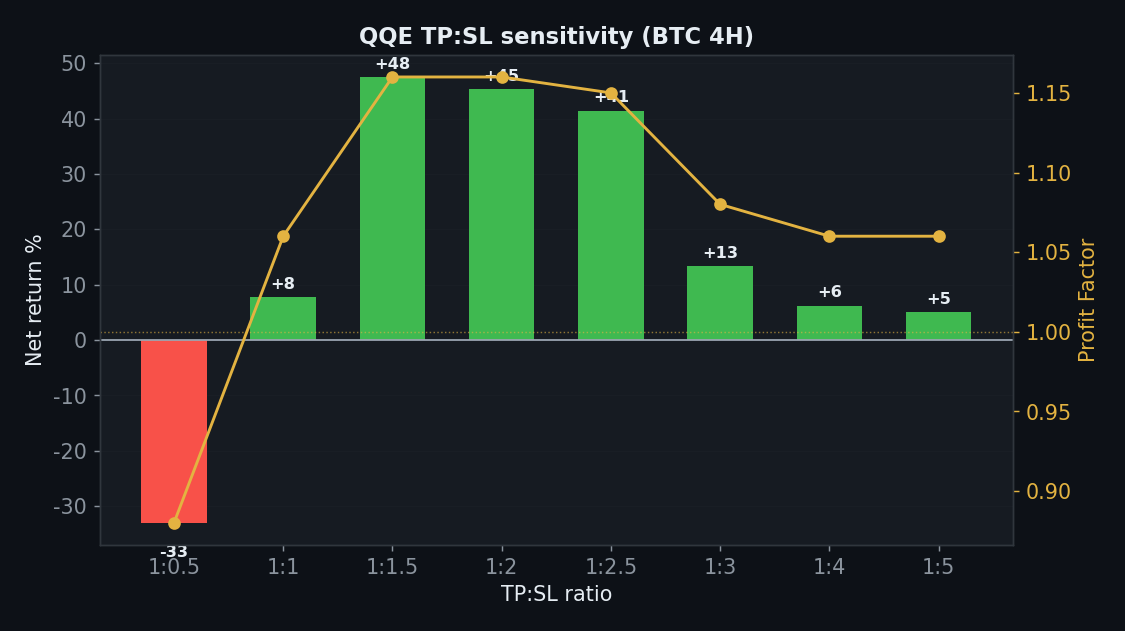
    1:0.5 −33% 0.88
    1:1 +8% 1.06
    1:1.5 +48% 1.16
    1:2 +45% 1.16
    1:2.5 +41% 1.15
    1:3 +13% 1.08
    1:4 +6% 1.06
    1:5 +5% 1.06

    7 of 8 take-profit ratios are positive — the one genuinely robust axis. But a good exit bolted onto a base that underperforms holding doesn’t create an edge.

    QQE sens_tpsl chart, StrategyVerdict 7-gate backtest

    Axis 4 — Five Coins

    Coin Strategy net Buy & Hold
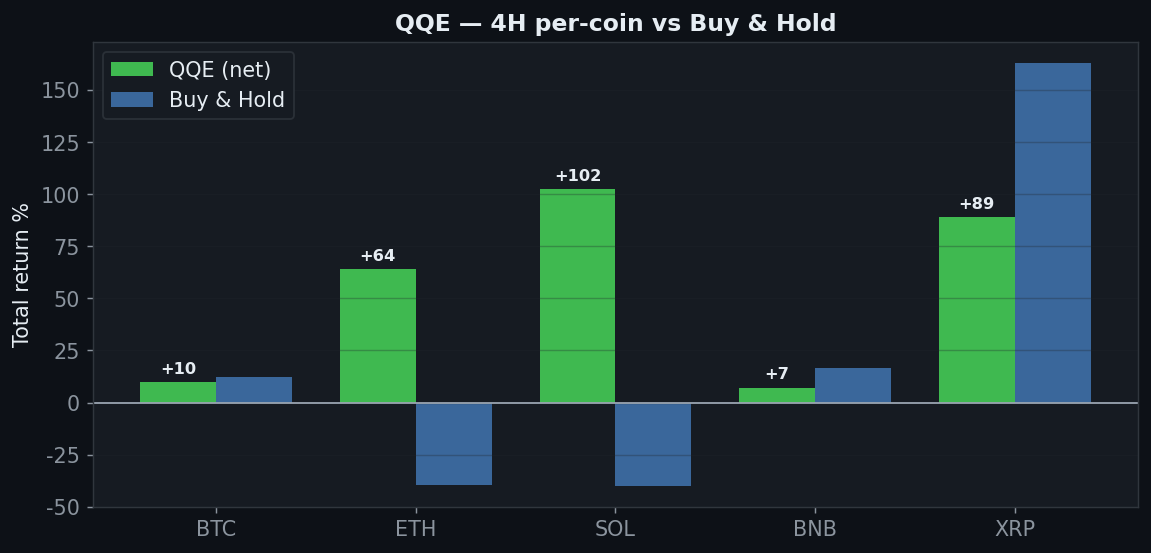
    BTC +10% +12%
    ETH +64% −40%
    SOL +102% −40%
    BNB +7% +17%
    XRP +89% +163%

    Here’s the trap. All 5 coins are ‘positive’, but look closer: on BTC (+10% vs +12%), BNB (+7% vs +17%) and XRP (+89% vs +163%) QQE loses to buy & hold. Its only outperformance is ETH and SOL — both of which fell 40%, so QQE ‘won’ by shorting their downtrends. Versus the benchmark, it beats holding on exactly the two coins that dropped.

    QQE coins chart, StrategyVerdict 7-gate backtest

    Axis 5 — Yearly

    Year BTC 4H net
    2024 +57%
    2025 −15%
    2026 −18%

    2024 carried it (+57%); 2025 (−15%) and 2026 (−18%) both lost. A single good year fading into two losers.

    Axis 6 — Friction

    QQE friction chart, StrategyVerdict 7-gate backtest

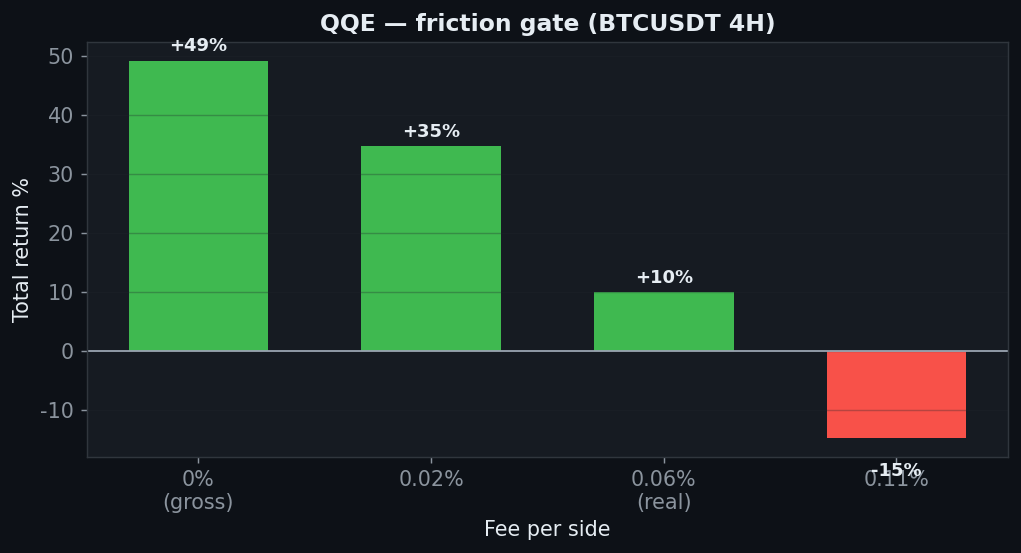
    +49% gross → +10% net → −15% at 0.11%. The 254 trades make it churn-sensitive; the edge is gone on a higher-fee venue.

    The Verdict: REJECT

    • Gate 0 — Indicator fidelitypass (standard QQE(14))
    • Gate 1 — Sanitypass
    • Gate 2 — Frictionconditional — 4H survives to +10%, but only there and it dies at 0.11%
    • Gate 3 — Yearlyfail — +57 / −15 / −18
    • Gate 4 — Robustness (period)fail — only 8 and 14 positive
    • Gate 5 — Robustness (TP:SL)pass — 7 of 8 positive
    • Gate 6 — Multi-marketfail vs benchmark — 5/5 ‘positive’ but beats hold only on the two coins that fell (shorting)
    • Gate 7 — vs Buy & Holdfail — 4H +10% loses to +12%; daily loses

    QQE looks great on the coin table — 5 of 5 positive — until you compare it to the benchmark: it beats buy & hold only on ETH and SOL, the two coins that dropped 40%, by shorting them. On BTC, BNB and XRP it underperforms holding, the daily loses, and only the default period works. The ‘positive everywhere’ headline is shorting-downtrends luck, not an edge that beats holding. Reject.

    FAQ

    But it’s positive on all five coins — isn’t that robust?
    Positive isn’t the bar; beating buy & hold is. QQE only outperforms holding on the two coins that fell (by shorting), and loses to holding on the three that rose. That’s the opposite of a robust long-biased edge.

    The signals look so clean on the chart.
    Smoothed RSI produces tidy-looking arrows, which is why these channels love it. Measured forward, the 4H merely ties holding and every other timeframe loses.

    Can I replicate this?
    Yes — QQE(14), public Binance data, 0.06%/side, five coins, nine timeframes. Every table reproduces.

    See also the conditional passes Vortex and TRIX, and the rejects Keltner and Awesome Oscillator.


    Disclaimer: educational research, not financial advice. Past performance does not guarantee future results. Never trade money you cannot afford to lose.
  • CCI Strategy Backtest: the +/-100 Breakout That Buys the Spike Top (0/5 Out-of-Sample)

    CCI Strategy Backtest: the +/-100 Breakout That Buys the Spike Top (0/5 Out-of-Sample)

    The Commodity Channel Index, built by Donald Lambert in 1980, is one of the most popular momentum oscillators on every charting platform. The rule taught everywhere is the ±100 breakout: when CCI pushes above +100, momentum is “strong” — go long; when it drops below −100, go short. It feels intuitive: buy strength, sell weakness. But there’s a catch baked into the idea, and the out-of-sample test exposes it brutally. We ran the CCI(20) ±100 breakout through the 7-Gate Protocol across six axes. Verdict: reject.

    Methodology

    • Data: Binance spot, Jul 2024–Jul 2026 (2 years), BTC/ETH/SOL/BNB/XRP
    • Timeframes: 5m–1D (9 buckets, incl. resampled)
    • Execution: CCI(20) on the closed bar, no look-ahead; long on cross above +100, short on cross below −100
    • Friction: 0.06%/side (real); 0-fee gross reported too. Benchmark: buy & hold
    • Six axes: timeframe, threshold, TP:SL, multi-coin, yearly, out-of-sample

    Gate 0 — Fidelity

    Standard CCI(20): (typical price − its 20-period SMA) / (0.015 × mean deviation), where typical price = (H+L+C)/3. Long when CCI crosses above +100, short when it crosses below −100. Reproduced exactly (pass).

    The Exact Rules

    • Signal: CCI crosses above +100 → long; crosses below −100 → short (stop-and-reverse, hold in between)
    • Default: period 20, threshold ±100
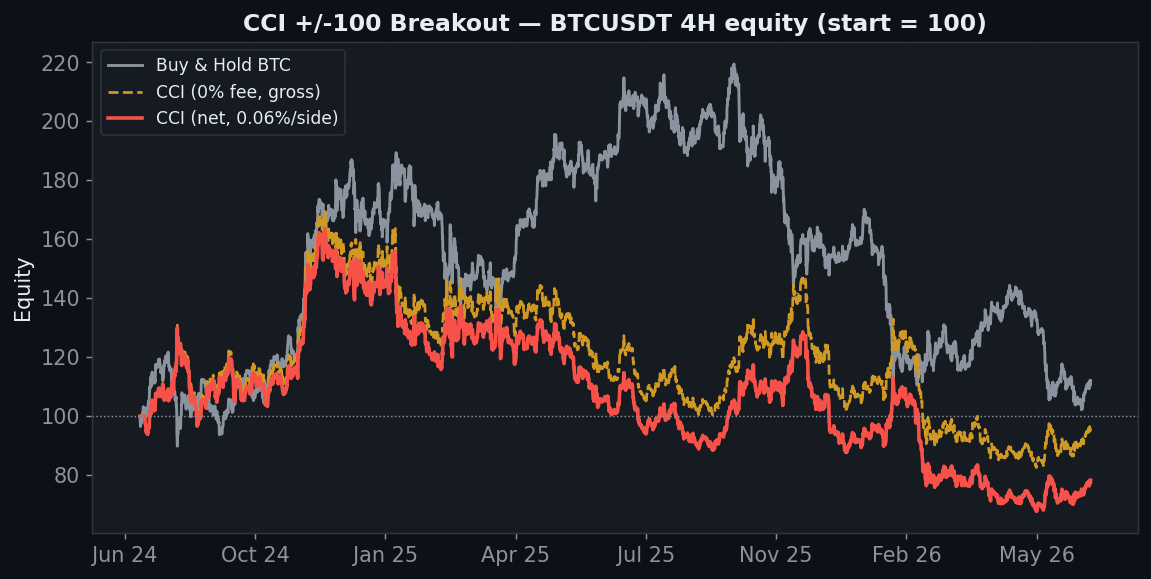
    CCI plus minus 100 breakout BTC 4H equity minus 22 percent net, gross minus 4, buy and hold plus 12

    BTC 4H ends at −22% versus buy & hold’s +12%. Even the gross (0-fee) line finishes at −4% — barely any edge to erode. But the deeper problem isn’t the friction gate; it’s what happens the moment you test on data the strategy hasn’t seen.

    Why It Bleeds: Buying the Spike Top

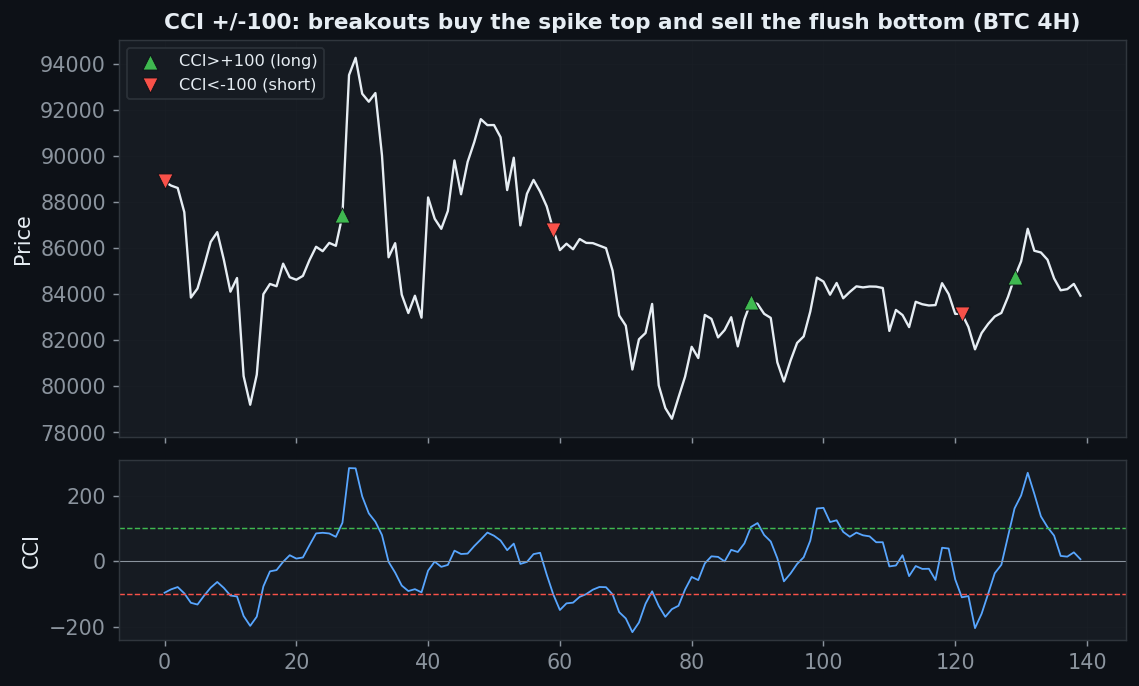
    CCI plus minus 100 breakout buys spike tops and shorts flush bottoms, 33 percent win rate, price and CCI panel

    Look at where the entries land. CCI crosses +100 after a sharp push — which in crypto is very often the exhaustion of the move, not its start. So the breakout buys the top of the spike and shorts the bottom of the flush, then reverses. A 33% win rate is the arithmetic of systematically entering extremes just as they’re about to snap back. “Buy strength” sounds right, but a +100 reading is frequently the last gasp of strength.

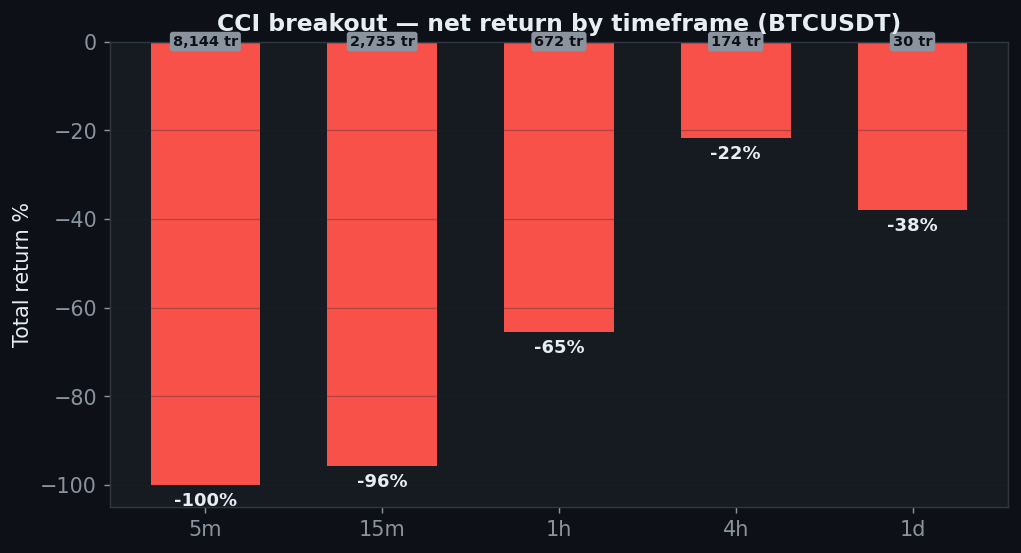
    Axis 1 — Timeframe (gross vs net)

    Timeframe Trades Gross (0 fee) Net (real)
    5m 8,144 −48% −100%
    15m 2,735 +16% −96%
    30m 1,354 +15% −77%
    1h 672 −22% −65%
    2h 324 +6% −28%
    4h 174 −4% −22%
    6h 112 −38% −46%
    12h 44 +55% +47%
    1D 30 −36% −38%

    The five main timeframes are all net-negative. There is one honest bright spot — the 12-hour is +47% net — but it rests on just 44 trades, one timeframe on one coin, and (as the out-of-sample gate shows) doesn’t generalize. A single green cell on a tiny sample is a curiosity, not a system.

    CCI net return by timeframe five main all negative, minus 100 on 5 minute

    Axis 2 — Threshold (parameter)

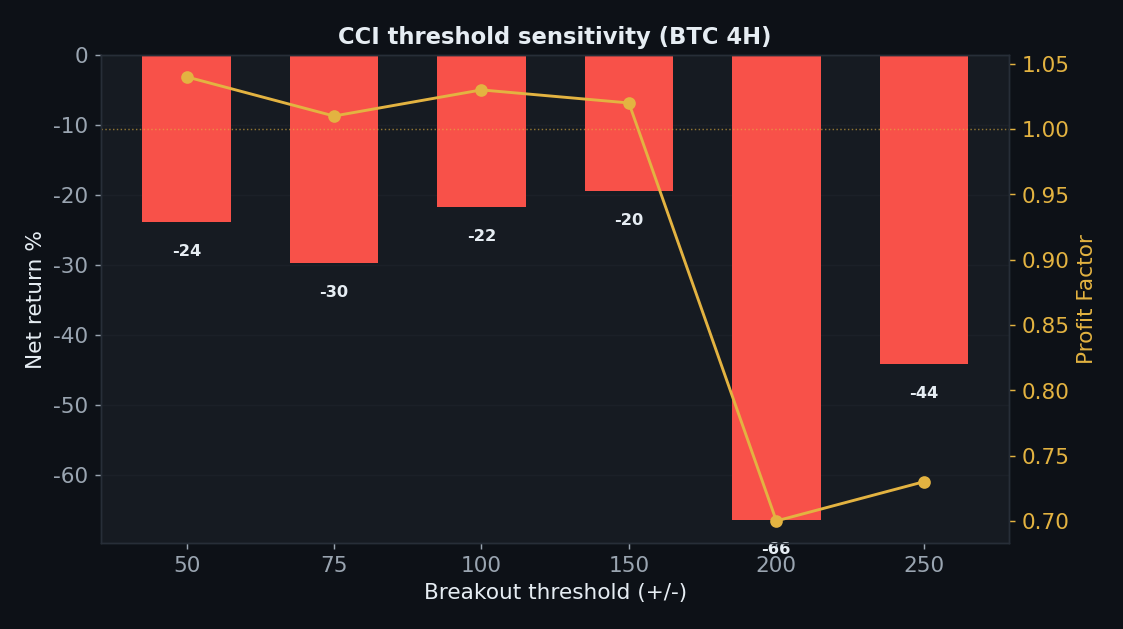
    Maybe ±100 is just the wrong level? We swept the breakout threshold on BTC 4H.

    Threshold (±) Trades Net PF
    50 238 −24% 1.04
    75 202 −30% 1.01
    100 (default) 174 −22% 1.03
    150 108 −20% 1.02
    200 66 −66% 0.70
    250 39 −44% 0.73

    Every threshold loses, and widening it makes things worse (±200 → −66%). There is no “extreme enough” level that turns momentum-breakout entries into an edge on the majors. Nothing to tune.

    CCI threshold sensitivity all negative, wider thresholds worse, nothing to tune

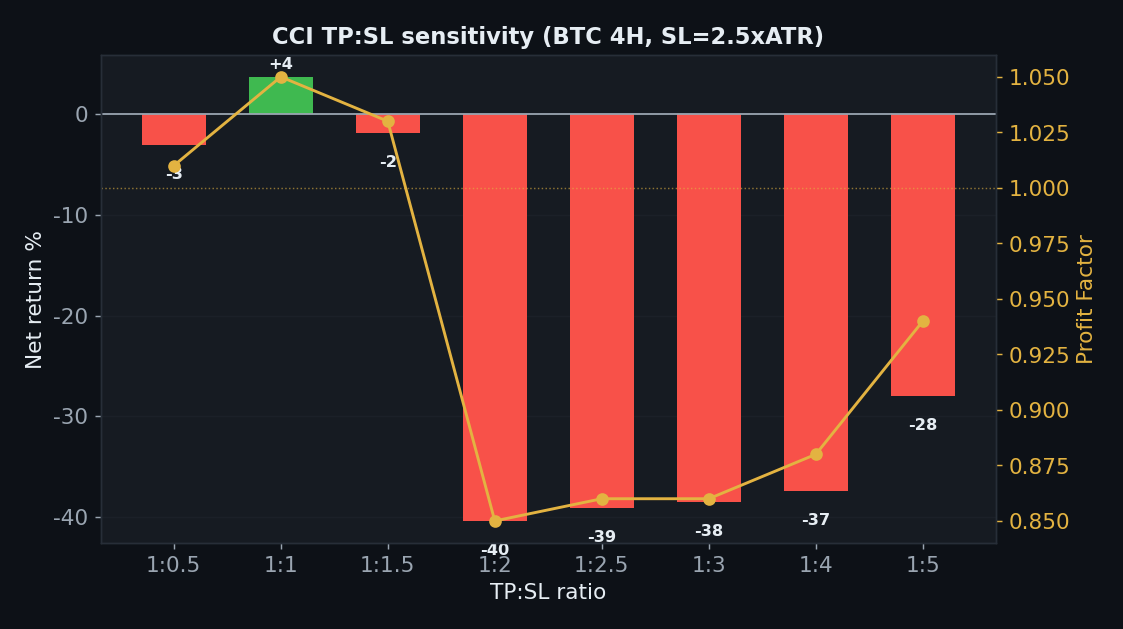
    Axis 3 — TP:SL

    TP:SL Net PF
    1:0.5 −3% 1.01
    1:1 +4% 1.05
    1:1.5 −2% 1.03
    1:2 −40% 0.85
    1:2.5 −39% 0.86
    1:3 −39% 0.86
    1:4 −37% 0.88
    1:5 −28% 0.94

    Only a very tight take-profit (1:1) scrapes +4%; everything from 1:2 upward loses 28–40%. As with the other momentum rejects, the only marginally-positive variant is quick-scalp, not the “ride the breakout” the strategy is sold as — and +4% on one coin isn’t a strategy.

    CCI TP:SL sensitivity only tight 1 to 1 scrapes plus 4 percent, wide targets lose 28 to 40

    Axis 4 — Five Coins

    Coin CCI net Buy & Hold Excess
    BTC −22% +12% −34pp
    ETH −44% −40% −4pp
    SOL −56% −40% −16pp
    BNB −31% +17% −48pp
    XRP +113% +163% −50pp

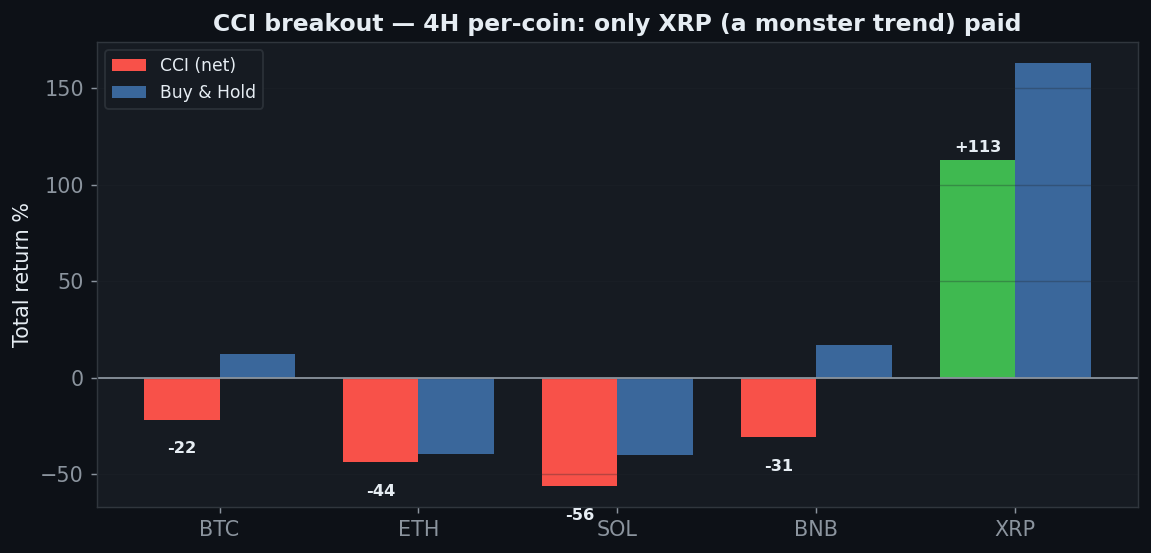
    Only XRP (1 of 5) is net-positive (+113%), and even that trails XRP’s own buy & hold (+163%). The rest lose 22–56%. The single winner is the biggest trender — trend-luck.

    CCI five coins 4H only XRP positive plus 113, BTC minus 22 SOL minus 56

    Axis 5 — Yearly

    Year BTC 4H net
    2024 +38%
    2025 −36%
    2026 (to Jul) −11%

    2024 looks great at +38% — but 2025 (−36%) and 2026 (−11%) are both negative. Two of three years lose. A single good year is exactly the kind of result the next gate is designed to catch.

    Axis 6 — Friction & the Killer Gate: Out-of-Sample

    CCI friction gate minus 4 gross to minus 22 net BTC 4H

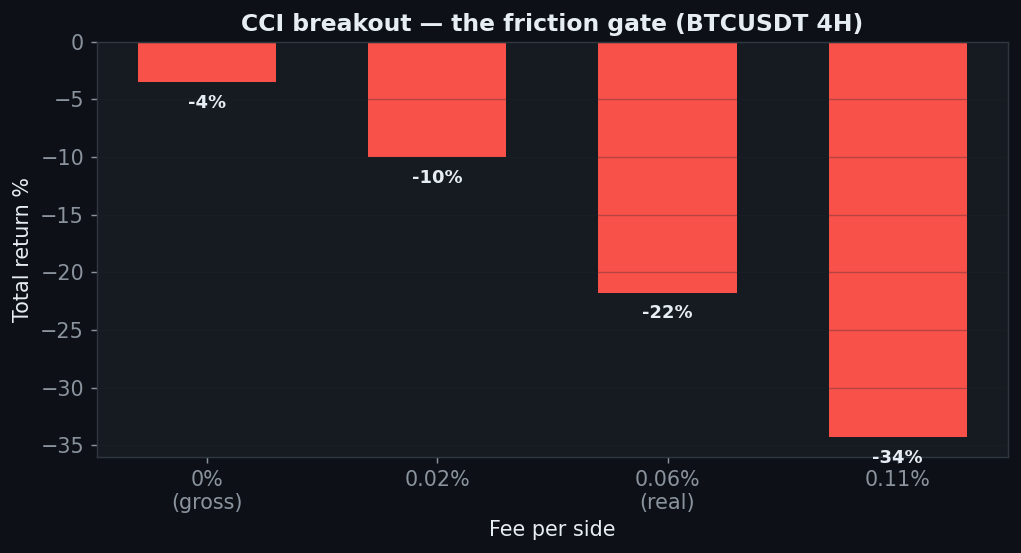
    Friction (BTC 4H): −4% gross → −22% net. But the decisive result is out-of-sample. Train on the first 18 months, test on the last 6, and 0 of 5 coins stay positive out-of-sample — the cleanest failure on this entire site. Whatever looked workable in-sample (2024’s +38%, the 12H, the tight TP) is precisely the memorised past; none of it survives on unseen data.

    The Verdict: REJECT

    • Gate 0 — Indicator fidelitypass (standard CCI(20), ±100 breakout)
    • Gate 1 — Sanitypass (signal on the closed bar, no look-ahead)
    • Gate 2 — Frictionfail (−4% at zero fees on 4H, −22% net; 5m → −100%)
    • Gate 3 — Yearly consistencyfail (2024 +38 / 2025 −36 / 2026 −11 — two of three years lose)
    • Gate 4 — Out-of-samplefail hard (0 of 5 coins positive out-of-sample — nothing generalizes)
    • Gate 5 — Robustnessfail (threshold sweep 0/6; wider thresholds are worse)
    • Gate 6 — Multi-marketfail (1 of 5 coins; only XRP, a monster trender)
    • Gate 7 — vs Buy & Holdfail (5 main timeframes all lose; only a 44-trade 12H sample is positive)

    CCI’s ±100 breakout buys momentum extremes — and in crypto, extremes are usually exhaustion. You enter at the top of the spike, reverse at the bottom of the flush, and win 33% of the time. There are teasing green cells — a +47% 12-hour, a +38% 2024 — but the out-of-sample gate is unforgiving: zero of five coins survive on unseen data, the flattest “this does not generalize” result we’ve measured. As the taught momentum-breakout rule, CCI is a reject.

    FAQ

    You should use CCI for reversion — buy oversold below −100, not breakouts.
    That’s a different, opposite rule, and worth its own test — but “buy the +100 breakout” is what’s most commonly taught as the CCI strategy, so that’s what we measured here. A reversion version would still have to clear the same six gates, out-of-sample included.

    Isn’t the 12-hour actually good (+47%)?
    On 44 trades, one coin, in-sample. The out-of-sample gate (0/5) is the direct rebuttal: results that thin don’t repeat on new data.

    Can I replicate this?
    Yes — CCI(20), ±100 breakout, public Binance data, 0.06%/side, five coins, nine timeframes. Every table reproduces.

    See also: Stochastic, ADX / DMI, Heikin Ashi, RSI 30/70, and the conditional passes VWAP and Ichimoku (daily).


    Disclaimer: educational research, not financial advice. Past performance does not guarantee future results. Never trade money you cannot afford to lose.
  • Stochastic Oscillator Strategy Backtest: The Whipsaw Machine

    Stochastic Oscillator Strategy Backtest: The Whipsaw Machine

    The Stochastic oscillator is on every beginner’s screen, usually with the same rule attached: buy when %K crosses above %D, sell when it crosses below. George Lane popularised it in the 1950s as a way to measure momentum’s speed. Seventy years later the %K/%D crossover is still one of the most-taught mechanical signals in retail trading. It also generates an astonishing number of trades — which turns out to be exactly the problem. We ran the standard 14/3/3 through the 7-Gate Protocol. Verdict: reject.

    Gate 0 — Fidelity

    Standard Stochastic: %K is a 3-period smoothing of where price closed within its 14-bar high–low range; %D is a 3-period average of %K. Buy when %K crosses above %D, sell when it crosses below. Identical to every platform’s default. The only question is what happens when you actually trade the cross.

    The Exact Rules

    • Signal: %K crosses above %D → long; %K crosses below %D → short (stop-and-reverse, always in the market)
    • Settings: 14 / 3 / 3 (the universal default)
    • Execution: on the bar close, no look-ahead; 0.06%/side; Binance spot Jul 2024–Jul 2026; BTC/ETH/SOL/BNB/XRP; 5m–1D; benchmark buy & hold
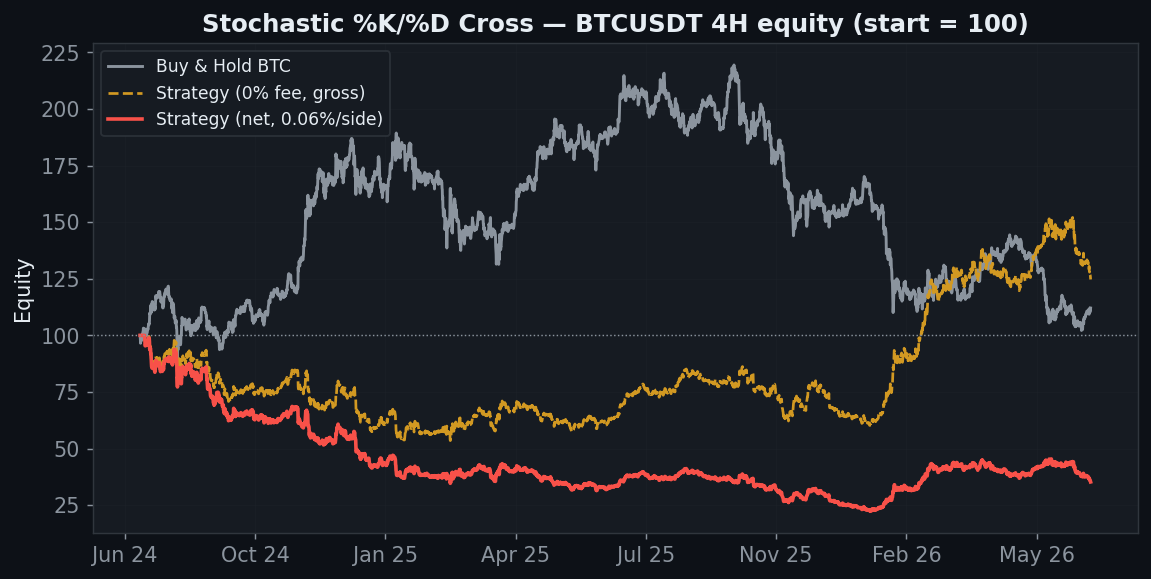
    Stochastic BTC 4H equity, net minus 65 percent while gross zero-fee curve is plus 25 percent, huge friction gap

    BTC 4H ends at −65%. But look at the two strategy lines: the gross (0-fee) curve actually finishes up around +25%, while the net curve craters. That gap is the entire story of this indicator — and it is the widest gap on this whole site.

    Gate 2 — The Most Fee-Sensitive Strategy We’ve Tested

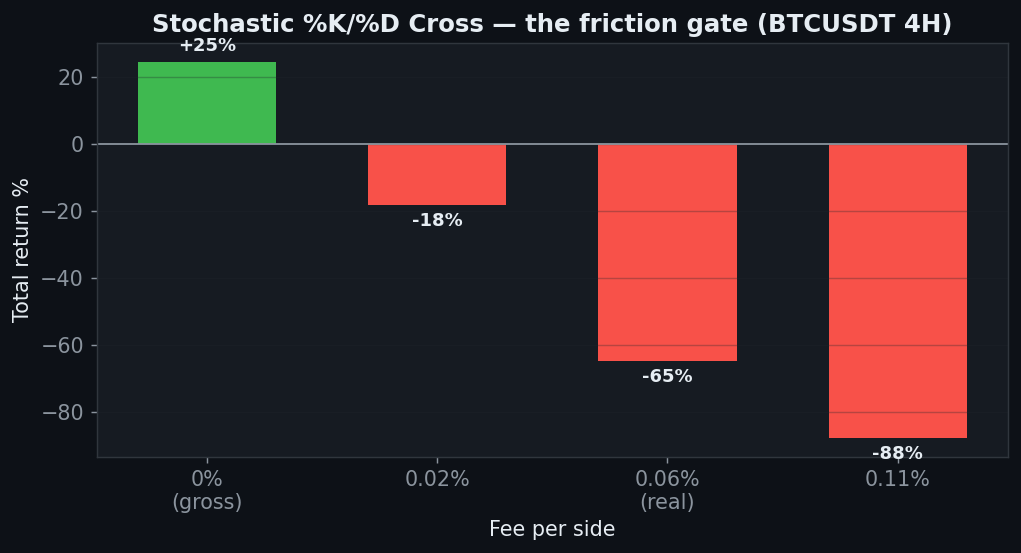
    Stochastic friction gate, plus 25 percent gross becomes minus 65 percent at 0.06 percent fees, most fee sensitive

    At zero fees, BTC 4H makes +25%. Add a gentle 0.02%/side and it drops to −18%. At a realistic 0.06% it is −65%. At 0.11% it is −88%. There is a faint gross edge in the crossover — but harvesting it requires so many trades that the toll dwarfs the prize several times over. No strategy we’ve examined loses more of its gross return to friction than this one.

    Gate 6 — The Whipsaw Machine

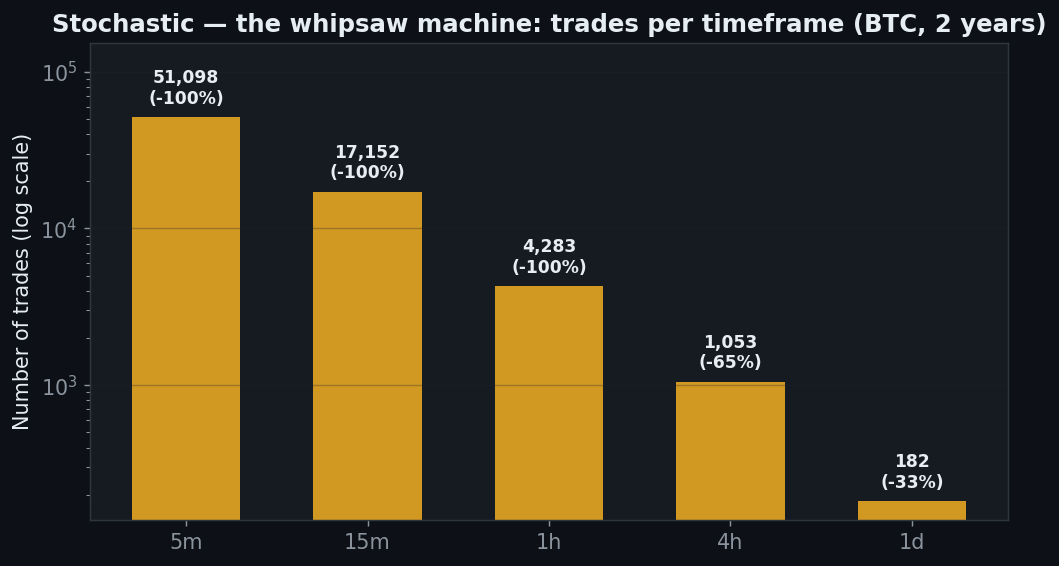
    Stochastic whipsaw machine, 51098 trades on 5 minute over two years, trade count explodes on fast timeframes all minus 100

    Why so fee-sensitive? Because %K and %D cross constantly. On BTC 5m the crossover takes 51,098 trades in two years — and the account goes to −100%. 15m: 17,152 trades, −100%. 1h: 4,283, −100%. Even the 4H, the slowest liquid timeframe, is 1,053 trades. Every one of those round-trips pays a fee. Stochastic doesn’t lose because it’s wrong more often than right — it loses because it trades so much that being 40% right at a 0.06% toll is a guaranteed bleed.

    Gate 6b — Five Coins, and a Green Cell That Lies

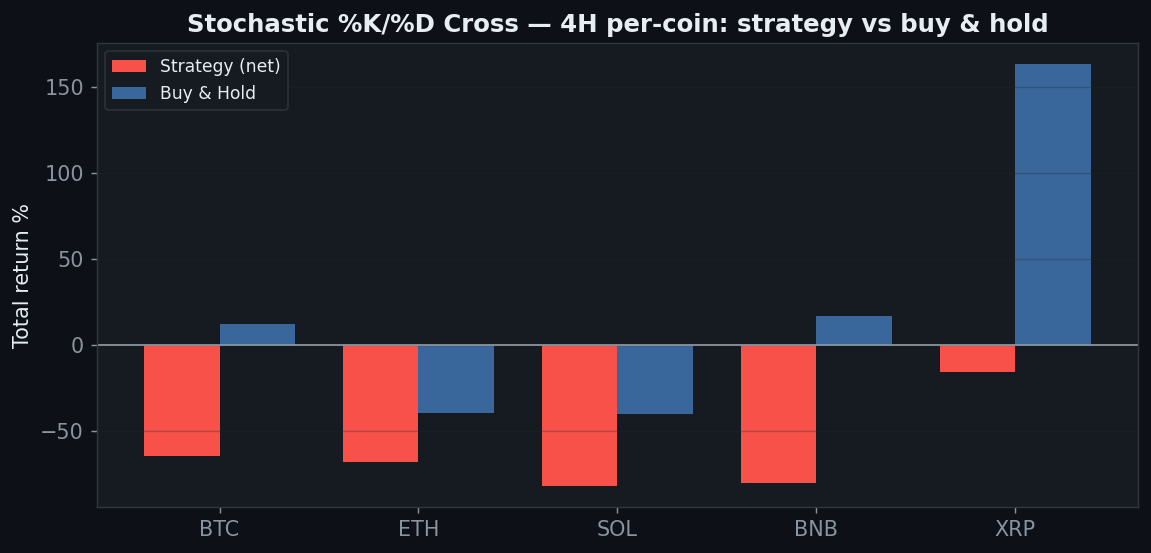
    Stochastic five coins 4H all negative, zero of five positive

    On 4H, all five coins lose — BTC −65%, ETH −68%, SOL −82%, BNB −80%, XRP −16%. Zero of five. Now, one gate does flash green in the raw data: the out-of-sample split shows 5/5 coins positive over the final six months. Do not be fooled by it. That is a few dozen trades in one short window, sitting at the tail end of a run that lost 65–82% per coin. A brief green patch after a multi-year wipeout is the definition of small-sample noise. It is precisely why we weight full-sample behaviour and friction above a single lucky window — and why we report it rather than cherry-pick it.

    The Verdict: REJECT

    • Gate 0 — Indicator fidelitypass (standard 14/3/3 %K/%D)
    • Gate 1 — Sanitypass (signal on the closed bar, no look-ahead)
    • Gate 2 — Frictionfail (a +25% gross edge on 4H collapses to −65% net — the most fee-sensitive strategy on this site)
    • Gate 3 — Yearly consistencyfail (negative on every timeframe overall)
    • Gate 4 — Out-of-samplefail (noise) (the lone green gate — 5/5 over the last 6 months — is a few-dozen-trade window after a 65–82% loss, not an edge)
    • Gate 5 — Robustnessfail (0 of 6 %K × %D-smoothing cells positive)
    • Gate 6 — Multi-marketfail (0 of 5 coins positive on 4H)
    • Gate 7 — vs Buy & Holdfail (0 of 5 timeframes beat holding)

    The Stochastic crossover is a machine for converting your capital into exchange fees. There is a whisper of a gross edge in the signal, but the crossover fires so relentlessly — tens of thousands of times on fast charts — that friction buries it many times over. Being right 40% of the time is fine if you trade 20 times; it is fatal if you trade 20,000. Stochastic is a reasonable way to read momentum. As a mechanical trade trigger, it is the clearest over-trading autopsy we have.

    FAQ

    You should only take crosses in oversold/overbought zones.
    That’s a filter, and a fair idea — but it’s a different strategy, and “add conditions until the curve turns up” is how over-fitting happens. We tested the crossover that’s actually taught first. A zone-filtered version has to clear the same seven gates, friction included.

    Isn’t the daily better?
    Less catastrophic, not good: the daily is −33% and still loses to holding. Fewer trades means less fee bleed, but the underlying signal still doesn’t predict.

    Can I replicate this?
    Yes — Stochastic(14,3,3), public Binance data, 0.06%/side, %K/%D cross, five coins, five timeframes.

    See also: RSI 30/70, RSI Divergence, MACD crossover, Parabolic SAR, and the conditional passes VWAP and Ichimoku (daily).


    Disclaimer: educational research, not financial advice. Past performance does not guarantee future results. Never trade money you cannot afford to lose.
  • RSI Divergence Strategy Backtest: Prediction, or Hindsight?

    RSI Divergence Strategy Backtest: Prediction, or Hindsight?

    Divergence is the RSI setup that traders swear by: price makes a lower low, but the RSI makes a higher low, and — supposedly — the reversal is coming. It is sold as a leading, predictive signal, the thing that lets you buy the exact bottom. But there is a problem hiding in plain sight: you can only draw a divergence after the second pivot has formed and confirmed. By then the low is already in the past. So is divergence a prediction, or a description of something that already happened? We built the mechanical version — pivot-confirmed RSI(14) divergence — and ran it through the 7-Gate Protocol. Verdict: reject.

    Gate 0 — Fidelity

    Standard Wilder RSI(14). A pivot low is a bar lower than the five bars on each side of it; a pivot high is the mirror. Bullish divergence = price prints a lower pivot low while RSI prints a higher one → go long. Bearish divergence = higher price pivot high with a lower RSI high → go short. This is the textbook definition, mechanised exactly.

    The Exact Rules

    • Signal: confirmed bullish divergence → long; confirmed bearish divergence → short (stop-and-reverse)
    • Pivots: 5 bars left / 5 bars right, RSI period 14
    • The catch: a pivot is only confirmed 5 bars after it forms — so every entry is, by construction, at least 5 bars late. No look-ahead: we act on the confirmation bar’s close.
    • Execution: 0.06%/side; Binance spot Jul 2024–Jul 2026; BTC/ETH/SOL/BNB/XRP; 5m–1D; benchmark buy & hold
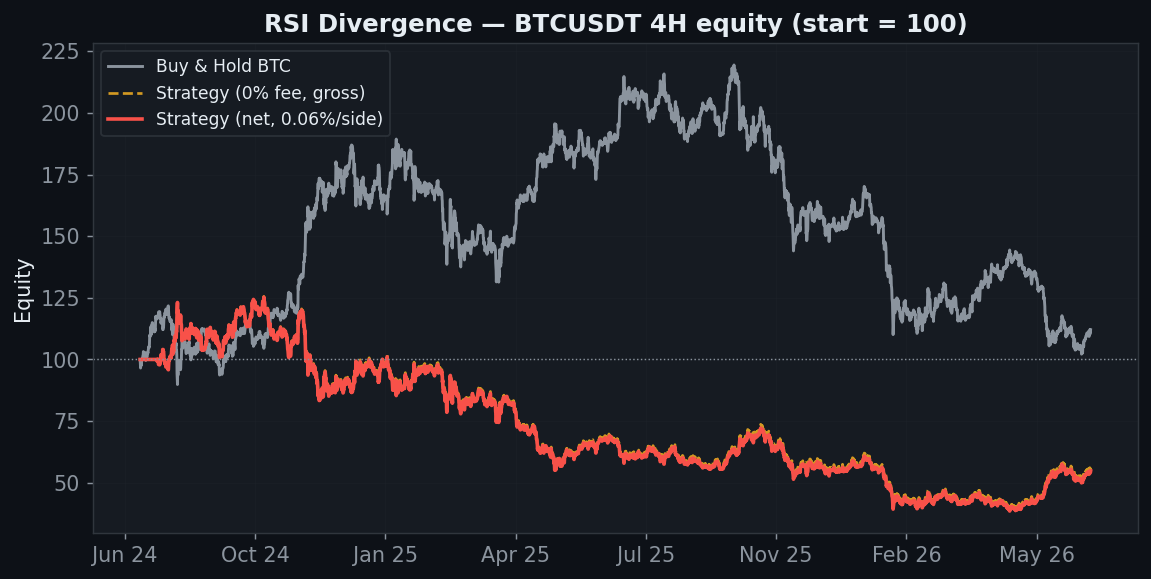
    RSI divergence BTC 4H equity curve declines to minus 45 percent versus buy and hold, gross and net nearly identical

    On BTC 4H the curve grinds down to −45% while buy & hold sits around +12%. Note the gross (0-fee) line barely differs — this isn’t a fee problem, there simply isn’t an edge to erode.

    Gate 6 — The Signal-Scarcity Trap

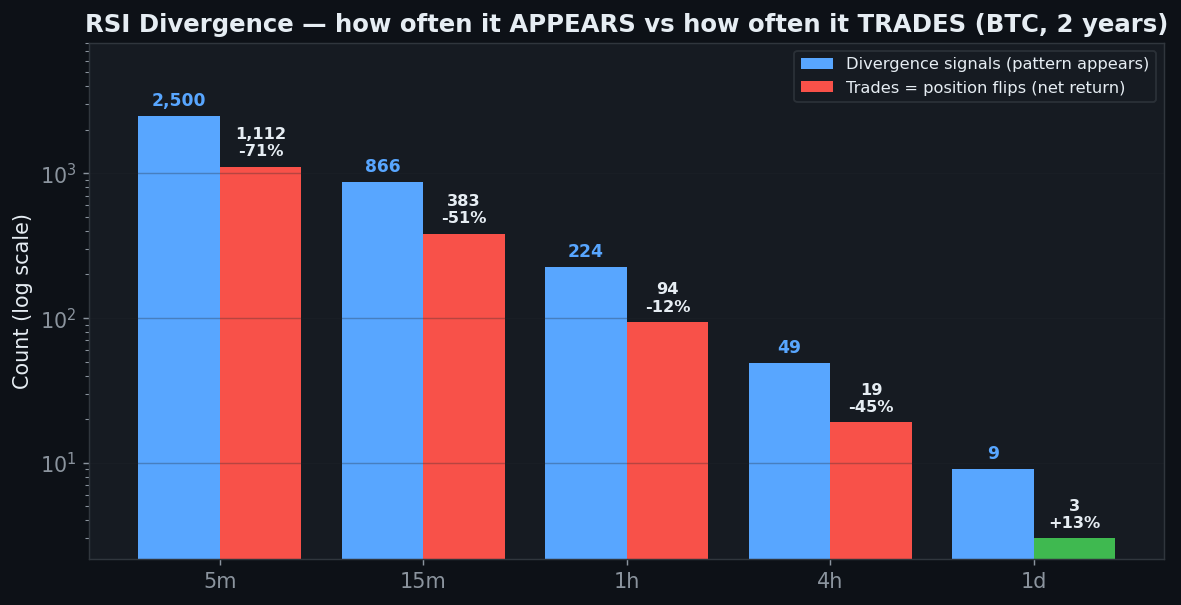
    RSI divergence signals versus trades by timeframe over two years: 4H 49 signals and 19 trades, daily 9 signals and 3 trades, fast timeframes many trades all losing

    Here is the heart of the matter — and first, two numbers that are easy to conflate. The divergence pattern itself appears 49 times on the 4H (23 bullish, 26 bearish) and 9 times on the daily over two years. But this is stop-and-reverse: a signal flips you and you hold until the opposite signal fires, so repeated same-side divergences don’t add trades. That’s why the actual trade count is 19 on the 4H and 3 on the daily (blue = signals, red/green = trades, above). Either way the sample on the high timeframes is thin. The 4H shows the pattern 49 times and still loses 45%; push to faster charts for more signals and you get whipsawed (5m: 1,112 trades, −71%). And the one green result — the daily +12.6% — rests on 9 signals and just three trades. A profit factor of 34.9 on three trades is not an edge; it is a coin landing heads twice. There is no timeframe where divergence is both frequent enough to trust and profitable.

    Gate 6b — Five Coins

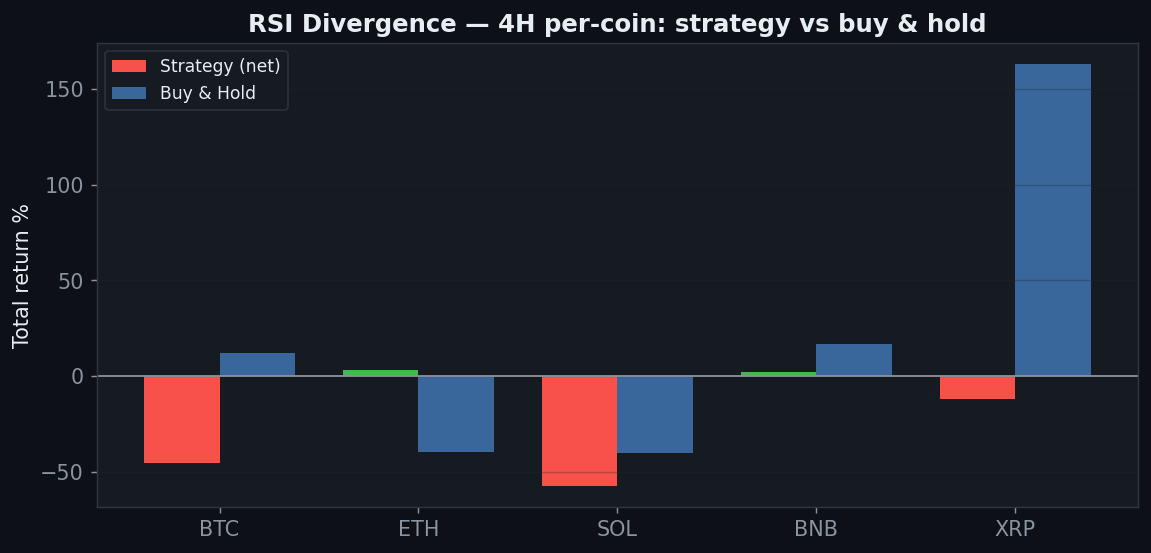
    RSI divergence five coins 4H, only ETH and BNB barely positive, SOL minus 57 percent

    On 4H, two of five coins scrape a positive result — ETH +3.1% and BNB +2.2% — and three bleed, with SOL at −57%. “Two of five, by two percent” is what a strategy with no real edge looks like when you spin the wheel five times: some land green by luck. It does not beat buy & hold on any of them where holding was up.

    Gate 2 — Friction & Robustness

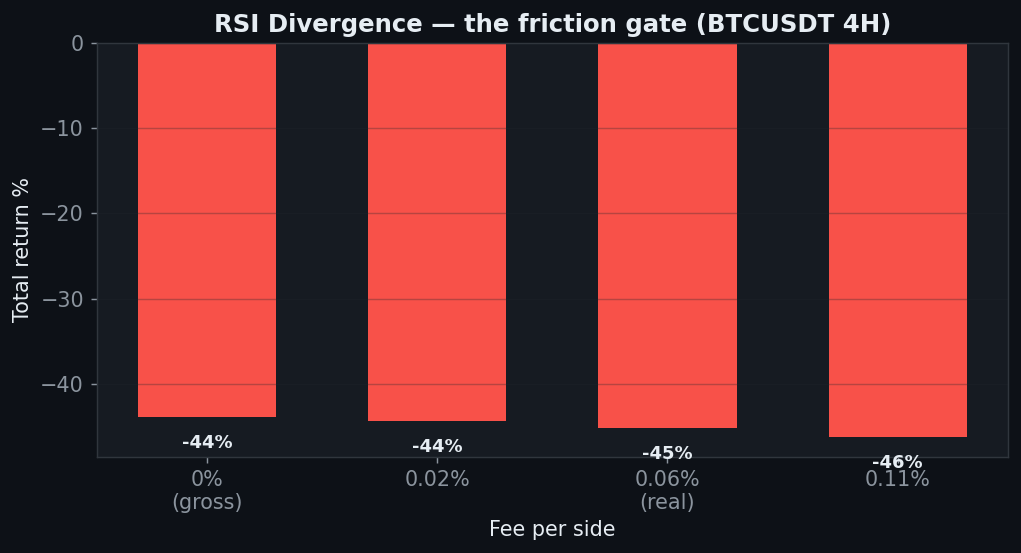
    RSI divergence friction gate, negative even at zero fees on BTC 4H

    Because divergence trades so seldom on 4H, fees are not what kills it — it is already −44% at zero cost. The parameter sweep confirms there is nothing to rescue: 0 of 6 RSI-period × pivot-width combinations turn a profit. You cannot tune your way out of a signal that fires late and rarely.

    The Verdict: REJECT

    • Gate 0 — Indicator fidelitypass (standard Wilder RSI(14), pivot-confirmed divergence)
    • Gate 1 — Sanitypass (pivot confirmed 5 bars later; entry on the confirmation close, no look-ahead)
    • Gate 2 — Frictionfail (negative even at 0% fee on 4H, −45%; there is no gross edge to erode)
    • Gate 3 — Yearly consistencyfail (no tradeable timeframe is consistently positive)
    • Gate 4 — Out-of-samplefail (2 of 5 coins positive out-of-sample)
    • Gate 5 — Robustnessfail (0 of 6 RSI-period × pivot-width cells positive on 4H)
    • Gate 6 — Multi-marketfail (2 of 5 coins on 4H, and only by +2–3%)
    • Gate 7 — vs Buy & Holdfail (the only green timeframe, the daily +12.6%, rests on 3 trades and merely ties holding)

    Divergence is a description dressed up as a prediction. You cannot mark it until the second pivot confirms, and by then the reversal — if there is one — has already begun. Mechanised honestly, it fires too rarely to trust on the timeframes where it isn’t losing, and its single profitable result is three trades of noise. As a piece of context on a chart, divergence can be interesting. As a mechanical entry, it does not survive contact with the data.

    FAQ

    You entered too late — real traders anticipate the pivot.
    Anticipating an unconfirmed pivot is guessing, and guessing can’t be backtested honestly. The moment you require confirmation — which is the only rule a computer can follow without peeking — you are late by construction. That lateness is the finding, not a flaw in the test.

    What about hidden divergence / regular divergence only in trends?
    Those are filters layered on top, and “add filters until the backtest looks good” is a different, easily over-fit exercise. We tested the signal that’s actually taught. If a filtered version has a real edge, it has to clear these same seven gates.

    Can I replicate this?
    Yes — RSI(14), 5-bar pivots, public Binance data, 0.06%/side, five coins, five timeframes.

    See also: RSI 30/70, Stochastic, MACD crossover, and the conditional passes VWAP and Ichimoku (daily).


    Disclaimer: educational research, not financial advice. Past performance does not guarantee future results. Never trade money you cannot afford to lose.
  • MACD Crossover Strategy Backtest: the 45-Year-Old Signal That Still Loses

    MACD Crossover Strategy Backtest: the 45-Year-Old Signal That Still Loses

    MACD is the indicator on the first page of every “Trading 101” course. Gerald Appel built it in the late 1970s; nearly half a century later it is still the default momentum tool on every platform, and the crossover rule — buy when the MACD line crosses above its signal line, sell when it crosses below — is taught to more beginners than any other single signal. So does the most famous crossover in trading actually work? We ran the standard 12/26/9 through the 7-Gate Protocol. Verdict: reject.
    Gate 00 — Fidelity

    Standard MACD: the 12-period EMA minus the 26-period EMA, with a 9-period EMA of that as the signal line. Identical to every platform’s default. Nothing to get wrong — the only question is whether crossing those lines makes money.
    The Exact Rules

    • Signal: MACD line crosses above the signal line → long; crosses below → short. Stop-and-reverse (always in the market)
    • Settings: 12 / 26 / 9 (the universal default)
    • Execution: on the bar close, no look-ahead; costs 0.06%/side; data Binance spot Jul 2024–Jul 2026, BTC/ETH/SOL/BNB/XRP, 5m–1D; benchmark buy & hold
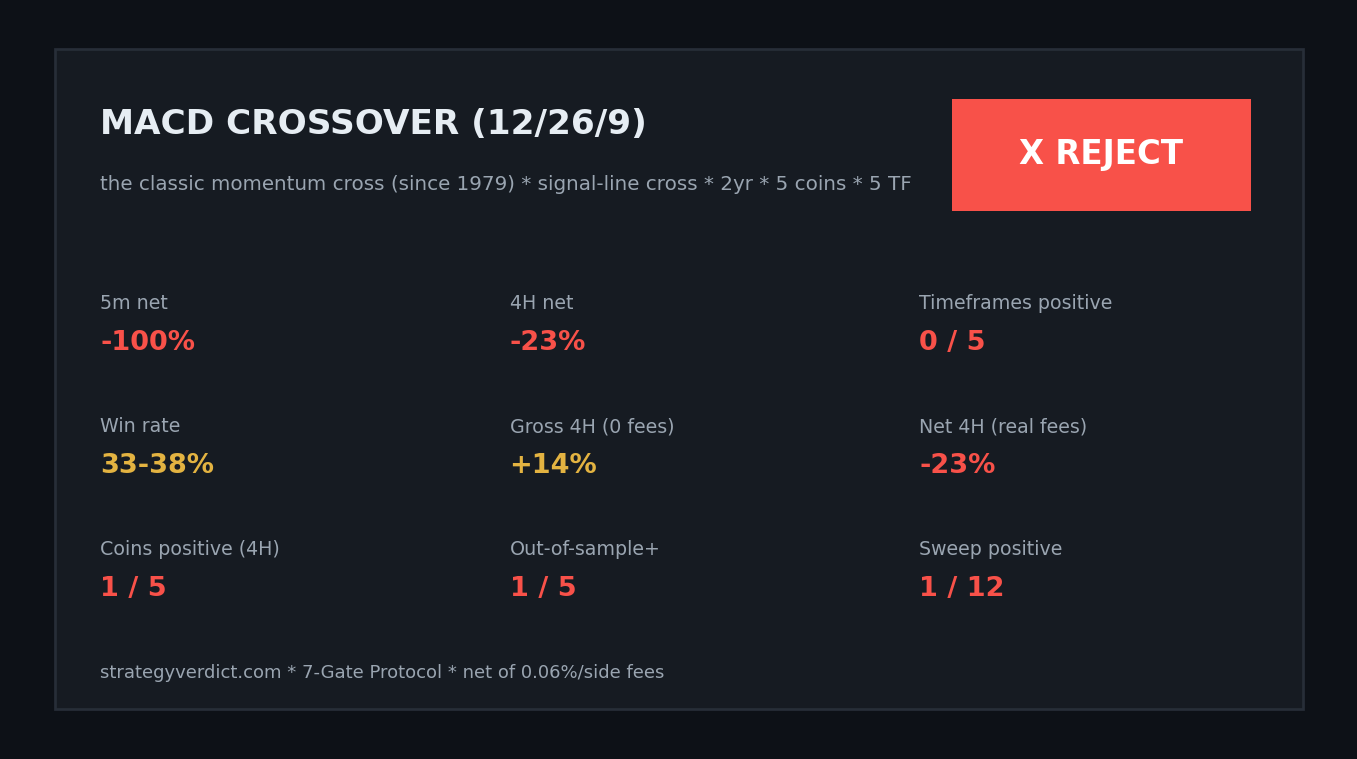
    MACD crossover verdict reject, loses on all 5 timeframes, tiny gross edge eaten by fees
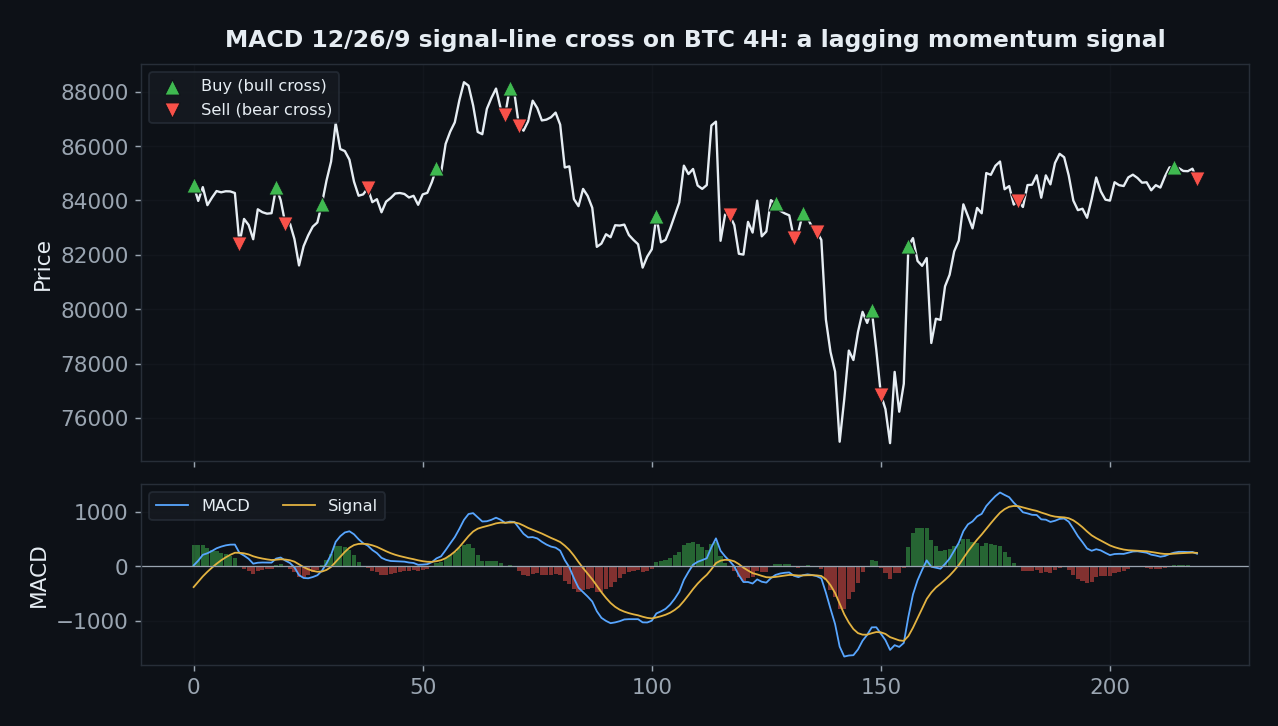
    MACD 12 26 9 signal line cross on BTC 4H, lagging momentum, price panel with buy sell and MACD histogram

    Notice the shape of the signal: MACD is a lagging momentum oscillator. By the time the lines cross, a good chunk of the move has already happened — you buy after the bounce and sell after the drop. That lag is the whole story.

    Gate 06a — Every Timeframe

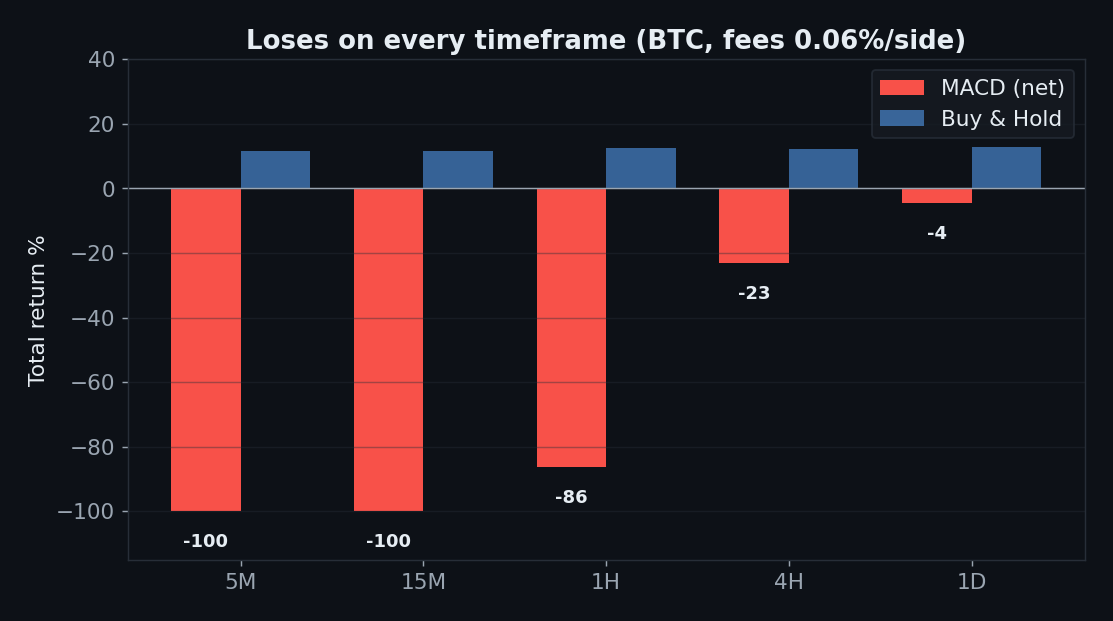
    MACD net return by timeframe all negative, minus 100 on 5 minute, minus 4 on daily

    It loses on all five: 5m −100% (16,762 trades — the account is vaporised), 15m −100%, 1h −86%, 4h −23%, and even the daily is negative at −4%. Zero timeframes positive, zero beat buy & hold. A 33–38% win rate with tiny wins and a lagging entry is a recipe for exactly this.

    Gate 02 — Friction

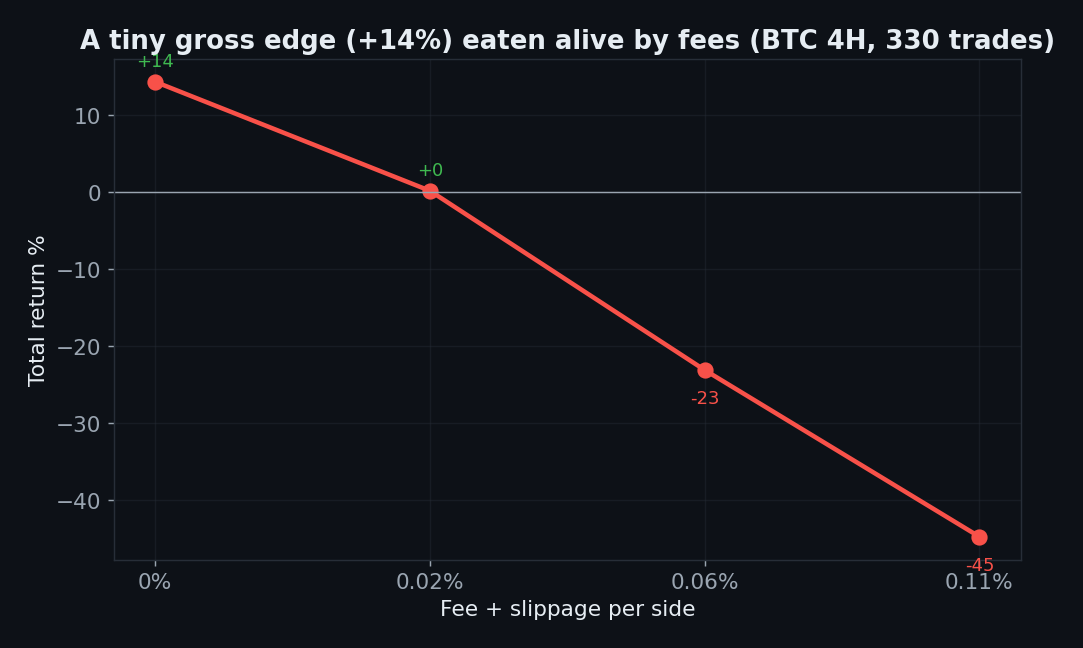
    MACD BTC 4H gross plus 14 percent turns to minus 23 net after fees, 330 trades

    MACD does have a whisper of a gross edge — +14% on BTC 4H with zero fees. But it takes 330 trades to collect it, and at a realistic 0.06%/side that +14% becomes −23%. The edge is smaller than the toll. This is the recurring epitaph on this site: a real-but-tiny signal, over-traded until the fees are bigger than the alpha.

    Gate 04 — Out-of-Sample

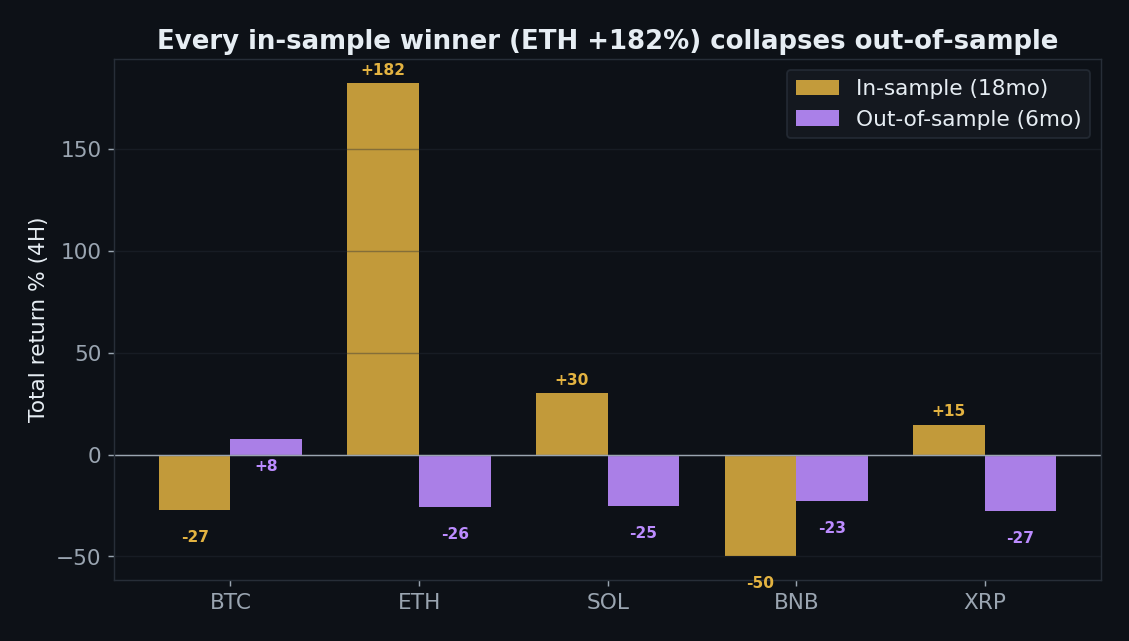
    MACD out of sample, in-sample winner ETH plus 182 collapses to minus 26 out of sample

    Split 18 months in / 6 months out and the overfit is glaring. ETH looks like a miracle in-sample at +182% — and prints −26% out-of-sample. SOL +30% → −25%. XRP +15% → −28%. Only 1 of 5 coins is positive out-of-sample. The in-sample winners were the strategy memorising the past, not predicting the future.

    Gate 06b & 05 — Coins and Robustness

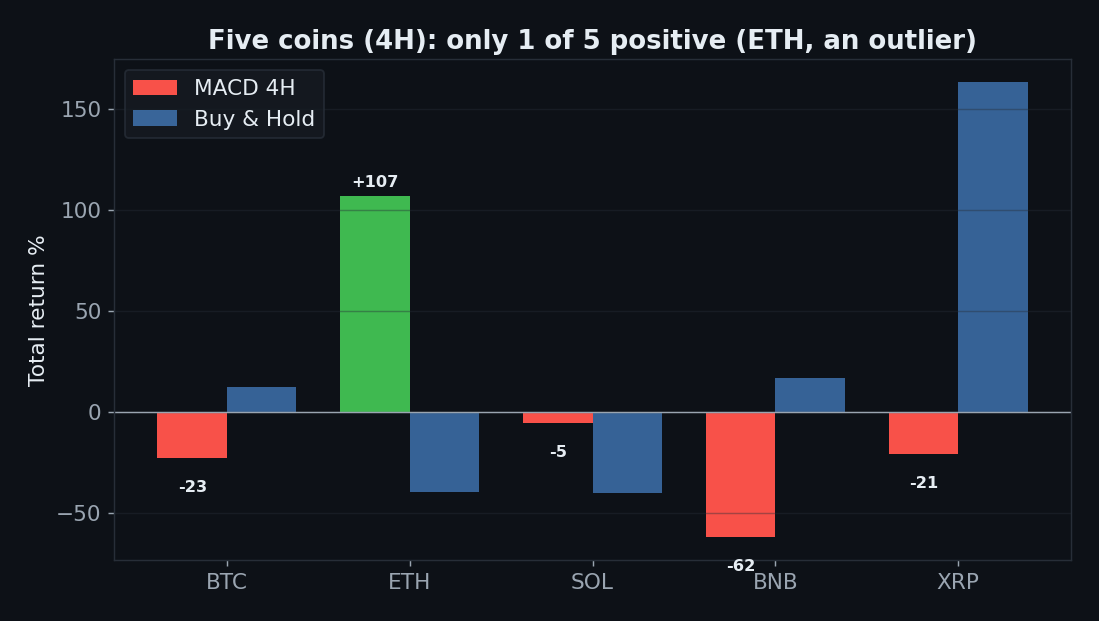
    MACD five coins 4H only 1 of 5 positive ETH outlier

    On 4H only 1 of 5 coins is profitable, and that one (ETH, +107%) is the same coin that dies out-of-sample. The parameter sweep is 1 of 12 positive, and neither popular fix helps: the zero-line cross is −55%, the EMA-200 trend filter −15%. Every reasonable variation of MACD-alone loses money.

    The Verdict: REJECT

    • Gate 0 — Indicator fidelitypass (standard 12/26/9, identical to every platform’s default)
    • Gate 1 — Sanitypass (signal on the closed bar, no look-ahead)
    • Gate 2 — Frictionfail (+14% gross → −23% net on 4H across 330 trades)
    • Gate 3 — Yearly consistencyfail (no consistently positive year on any timeframe)
    • Gate 4 — Out-of-samplefail (1/5 positive; ETH +182% in-sample → −26% out)
    • Gate 5 — Robustnessfail (1 of 12 sweep cells positive; zero-cross −55%, EMA-200 filter −15%)
    • Gate 6 — Multi-marketfail (1 of 5 coins on 4H, and that one is an outlier)
    • Gate 7 — vs Buy & Holdfail (0 of 5 timeframes beat buy & hold)

    The MACD crossover is 45 years old and still cannot beat holding. It is a lagging momentum signal: by the time the lines cross the move is half over, so you buy high-ish and sell low-ish, hundreds of times, paying a fee on each. There’s a faint gross edge, but it’s smaller than the cost of harvesting it, it doesn’t generalize across coins, and every in-sample star collapses out-of-sample. MACD is a fine way to read momentum on a chart. As a mechanical entry/exit, it’s a museum piece.

    FAQ

    Everyone says to combine MACD with RSI / a filter.
    Exactly — because MACD alone doesn’t work, which is what we measured. “Add a second indicator until the backtest looks good” is a different, and easily over-fit, strategy. We test the thing that’s actually taught: the crossover.

    Isn’t the daily at least okay?
    No — the daily is −4% and still loses to simply holding (+13%). It’s the least-bad timeframe, not a good one.

    Can I replicate this?
    Yes — MACD(12,26,9), public Binance data, 0.06%/side. Signal-line cross, five coins, five timeframes.

    See also: RSI 30/70, UT Bot, Range Filter, Bollinger reversion, and the conditional passes VWAP and Ichimoku (daily).


    Disclaimer: educational research, not financial advice. Past performance does not guarantee future results. Never trade money you cannot afford to lose.