Tag: 7-Gate Protocol

  • MACD Crossover Strategy Backtest: the 45-Year-Old Signal That Still Loses

    MACD Crossover Strategy Backtest: the 45-Year-Old Signal That Still Loses

    MACD is the indicator on the first page of every “Trading 101” course. Gerald Appel built it in the late 1970s; nearly half a century later it is still the default momentum tool on every platform, and the crossover rule — buy when the MACD line crosses above its signal line, sell when it crosses below — is taught to more beginners than any other single signal. So does the most famous crossover in trading actually work? We ran the standard 12/26/9 through the 7-Gate Protocol. Verdict: reject.

    Gate 00 — Fidelity

    Standard MACD: the 12-period EMA minus the 26-period EMA, with a 9-period EMA of that as the signal line. Identical to every platform’s default. Nothing to get wrong — the only question is whether crossing those lines makes money.

    The Exact Rules

    • Signal: MACD line crosses above the signal line → long; crosses below → short. Stop-and-reverse (always in the market)
    • Settings: 12 / 26 / 9 (the universal default)
    • Execution: on the bar close, no look-ahead; costs 0.06%/side; data Binance spot Jul 2024–Jul 2026, BTC/ETH/SOL/BNB/XRP, 5m–1D; benchmark buy & hold
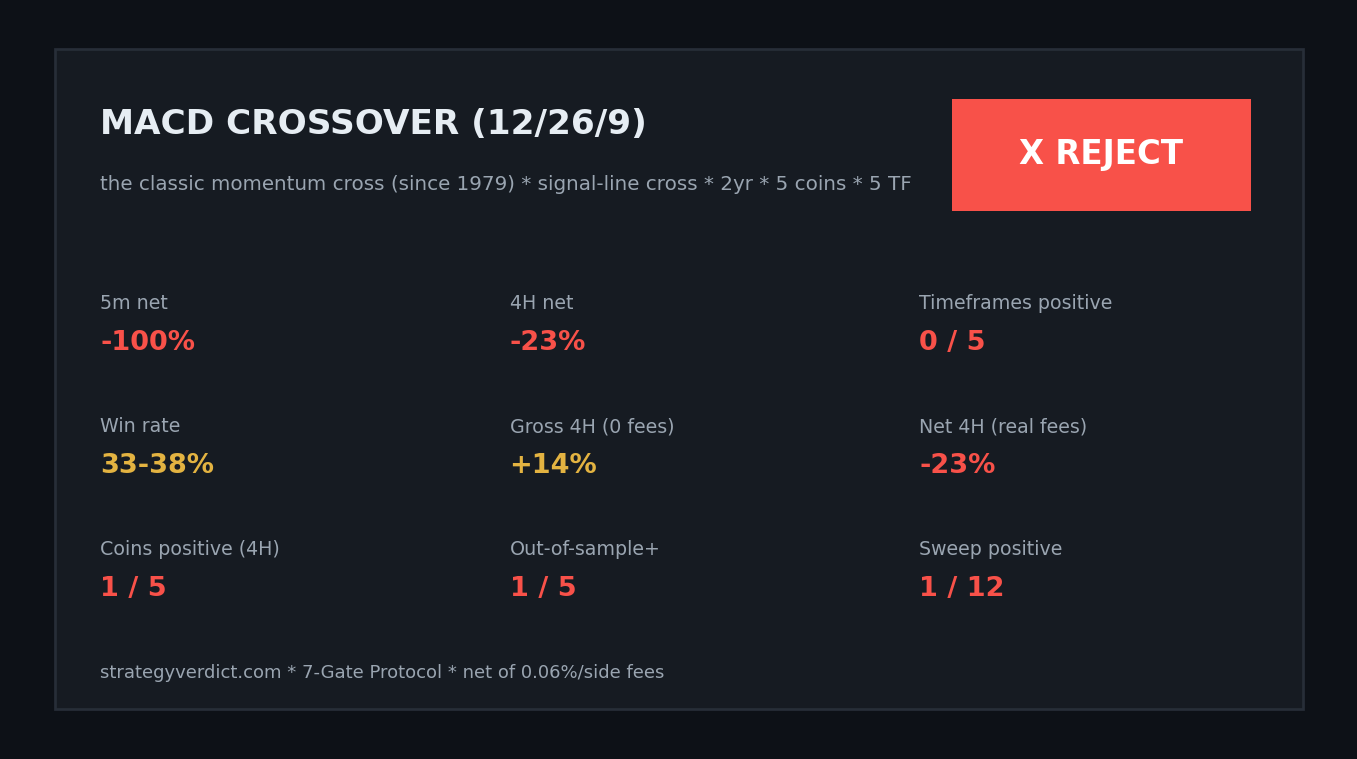
    MACD crossover verdict reject, loses on all 5 timeframes, tiny gross edge eaten by fees
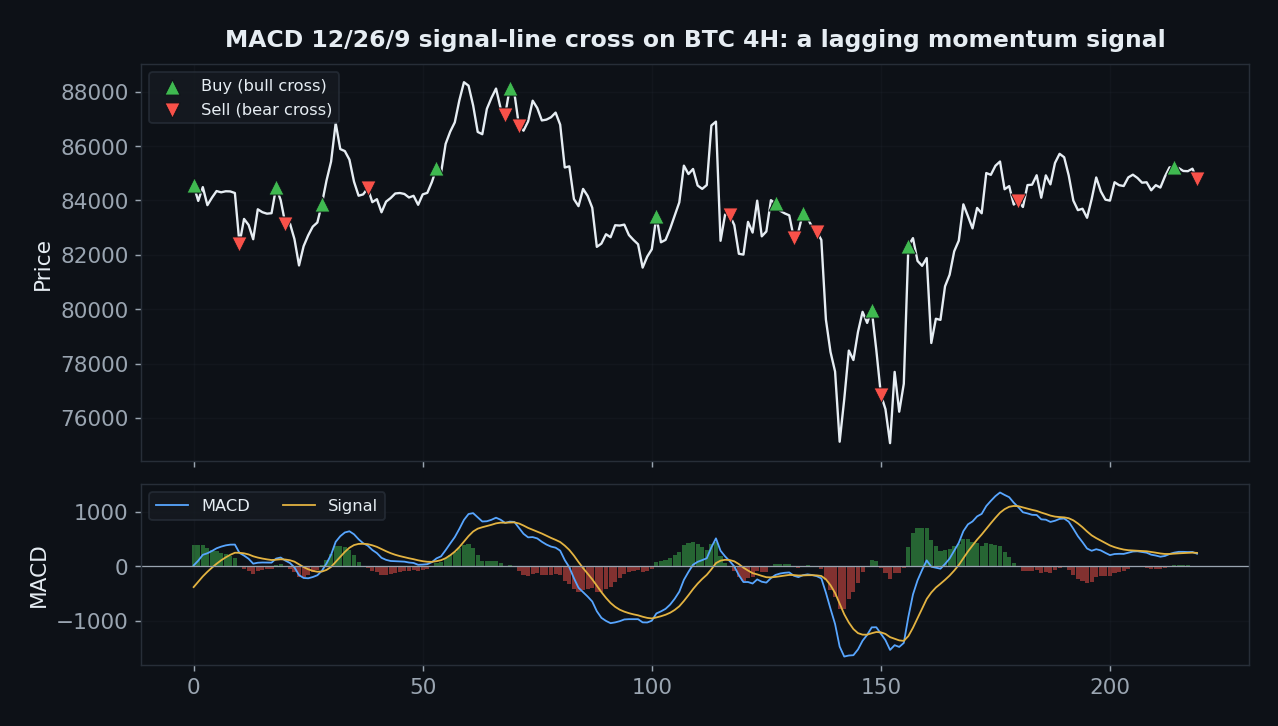
    MACD 12 26 9 signal line cross on BTC 4H, lagging momentum, price panel with buy sell and MACD histogram

    Notice the shape of the signal: MACD is a lagging momentum oscillator. By the time the lines cross, a good chunk of the move has already happened — you buy after the bounce and sell after the drop. That lag is the whole story.

    Gate 06a — Every Timeframe

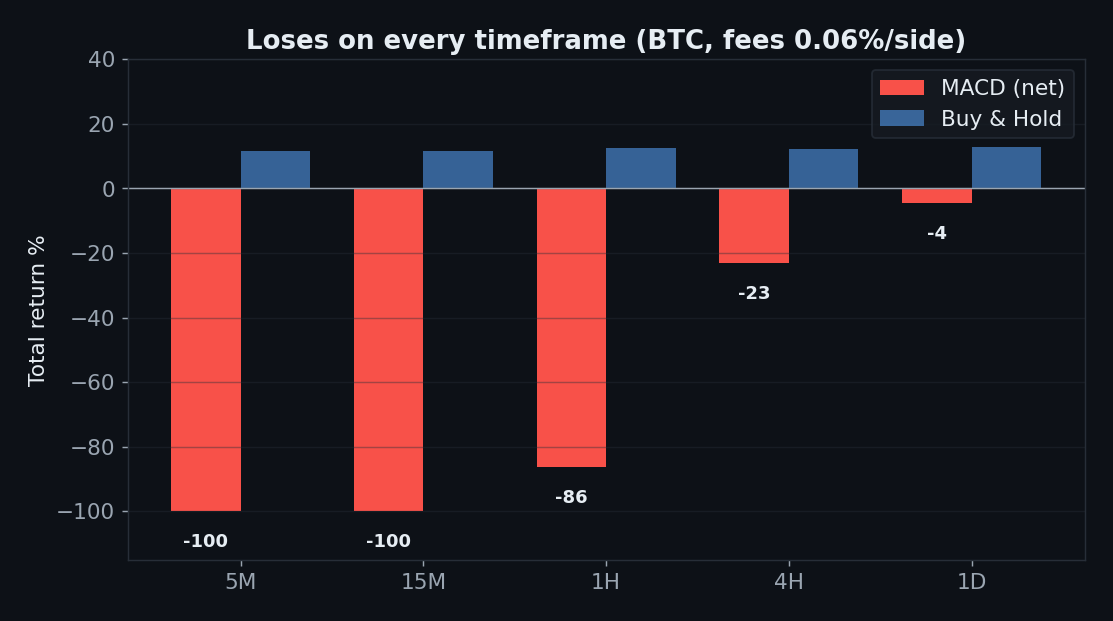
    MACD net return by timeframe all negative, minus 100 on 5 minute, minus 4 on daily

    It loses on all five: 5m −100% (16,762 trades — the account is vaporised), 15m −100%, 1h −86%, 4h −23%, and even the daily is negative at −4%. Zero timeframes positive, zero beat buy & hold. A 33–38% win rate with tiny wins and a lagging entry is a recipe for exactly this.

    Gate 02 — Friction

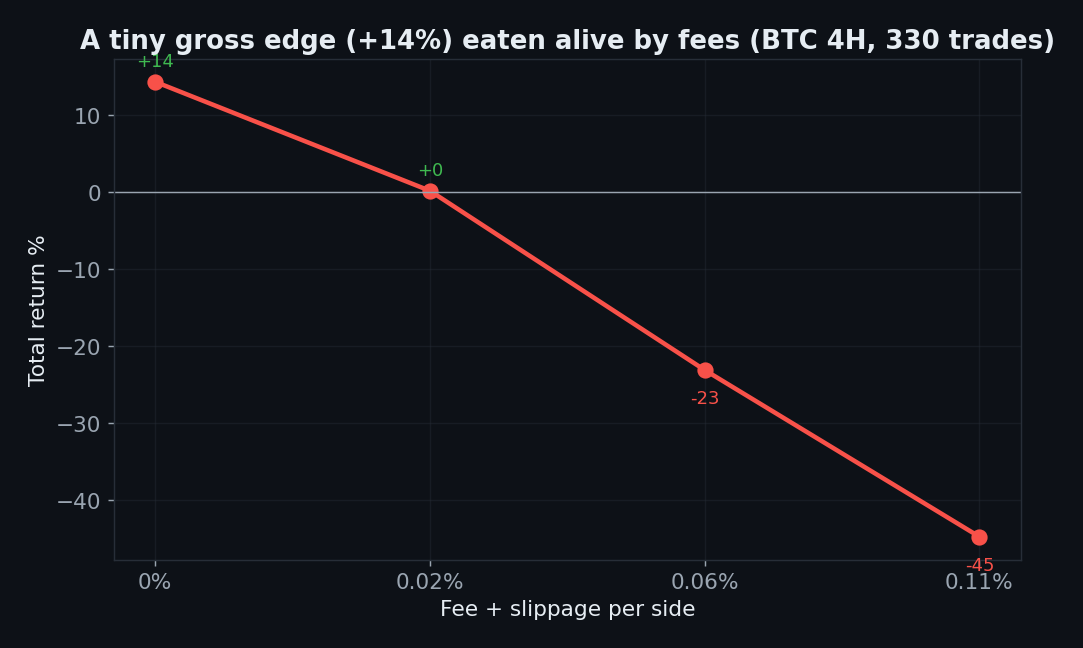
    MACD BTC 4H gross plus 14 percent turns to minus 23 net after fees, 330 trades

    MACD does have a whisper of a gross edge — +14% on BTC 4H with zero fees. But it takes 330 trades to collect it, and at a realistic 0.06%/side that +14% becomes −23%. The edge is smaller than the toll. This is the recurring epitaph on this site: a real-but-tiny signal, over-traded until the fees are bigger than the alpha.

    Gate 04 — Out-of-Sample

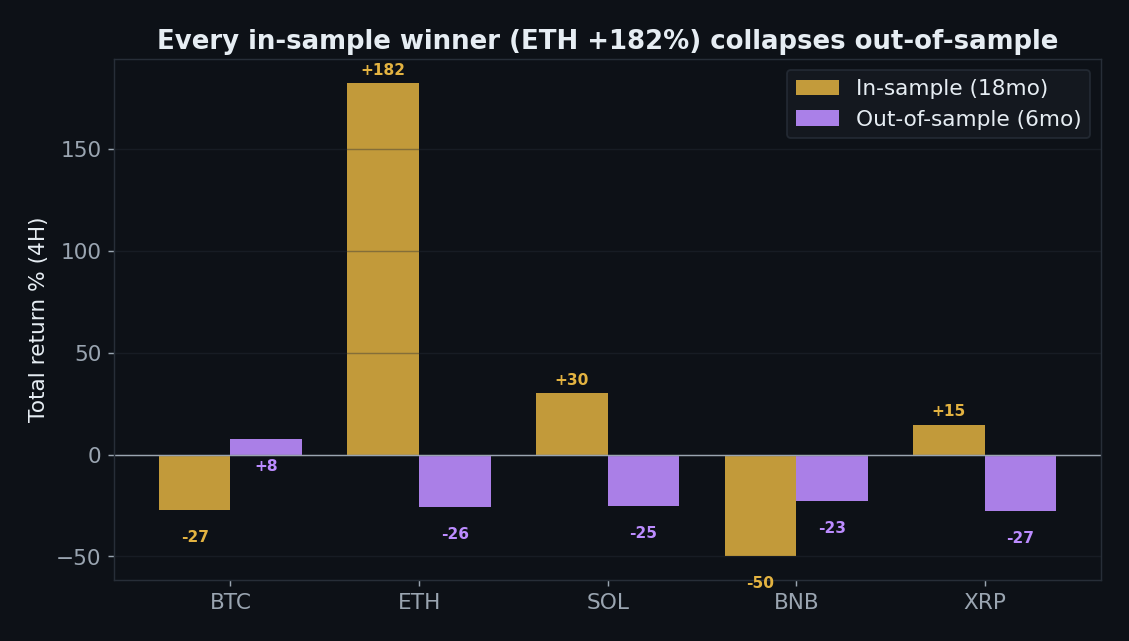
    MACD out of sample, in-sample winner ETH plus 182 collapses to minus 26 out of sample

    Split 18 months in / 6 months out and the overfit is glaring. ETH looks like a miracle in-sample at +182% — and prints −26% out-of-sample. SOL +30% → −25%. XRP +15% → −28%. Only 1 of 5 coins is positive out-of-sample. The in-sample winners were the strategy memorising the past, not predicting the future.

    Gate 06b & 05 — Coins and Robustness

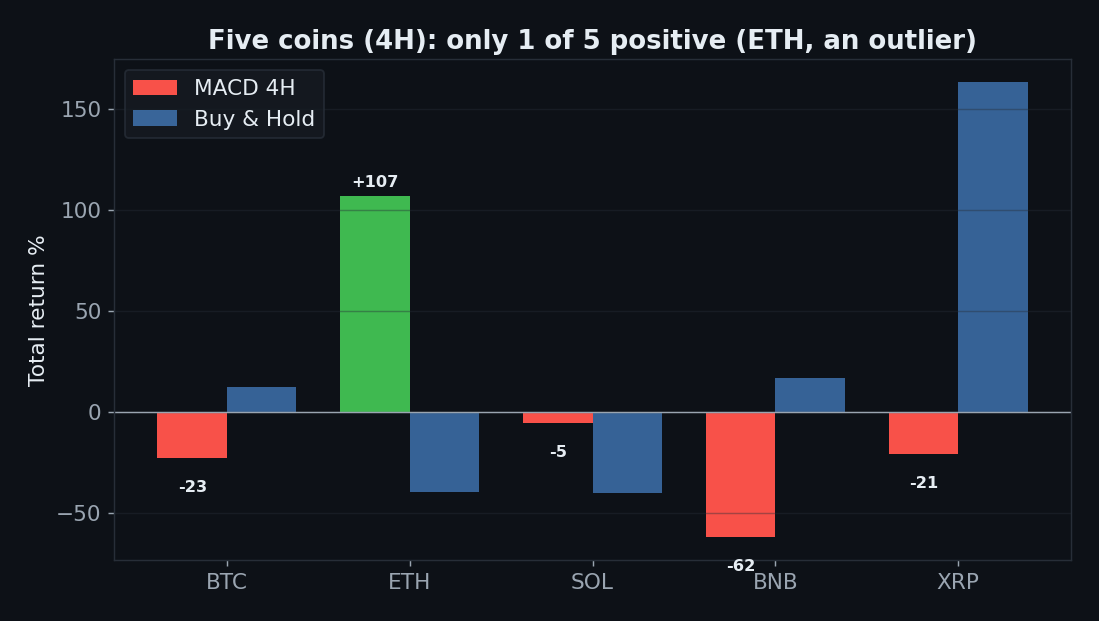
    MACD five coins 4H only 1 of 5 positive ETH outlier

    On 4H only 1 of 5 coins is profitable, and that one (ETH, +107%) is the same coin that dies out-of-sample. The parameter sweep is 1 of 12 positive, and neither popular fix helps: the zero-line cross is −55%, the EMA-200 trend filter −15%. Every reasonable variation of MACD-alone loses money.

    The Verdict: REJECT

    • Gate 0 — Indicator fidelitypass (standard 12/26/9, identical to every platform’s default)
    • Gate 1 — Sanitypass (signal on the closed bar, no look-ahead)
    • Gate 2 — Frictionfail (+14% gross → −23% net on 4H across 330 trades)
    • Gate 3 — Yearly consistencyfail (no consistently positive year on any timeframe)
    • Gate 4 — Out-of-samplefail (1/5 positive; ETH +182% in-sample → −26% out)
    • Gate 5 — Robustnessfail (1 of 12 sweep cells positive; zero-cross −55%, EMA-200 filter −15%)
    • Gate 6 — Multi-marketfail (1 of 5 coins on 4H, and that one is an outlier)
    • Gate 7 — vs Buy & Holdfail (0 of 5 timeframes beat buy & hold)

    The MACD crossover is 45 years old and still cannot beat holding. It is a lagging momentum signal: by the time the lines cross the move is half over, so you buy high-ish and sell low-ish, hundreds of times, paying a fee on each. There’s a faint gross edge, but it’s smaller than the cost of harvesting it, it doesn’t generalize across coins, and every in-sample star collapses out-of-sample. MACD is a fine way to read momentum on a chart. As a mechanical entry/exit, it’s a museum piece.

    FAQ

    Everyone says to combine MACD with RSI / a filter.
    Exactly — because MACD alone doesn’t work, which is what we measured. “Add a second indicator until the backtest looks good” is a different, and easily over-fit, strategy. We test the thing that’s actually taught: the crossover.

    Isn’t the daily at least okay?
    No — the daily is −4% and still loses to simply holding (+13%). It’s the least-bad timeframe, not a good one.

    Can I replicate this?
    Yes — MACD(12,26,9), public Binance data, 0.06%/side. Signal-line cross, five coins, five timeframes.

    See also: RSI 30/70, UT Bot, Range Filter, Bollinger reversion, and the conditional passes VWAP and Ichimoku (daily).


    Disclaimer: educational research, not financial advice. Past performance does not guarantee future results. Never trade money you cannot afford to lose.
  • Range Filter Buy/Sell Strategy Backtest: the Viral 5-Minute Filter That Loses -100%

    Range Filter Buy/Sell Strategy Backtest: the Viral 5-Minute Filter That Loses -100%

    The “Range Filter Buy and Sell 5min” is one of the most forked, most screen-recorded indicators on TradingView. A single smooth line that turns green and prints “BUY”, turns red and prints “SELL” — and a thousand videos titled “this 5-minute strategy prints money.” Under the hood it is simply another ATR-style trailing filter, a close cousin of two strategies we’ve already buried: UT Bot and Triple SuperTrend. We ran guikroth’s version through the full 7-Gate Protocol. Same family, same verdict: reject.

    Gate 00 — Fidelity

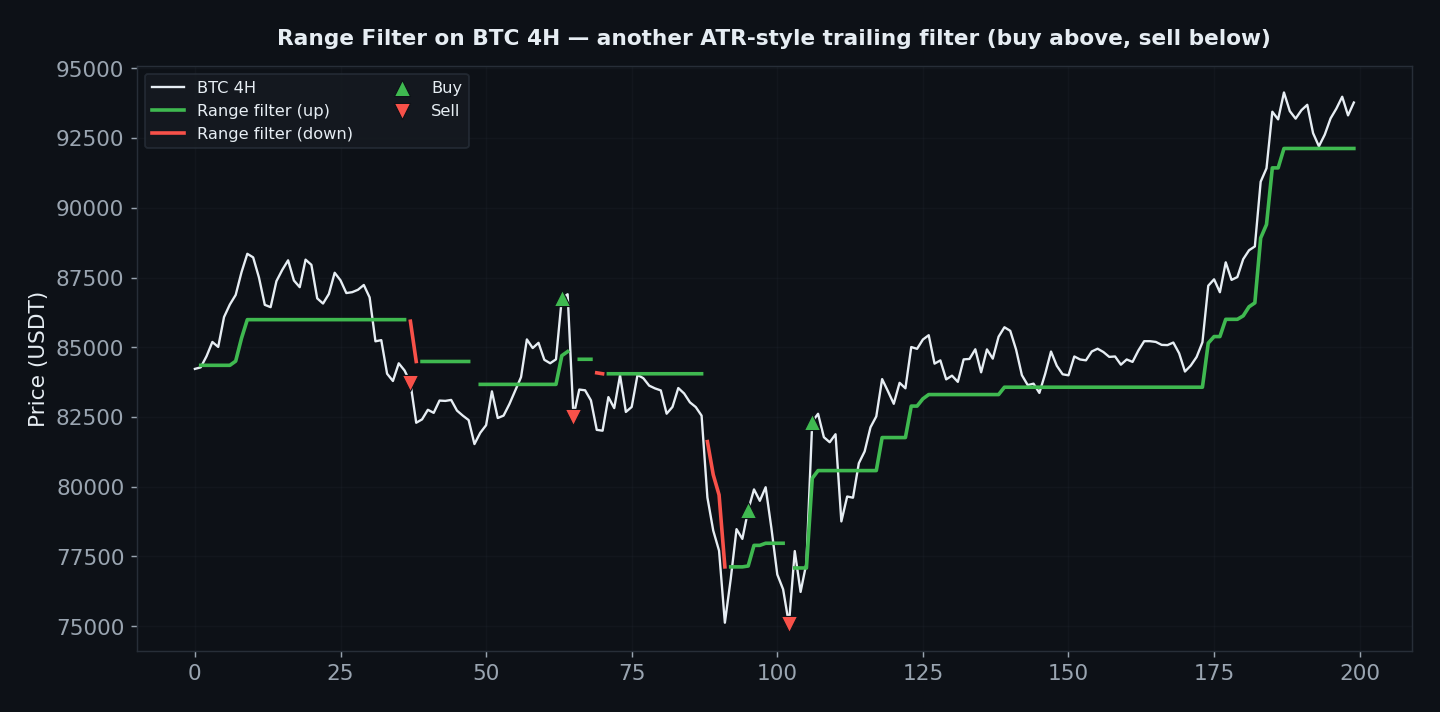
    We reproduced guikroth’s public Pine exactly: an EMA of the absolute bar-to-bar price change, smoothed again and multiplied by the range multiplier (defaults: sampling period 100, multiplier 3.0). The filter trails price and flips color; you go long above it, short below. Nothing exotic — and nothing to get wrong.

    The Exact Rules

    • Signal: price closes above the (rising) range filter → long; closes below the (falling) filter → short. Stop-and-reverse (always in the market)
    • Settings: sampling period 100, multiplier 3.0 (the shared default)
    • Execution: on the bar close, no look-ahead; costs 0.06%/side; data Binance spot Jul 2024–Jul 2026, BTC/ETH/SOL/BNB/XRP, 5m–1D; benchmark buy & hold
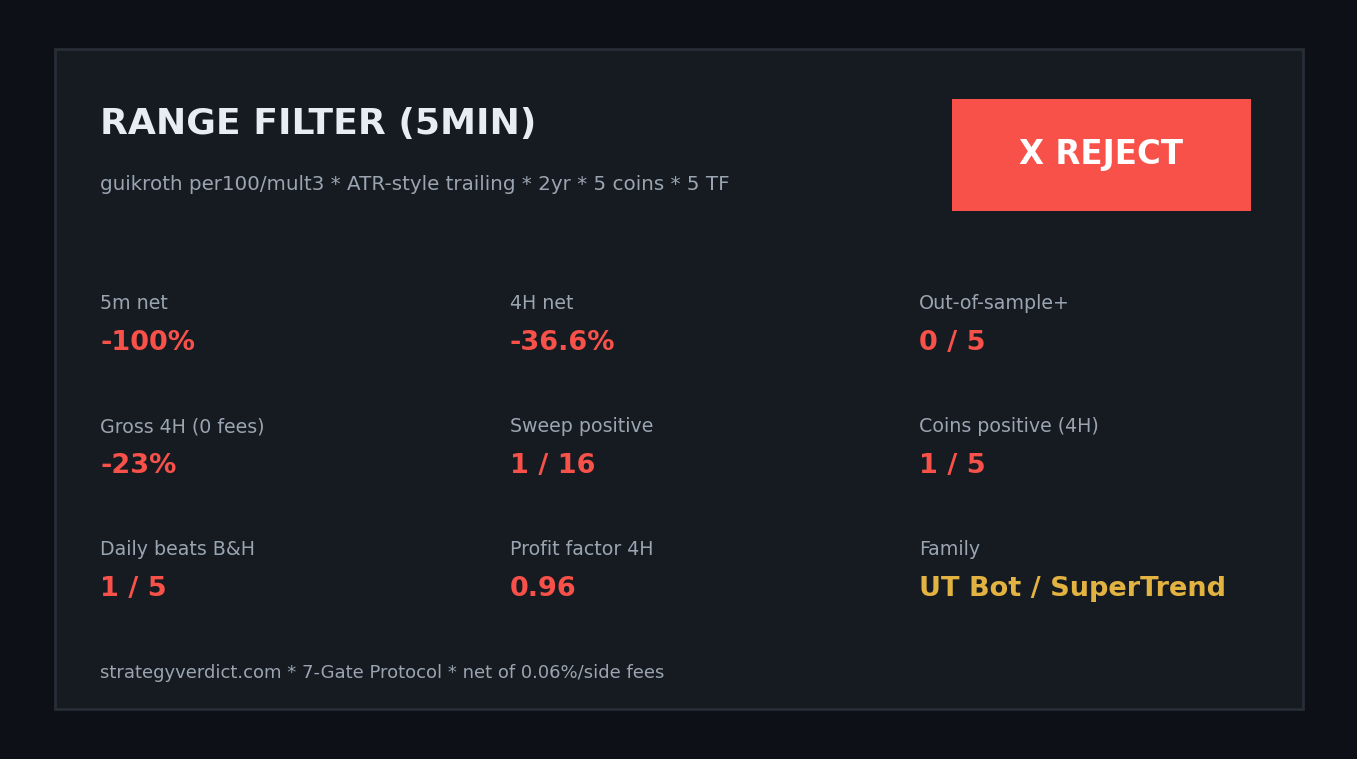
    Range Filter 5min verdict reject, minus 100 on 5 minute, zero of five out of sample positive

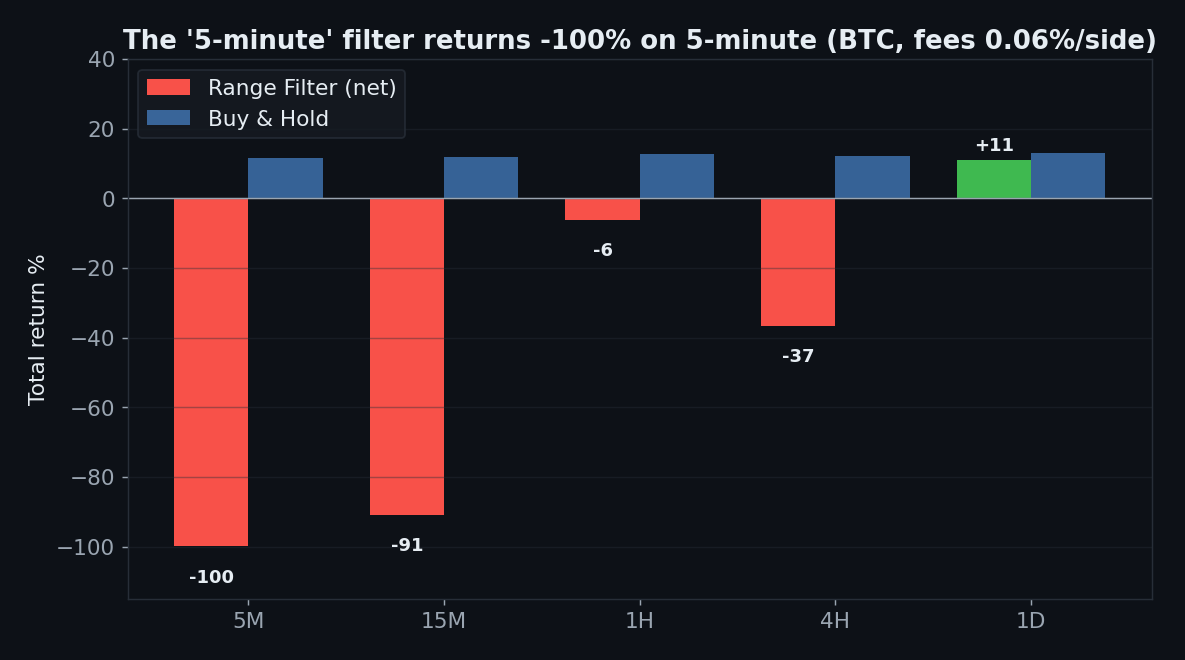
    It’s a “5-minute” filter that returns −100% on 5 minutes

    Range Filter net return by timeframe, minus 100 percent on 5 minute the timeframe it is named after

    The indicator is literally named for the 5-minute chart. On the 5-minute chart it takes 6,465 trades and returns −100% — the account is gone. 15m: −91%. 4h: −37%. It loses to buy & hold on all five timeframes, and the “best” one (daily +11%) still trails simply holding. The trailing-filter family self-destructs on the fast charts it’s marketed on, exactly like UT Bot and SuperTrend before it.

    Range Filter on BTC 4H, ATR style trailing filter, buy above sell below with color change

    Gate 04 — Out-of-Sample (the tell)

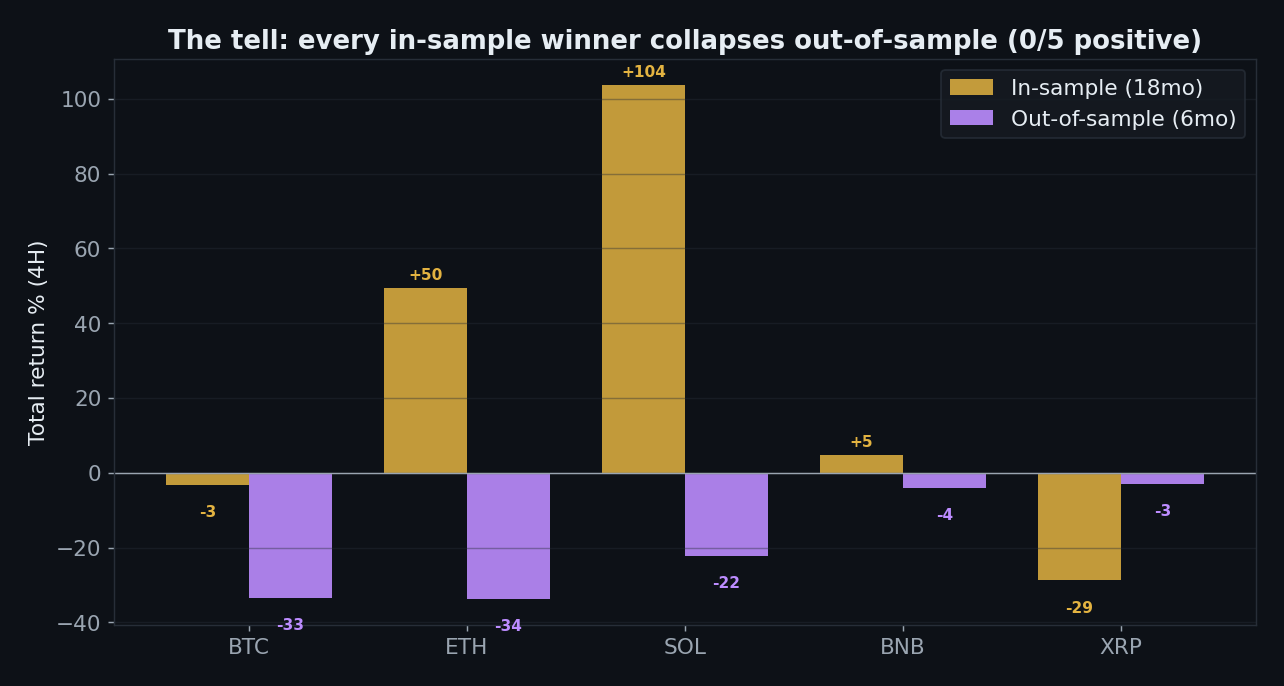
    Range Filter out of sample, every in-sample winner collapses, zero of five positive out of sample

    This is the cleanest kill we’ve filmed. Split each coin 18 months in / 6 months out. In-sample, a couple of coins look brilliant — SOL +104%, ETH +50%. Out-of-sample, every single one turns negative (SOL −22%, ETH −34%, BNB −4%): 0 of 5 positive out-of-sample. When your winners exist only in the half of the data you fit to, you didn’t find an edge — you found the past.

    Gate 06 — Five Coins & Gate 02 — Friction

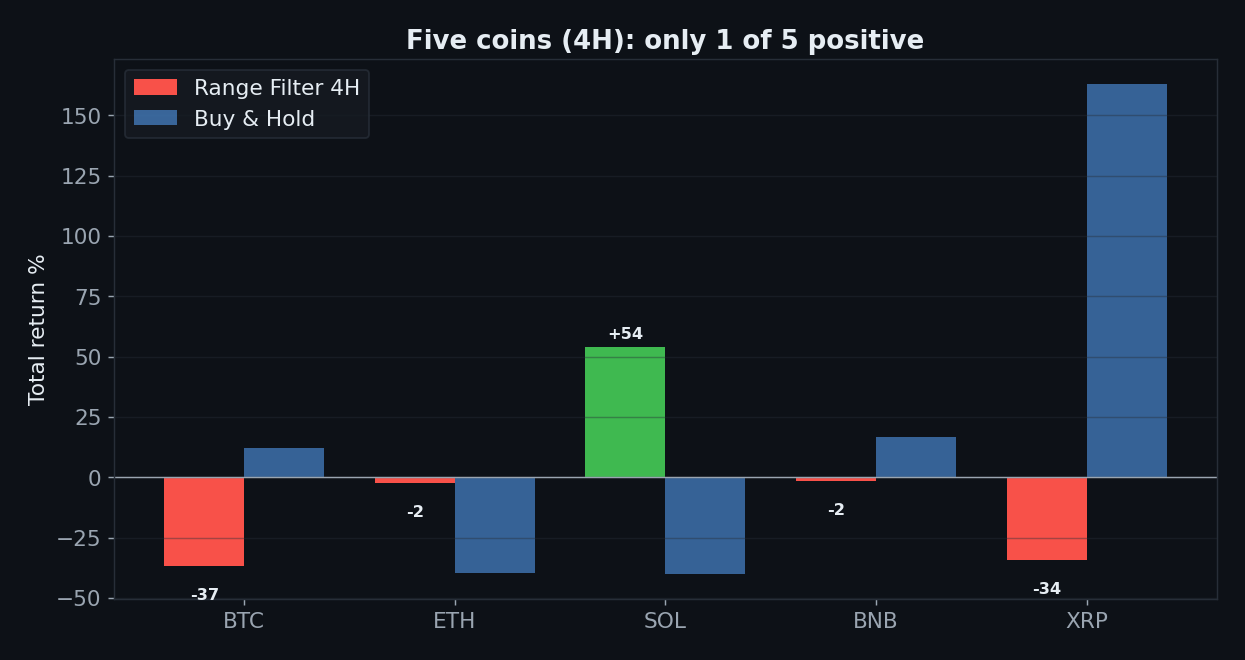
    Range Filter five coins 4H only one of five positive

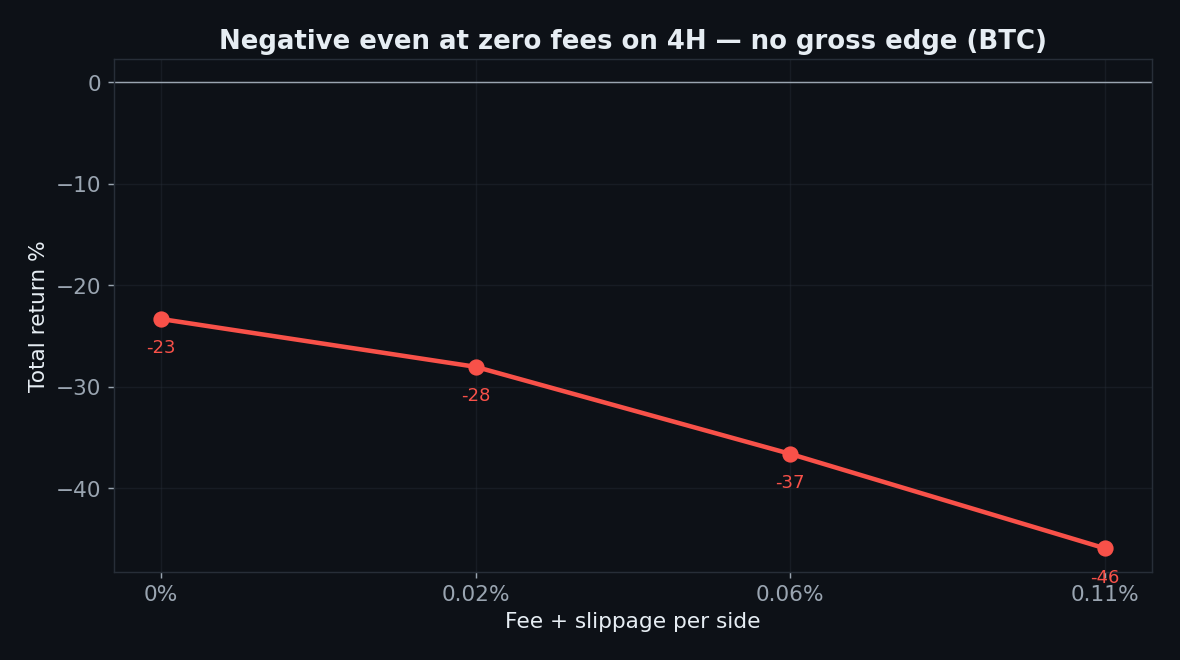
    On 4H only 1 of 5 coins is profitable (SOL, the same coin that then dies out-of-sample). And the friction test shows there was never a gross edge to erode:

    Range Filter 4H negative even at zero fees, no gross edge

    −23% on BTC 4H at zero fees. The parameter sweep is just as bleak: only 1 of 16 period/multiplier combinations is positive.

    The Verdict: REJECT

    • Gate 0 — Indicator fidelitypass (faithful reproduction of guikroth’s public Range Filter, period 100 / multiplier 3)
    • Gate 1 — Sanitypass (signal on the closed bar, no look-ahead)
    • Gate 2 — Frictionfail (negative even at zero fees on 4H; 5m → −100%)
    • Gate 3 — Yearly consistencyfail (no consistently positive year)
    • Gate 4 — Out-of-samplefail hard (0 of 5 coins positive out-of-sample — SOL +104% in-sample → −22% out)
    • Gate 5 — Robustnessfail (only 1 of 16 period × multiplier cells positive)
    • Gate 6 — Multi-marketfail (1 of 5 coins positive on 4H)
    • Gate 7 — vs Buy & Holdfail (behind on every timeframe)

    Range Filter is the third ATR-style trailing indicator we’ve tested, and the third to fail the same way. UT Bot, Triple SuperTrend, and now Range Filter all promise “5-minute” signals and all return roughly −100% on the 5-minute chart once you pay fees. The lesson isn’t about any one indicator — it’s that a smoothed trailing stop is not a strategy, and repackaging it with new colours and a new name doesn’t change the maths. Range Filter also fails the one test the others occasionally survived: out-of-sample, it’s 0 for 5.

    FAQ

    Isn’t this different from UT Bot?
    Cosmetically. The smoothing differs (EMA-of-absolute-change vs ATR), but both are trailing filters that flip long/short on a crossing. They share the same failure mode: constant flipping on fast charts, fees bigger than the edge.

    The in-sample SOL result was +104% though.
    And it went to −22% out-of-sample. That’s the entire point of an out-of-sample test: in-sample numbers are the strategy describing the data it was fit on. Only the out-of-sample number is a prediction, and here it’s negative on all five coins.

    Can I replicate this?
    Yes — guikroth’s public Range Filter (period 100, mult 3), Binance data, 0.06%/side.

    See also the rest of the trailing-filter family: UT Bot, Triple SuperTrend; and our one conditional pass among trend systems, Ichimoku cloud breakout.


    Disclaimer: educational research, not financial advice. Past performance does not guarantee future results. Never trade money you cannot afford to lose.
  • Ichimoku Cloud Strategy Backtest: a Real Edge on the Daily, a Disaster Intraday

    Ichimoku Cloud Strategy Backtest: a Real Edge on the Daily, a Disaster Intraday

    Ichimoku Kinko Hyo — “one glance equilibrium chart” — is the indicator that looks like a weather map and scares beginners away. Clouds, five lines, a signal from the future and one from the past. The most-taught, most-mechanical piece of it is the cloud breakout: go long when price closes above the cloud, short when it closes below. The claims swing wildly, from “70–75% win rate with full alignment” to one study’s brutal “10% win rate across 15,000 trades.” We ran the plain cloud breakout through the 7-Gate Protocol — and it earned something rare on this site: a conditional pass. Only our second, after VWAP. Because this one, unlike the last three, actually works — just not where it’s sold.

    Gate 00 — Fidelity

    Standard Ichimoku: Tenkan 9, Kijun 26, Senkou B 52, cloud displaced 26 forward — identical to TradingView’s built-in. Crucially, we use the no-look-ahead cloud: the cloud sitting under today’s price was projected 26 bars ago, so the signal only ever uses information that existed at the time.

    The Exact Rules

    • Signal: close above the cloud (top of Senkou A/B) → long; close below the cloud → short; inside the cloud → flat
    • Settings: 9 / 26 / 52, displacement 26 (the universal default)
    • Execution: on the bar close, no look-ahead; costs 0.06%/side; data Binance spot Jul 2024–Jul 2026, BTC/ETH/SOL/BNB/XRP, 5m–1D; benchmark buy & hold
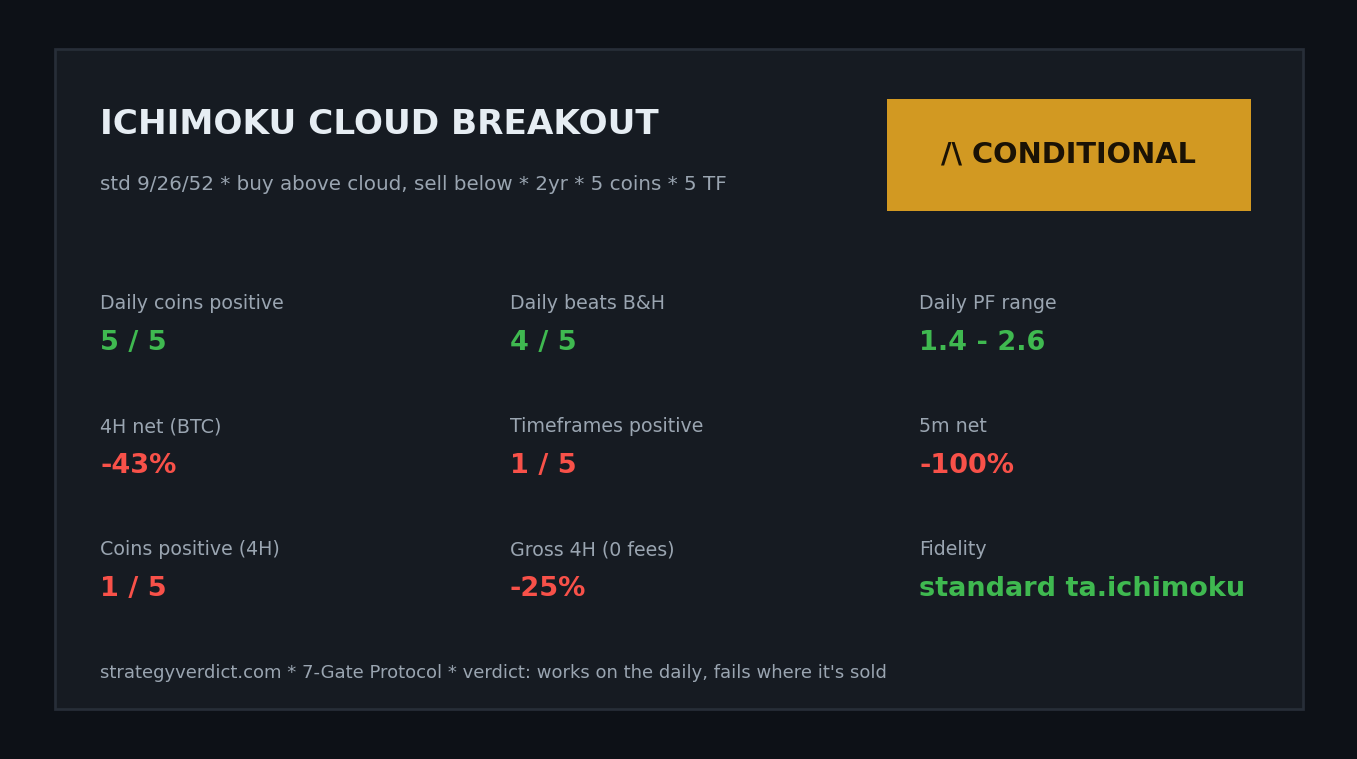
    Ichimoku cloud breakout conditional verdict, works on daily 5 of 5 coins, fails on intraday

    Where it genuinely works: the daily

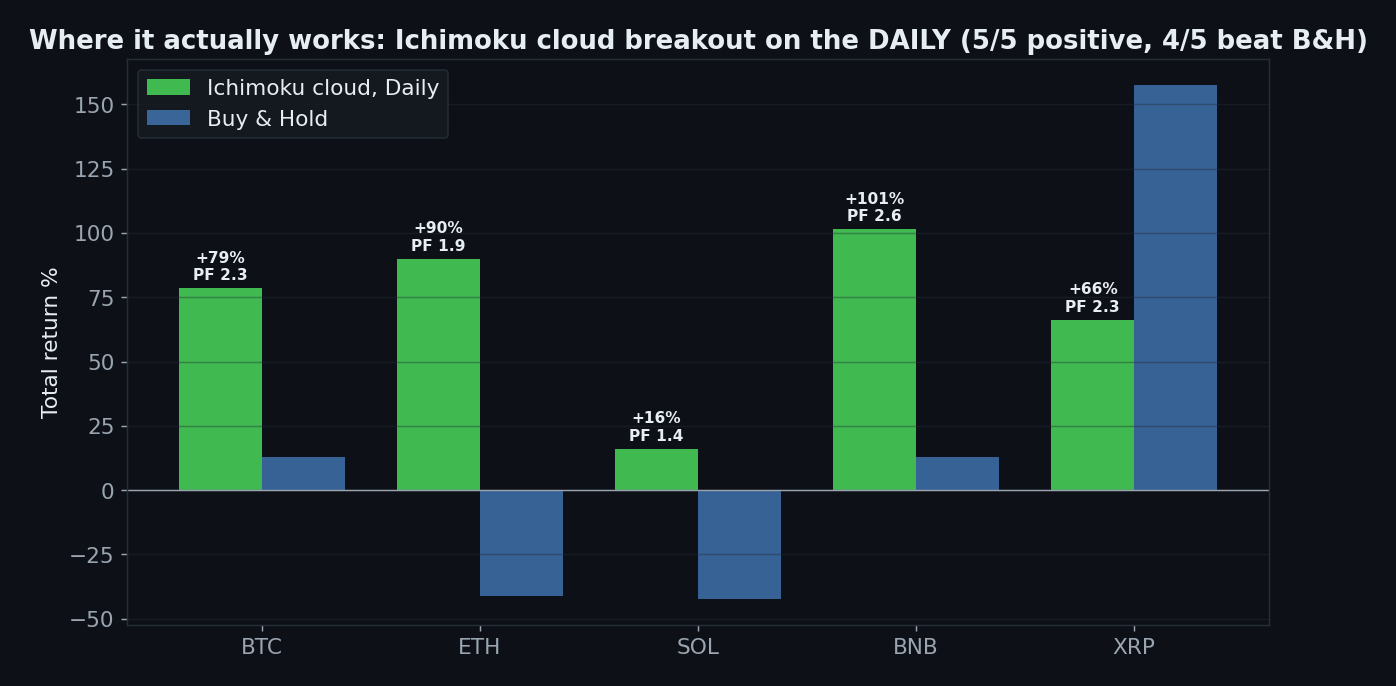
    Ichimoku cloud breakout daily 5 coins all positive 4 of 5 beat buy and hold profit factor 1.4 to 2.6

    On the daily timeframe the cloud breakout is profitable on all five coins — BTC +79%, ETH +90%, SOL +16%, BNB +102%, XRP +66% — with profit factors of 1.4 to 2.6, and it beats buy & hold on four of the five. This is not an artifact: it’s a real, generalizable trend-following edge. Note how it shines on ETH and SOL, where buy & hold lost 40%+: the short side caught the alt bear market. That is exactly what a trend system is supposed to do.

    Why it works: it’s an honest trend-follower

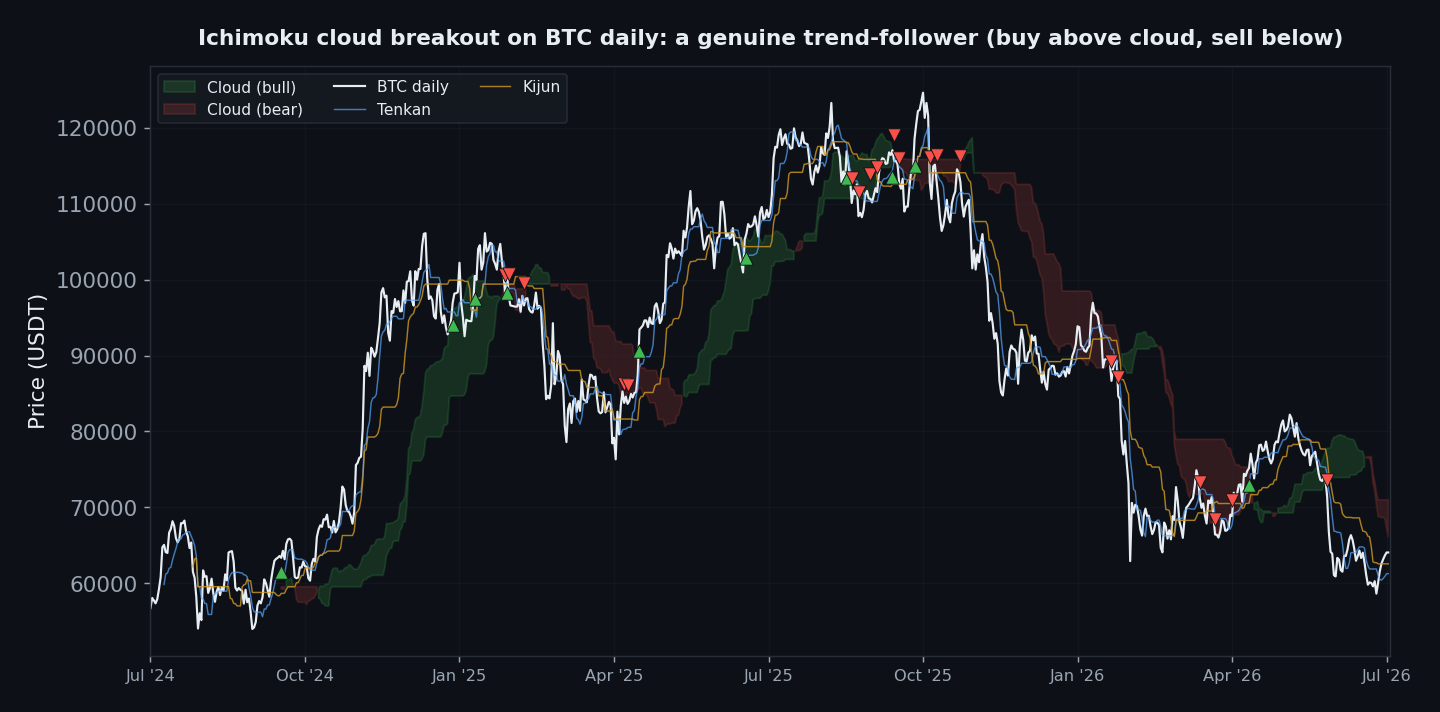
    Ichimoku cloud breakout on BTC daily, genuine trend follower, buy above cloud sell below, with Tenkan Kijun

    There’s no mysticism here. Long above the cloud, short below it — the strategy simply rides established trends and flips when the regime changes. It buys the 2024 breakout, holds the run to 125k, and shorts the 2025–26 decline. The win rate is low (~28%), which surprises people, but the payoff ratio is high: a few big trends pay for many small stop-outs. That is the correct shape for trend-following — the opposite of the high-win-rate mean-reversion traps like Bollinger reversion and RSI.

    The catch: every timeframe it’s actually sold on

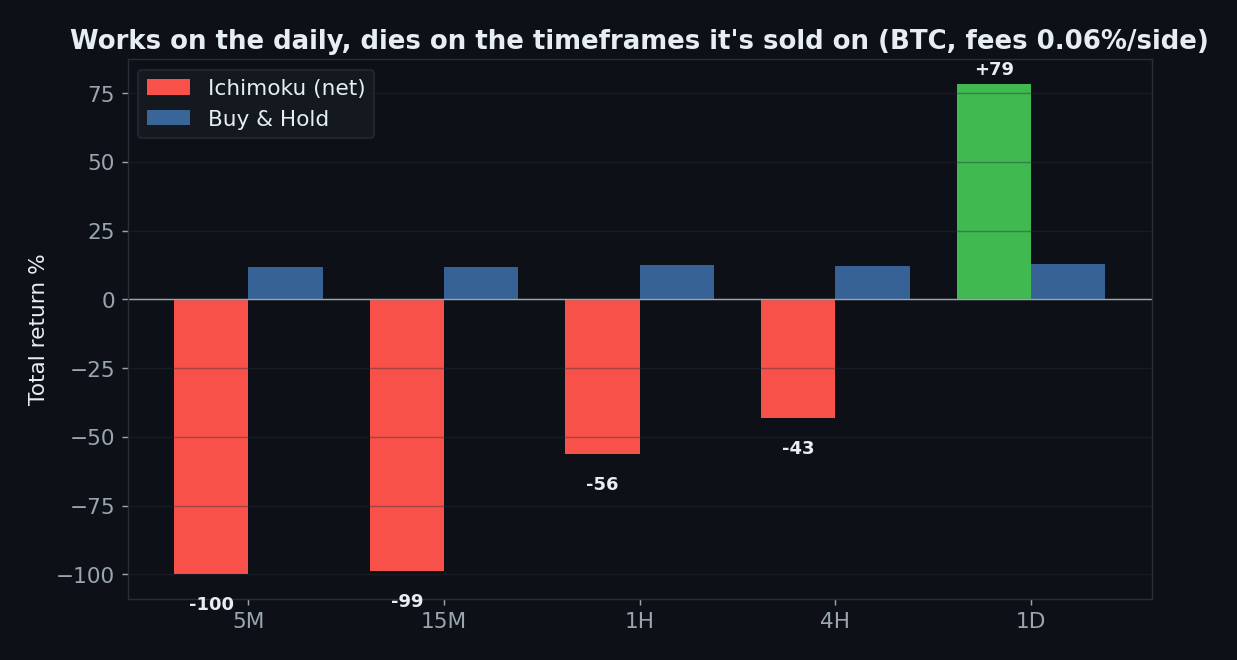
    Ichimoku net return by timeframe, plus 78 percent on daily but minus 100 on 5 minute, dies intraday

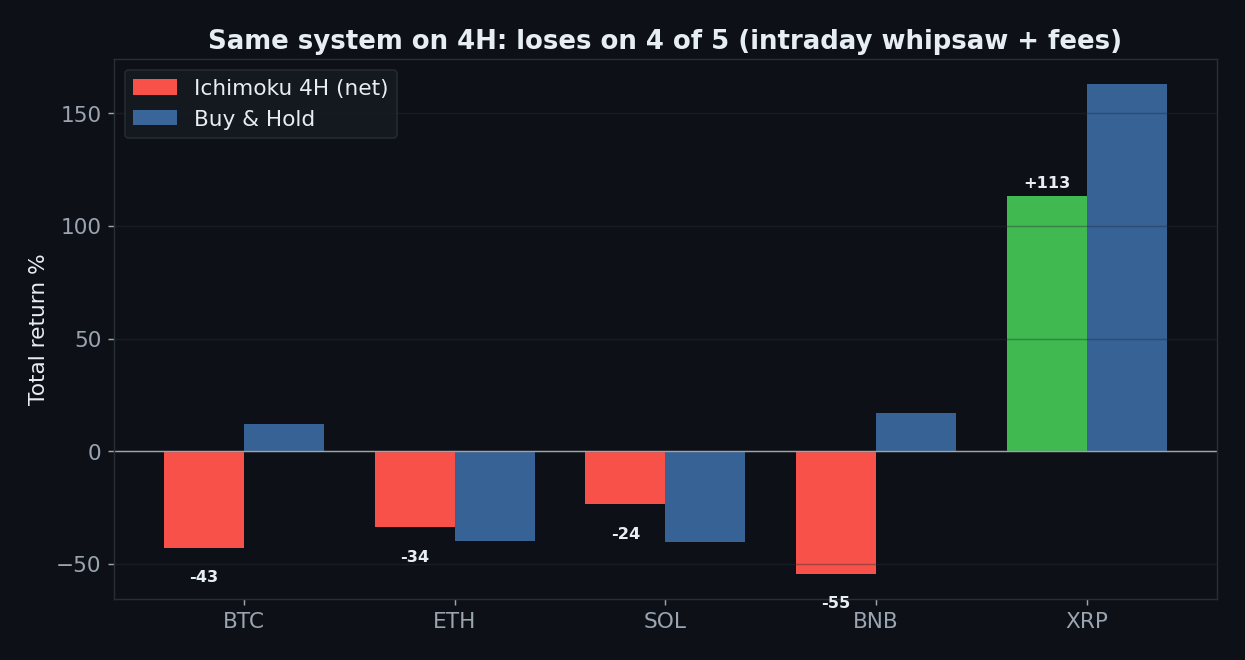
    Here’s why it’s conditional and not a clean pass. Drop below the daily and the edge inverts: 4H −43%, 1h −56%, 15m −99%, and on the 5-minute “cloud scalping” setup the videos love, −100% — the account is gone. The cloud is a slow, smoothed structure; on fast charts price chops across it constantly, and fees plus whipsaw shred you. The strategy works precisely where nobody makes hype videos (patient daily swing trading) and detonates precisely where everybody does.

    Ichimoku 4H loses on 4 of 5 coins, intraday whipsaw and fees

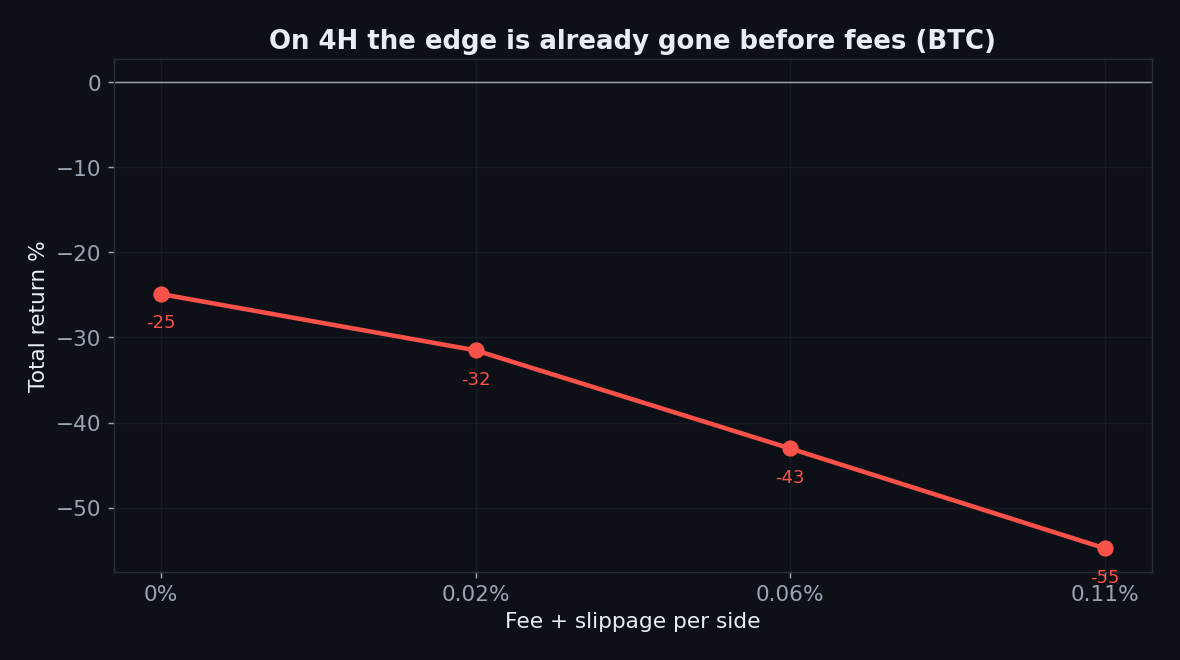
    On 4H it loses on 4 of 5 coins. And the friction test confirms the intraday version has no real edge to begin with:

    Ichimoku 4H negative even at zero fees

    −25% on BTC 4H even at zero fees. The daily edge simply does not exist on the 4-hour chart, at any cost level.

    The Verdict: CONDITIONAL

    • Gate 0 — Indicator fidelitypass (standard 9/26/52 Ichimoku with a no-look-ahead cloud)
    • Gate 1 — Sanitypass (signal on the closed bar, no look-ahead)
    • Gate 2 — Frictionfail intraday / pass daily (5m → −100%; on the daily its few trades survive fees easily)
    • Gate 3 — Yearly consistencyconditional (on the daily it captures multi-year trends in both directions; on 4H it loses)
    • Gate 4 — Out-of-samplepartial (4H out-of-sample is 3/5 positive — the least-bad intraday result on this site)
    • Gate 5 — Robustnessfail on 4H (0 of 12 Tenkan × Kijun sweep cells positive intraday)
    • Gate 6 — Multi-marketpass on daily (5/5 coins) / fail on 4H (1/5)
    • Gate 7 — vs Buy & Holdpass on daily (beats on 4/5 coins) / fail intraday

    Ichimoku’s cloud breakout is a legitimate trend-following system — on the daily. There it is profitable on every coin we tested, beats buy & hold on four of five, and behaves exactly like a trend-follower should (low win rate, high payoff). But it is marketed as an intraday “cloud scalping” tool, and on the 5-minute to 4-hour charts it ranges from a slow bleed to a full account wipe. The indicator isn’t the problem; the timeframe the internet sells it on is. Use it on the daily as a swing/trend framework, expect ~28% win rate and 25–40% drawdowns, and never take it down to the scalping charts.

    FAQ

    A 28% win rate — isn’t that terrible?
    For mean reversion, yes. For trend-following, it’s normal and fine: you lose small often and win big rarely. Judge a trend system by profit factor and return, not win rate — the exact opposite of how you’d judge Bollinger reversion.

    Why does it die on 5-minute charts?
    The cloud is a heavily smoothed, lagging structure. On fast timeframes price crosses it dozens of times a day with no follow-through, so you pay fees and whipsaw on hundreds of fake breakouts. Trend tools need room to trend.

    Would the full alignment (TK cross + Chikou + future cloud) do better?
    On 4H, the TK-cross and full-alignment variants were also negative (−9% and −18%). Adding conditions didn’t rescue the intraday version; the timeframe is the deciding variable, not the filter stack.

    Can I replicate this?
    Yes — standard 9/26/52 Ichimoku, public Binance data, 0.06%/side. Daily cloud breakout, five coins.

    See also our one other conditional pass, VWAP trend-pullback, and the rejects: UT Bot, Lorentzian, Bollinger reversion.


    Disclaimer: educational research, not financial advice. Past performance does not guarantee future results. Never trade money you cannot afford to lose.
  • Bollinger Band Strategy Backtest: the 60-77% Win Rate That Loses on Every Coin

    Bollinger Band Strategy Backtest: the 60-77% Win Rate That Loses on Every Coin

    Bollinger Bands are the first indicator almost everyone learns, and the pitch is irresistibly simple: price is “cheap” at the lower band and “expensive” at the upper band, and it always snaps back to the mean. So you buy the lower band, sell the upper band, and collect. It even feels right — the win rate is high, the little green wins pile up. We ran the classic band-reversion through the full 7-Gate Protocol on 2 years, 5 coins and 5 timeframes. It is a reject, and it’s a perfect case study in why win rate is the most dangerous number in trading.

    Gate 00 — Fidelity (the easy one)

    No machine learning here. A Bollinger Band is a 20-period simple moving average plus/minus two population standard deviations — identical to TradingView’s ta.bb. There is nothing to reimplement incorrectly. The interesting question isn’t whether the bands are right; it’s whether reverting to them makes money.

    The Exact Rules

    • Bands: SMA(20) ± 2× standard deviation (the universal default)
    • Entry: go long when the close is below the lower band; go short when the close is above the upper band
    • Exit: close the position when price reverts to the middle band (the SMA)
    • Execution: signal on the bar close, enter at that close; costs 0.06%/side; data Binance spot Jul 2024–Jul 2026, BTC/ETH/SOL/BNB/XRP, 5m–1D; benchmark buy & hold
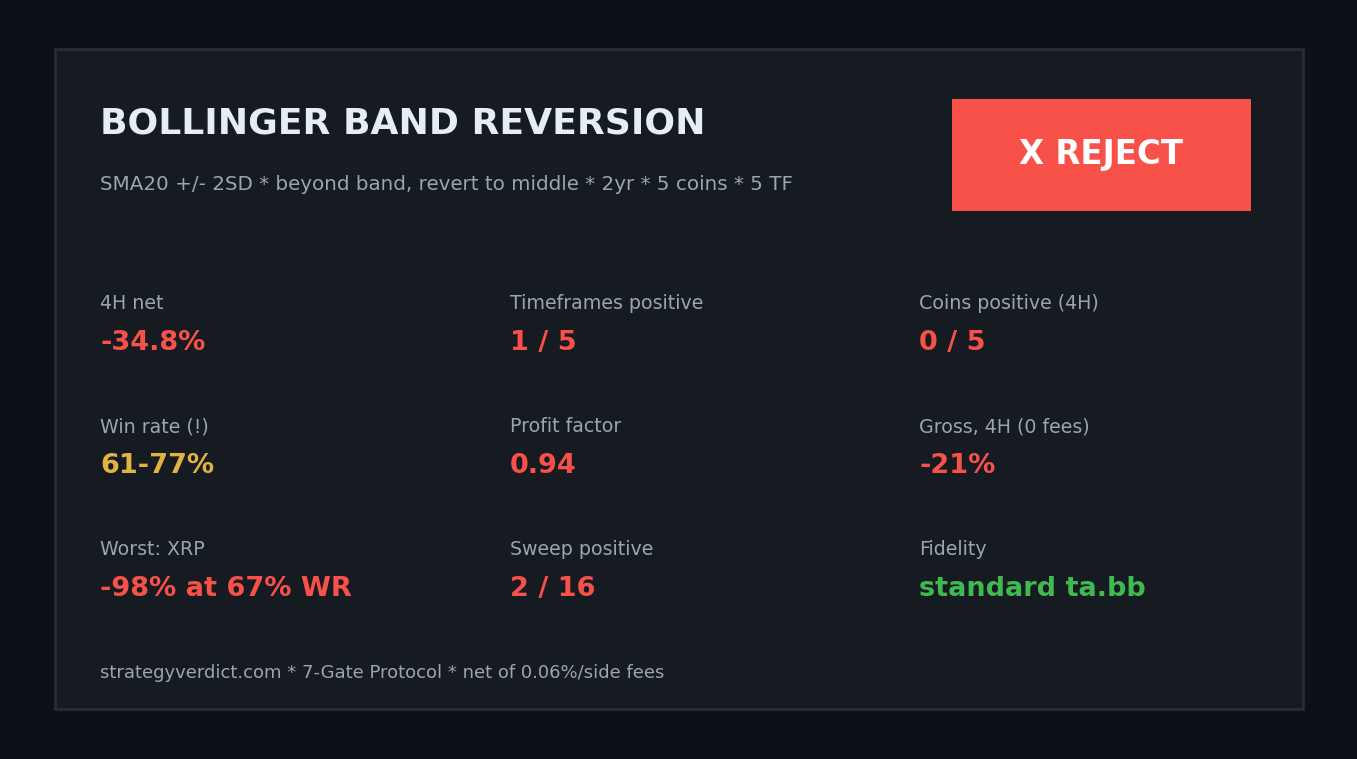
    Bollinger band reversion 7-gate verdict tearsheet reject, high win rate but loses on all coins

    The win-rate trap

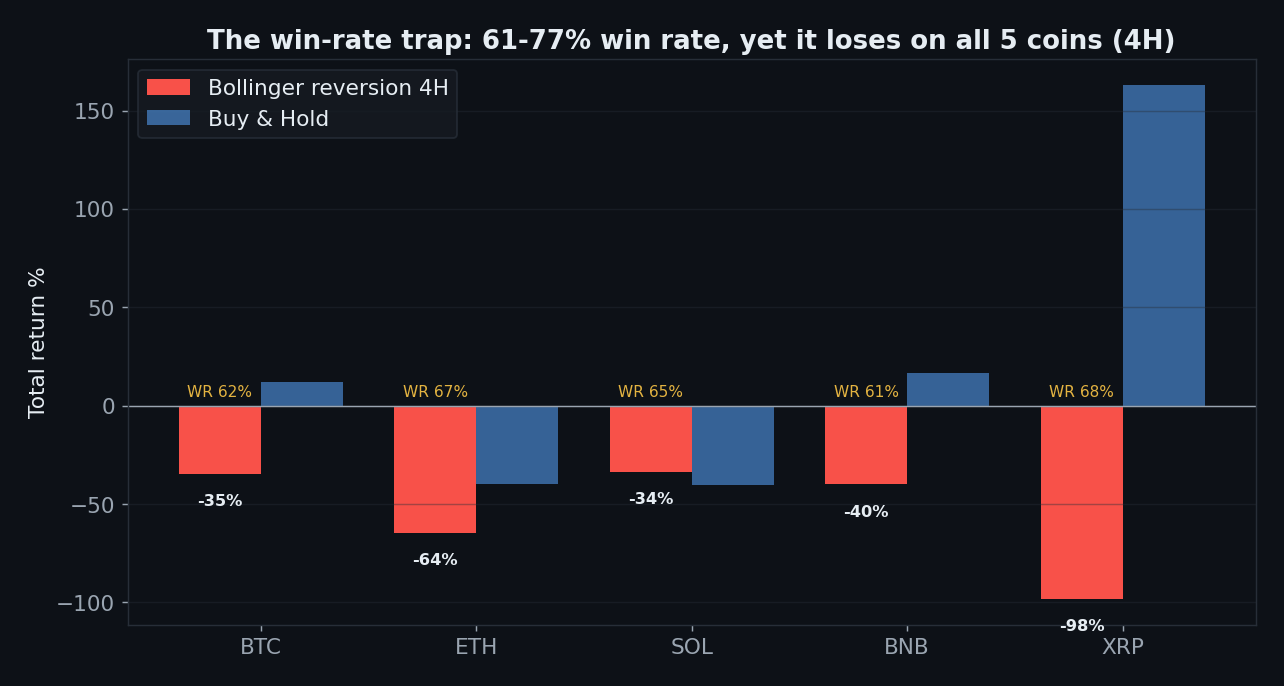
    Bollinger reversion five coins 4H, 61 to 77 percent win rate yet loses on all five, XRP -98 percent

    Look at the win rates: 61% to 77% across all five coins. Textbook “high probability.” And yet it loses money on all five. The worst is XRP: a 67.5% win rate and a −98% return — nearly a wipeout. This is the whole lesson of mean reversion: you win often and small (price nudges back to the mean), then lose rarely and enormously (a trend runs and never reverts). A high win rate tells you how often you win, not how much — and here the maths is upside down.

    Why it bleeds: it fights every trend

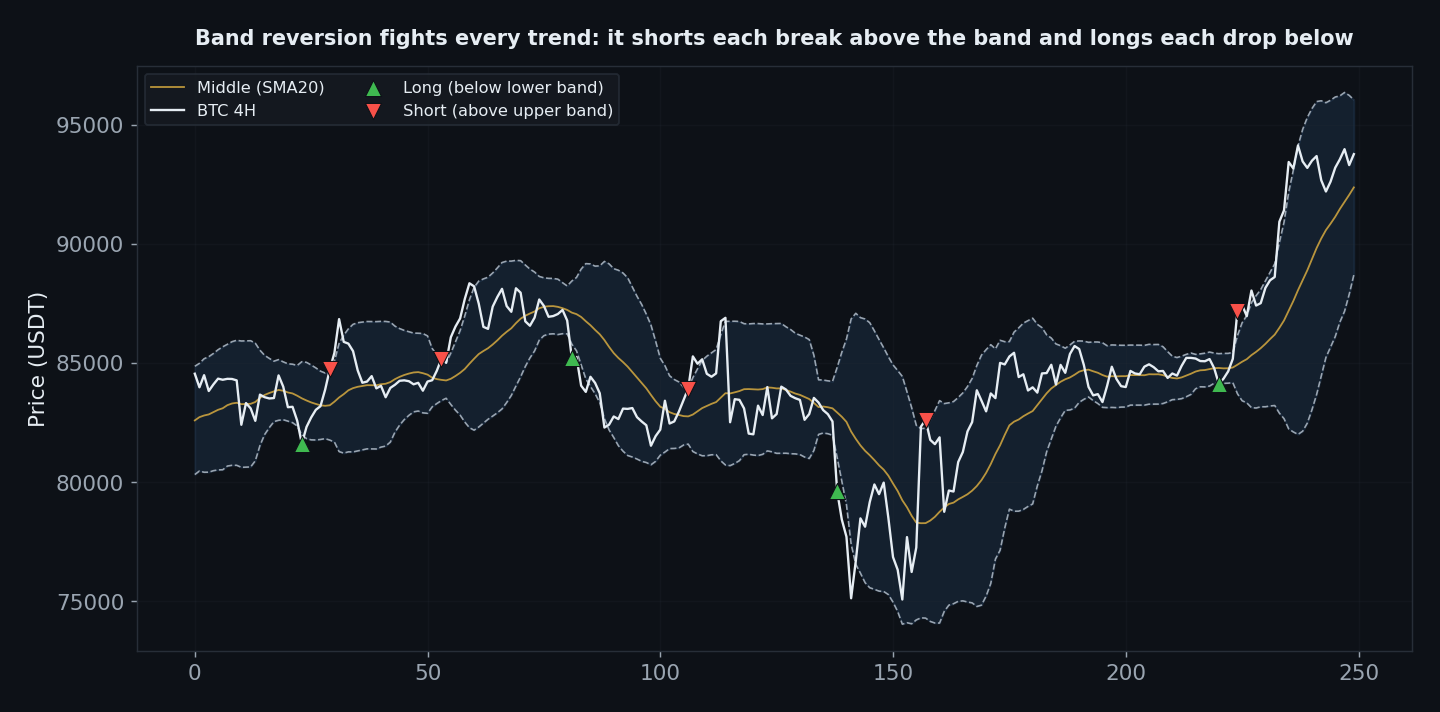
    Bollinger band reversion on BTC 4H fights every trend, shorts breaks above the band and longs drops below

    By construction, band-reversion does the exact opposite of trend-following. Every time price breaks above the upper band — the start of many real rallies — it goes short. Every time price craters below the lower band — the middle of many real crashes — it goes long, catching the falling knife. In a ranging market that’s fine. Crypto over 2024–26 was anything but ranging, and the strategy spent two years standing in front of freight trains.

    Gate 06a — Every Timeframe

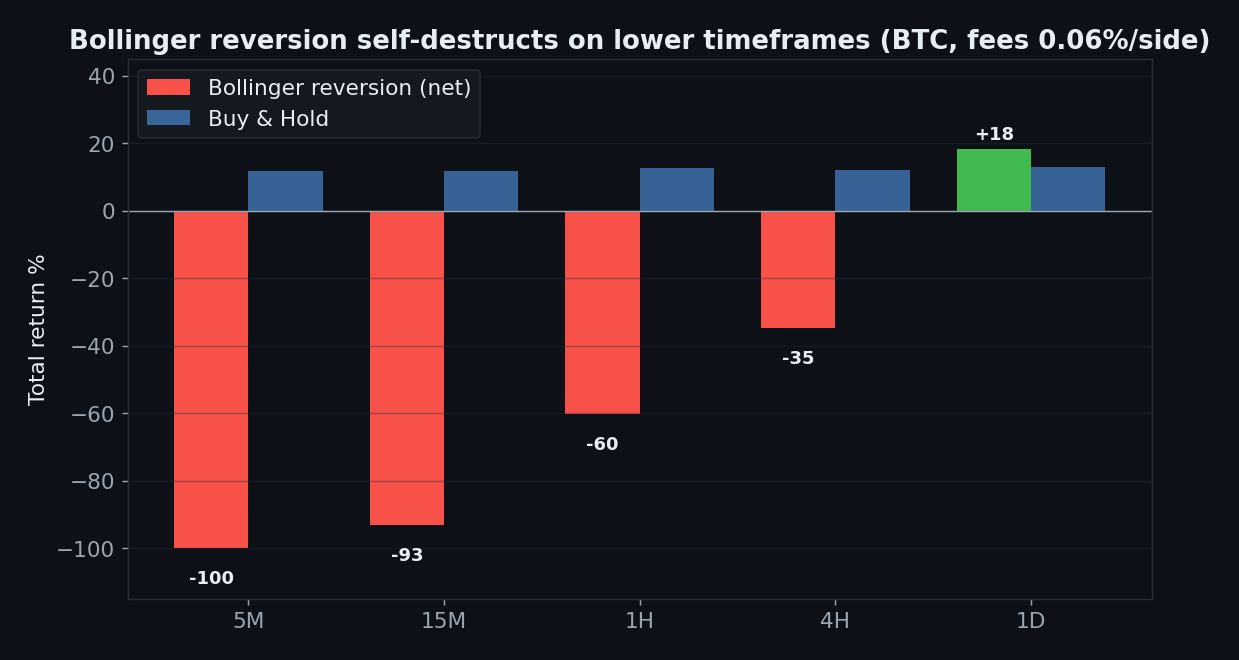
    Bollinger reversion net return by timeframe, self-destructs on lower timeframes, only daily positive

    On the timeframes the “scalping” clips love, it detonates: 5-minute bars → −100% (7,600 trades, account gone), 15m → −93%, 1h → −60%, 4h → −35%. Only the daily squeaks out +18% (30 trades, one symbol) — the familiar pattern where a strategy only survives where it barely trades.

    Gate 02 — Friction

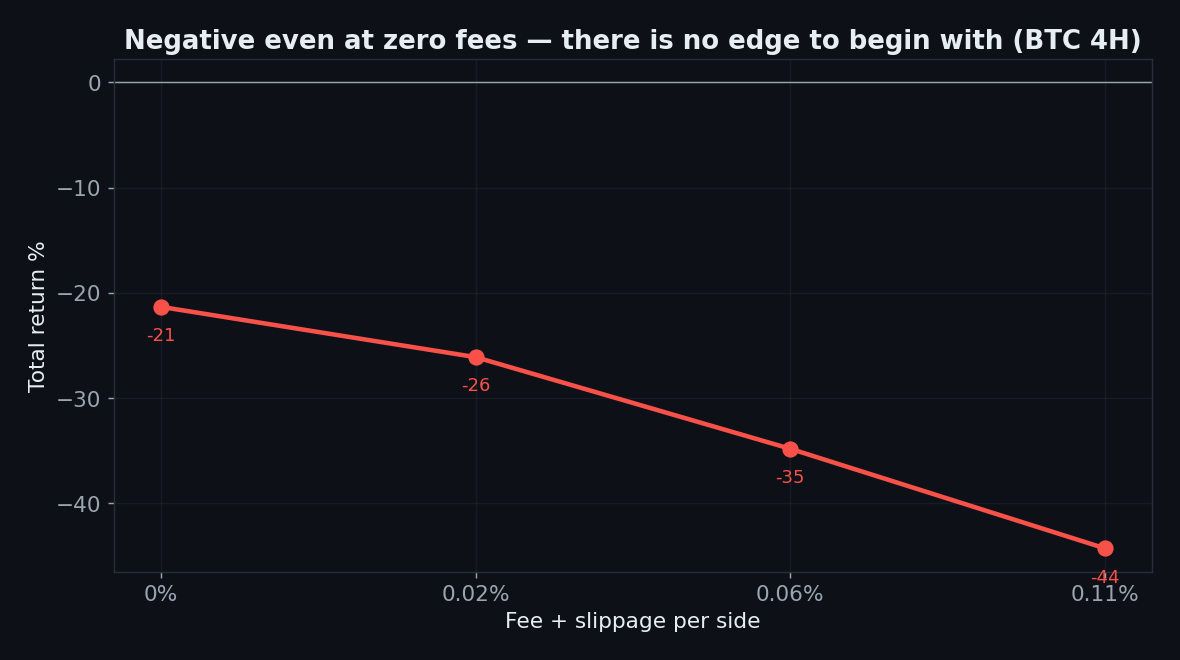
    Bollinger reversion BTC 4H negative even at zero fees, no edge

    Here’s the tell that separates this from a merely fee-sensitive strategy: on BTC 4H it is negative even with zero fees (−21%). There is no gross edge for costs to erode — the reversion premise itself is a loser in a trending asset. Fees just deepen the hole.

    Gate 05 — Parameter Robustness

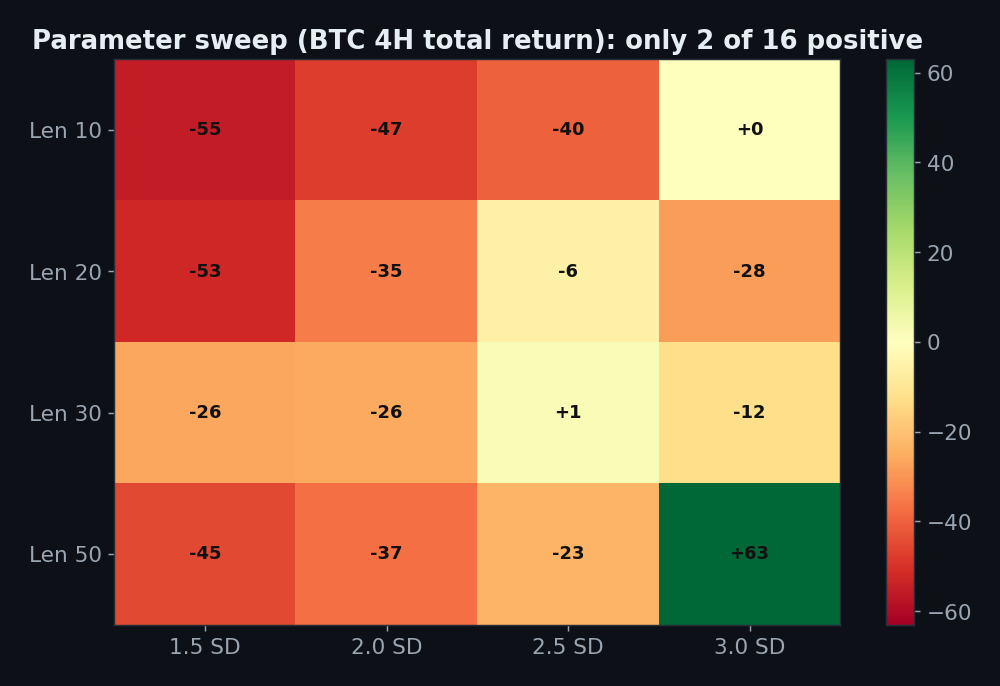
    Bollinger length by standard deviation parameter sweep, only 2 of 16 positive

    Maybe a different length or band width rescues it? We swept SMA length (10–50) against band width (1.5–3.0 SD): 2 of 16 combinations positive. There is no robust setting — only a couple of lucky cells.

    Gate 04 — Out-of-Sample

    Bollinger reversion out of sample 4H mostly losses no persistent edge

    Split 18 months in / 6 months out: mostly losses, only 2 of 5 coins positive out-of-sample, profit factors flipping across the boundary. Nothing stable to carry forward.

    The Verdict: REJECT

    • Gate 0 — Indicator fidelitypass (standard SMA(20) ± 2 standard deviations, identical to TradingView’s ta.bb)
    • Gate 1 — Sanitypass (signal on the closed bar, no look-ahead)
    • Gate 2 — Frictionfail (negative even at zero fees on 4H — there is no gross edge to erode)
    • Gate 3 — Yearly consistencyfail (unstable; it only survives in ranging stretches, not trending years)
    • Gate 4 — Out-of-samplefail (2/5 positive out-of-sample)
    • Gate 5 — Robustnessfail (only 2 of 16 length × band-width cells positive)
    • Gate 6 — Multi-marketfail (loses money on all 5 coins; XRP −98% at a 67% win rate)
    • Gate 7 — vs Buy & Holdfail (a 61–77% win rate and still behind simply holding)

    “Buy the lower band, sell the upper band” has a 60–77% win rate and loses money on every coin we tested. The high win rate is exactly the trap: it hides the rare, ruinous losses that happen when a trend refuses to revert. Mean reversion is not wrong as a concept — but naked band-reversion, with no regime filter, in a trending market, is a slow-motion blow-up. XRP: 67% winners, −98% equity.

    FAQ

    Doesn’t it work with an ADX / regime filter?
    Possibly — mean reversion is meant for ranging markets, and an ADX gate to sit out trends is the standard fix. But that is a different, more complex strategy, and choosing the filter after seeing the results is curve-fitting. The point of this test is the version that’s actually taught to beginners: bands only.

    How can a 77% win rate lose money?
    Because average win << average loss. You bank many tiny reversions and occasionally hold a losing position all the way through a trend. Win rate without payoff ratio is meaningless.

    Can I replicate this?
    Yes — SMA(20) ± 2SD, public Binance data, 0.06%/side. Every number falls out of those inputs.

    See also: RSI 30/70 (the other high-win-rate mean-reversion trap), Lorentzian Classification, UT Bot, and VWAP pullback (our one conditional pass).


    Disclaimer: educational research, not financial advice. Past performance does not guarantee future results. Never trade money you cannot afford to lose.
  • Lorentzian Classification Backtest: the ‘AI’ Indicator That Barely Trades

    Lorentzian Classification Backtest: the ‘AI’ Indicator That Barely Trades

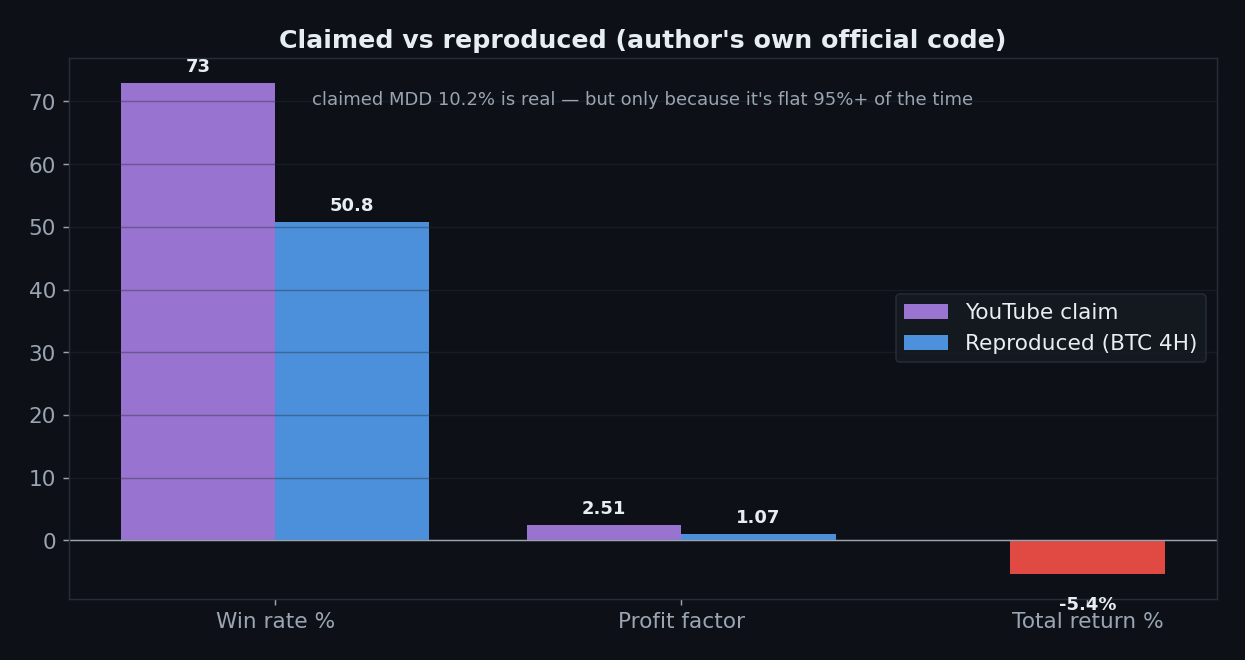
    If UT Bot is the plumber of trading indicators, Lorentzian Classification is the astronaut. It is the single most-hyped “AI / machine-learning” indicator on TradingView — jdehorty’s open-source publication was voted TradingView’s Most Valuable Pine Script of 2023 — and the YouTube pitch is intoxicating: a k-nearest-neighbours classifier that “learns” historical market states and predicts the next move. The headline claim making the rounds: 73% win rate, 2.51 profit factor, 10.2% max drawdown.

    We ran it through the full 7-Gate Protocol on 2 years of Binance data, 5 coins and 5 timeframes. It is a reject. And this time the fidelity question answers itself.

    Gate 00 — We used the author’s own official code

    Reimplementing a machine-learning indicator invites exactly one criticism: “you coded it wrong.” So we removed that possibility entirely. In 2024 jdehorty officially ported his own indicator to Python (the open-source advanced-ta package). We fed our Binance candles straight into his classifier and traded his buy/sell signals. There is no reimplementation to get wrong — the signals are, by construction, the ones his TradingView indicator produces.

    The Exact Setup

    • Indicator: Machine Learning: Lorentzian Classification (jdehorty), default settings — 5 features (RSI, WaveTrend, CCI, ADX), Lorentzian-distance k-NN, default volatility/regime/ADX filters
    • Trades: the indicator’s own startLongTrade / startShortTrade / exit signals (default dynamic 4-bar exit)
    • Execution: enter/exit on the signal bar’s close — no look-ahead
    • Costs: 0.06% per side; Data: Binance spot, Jul 2024–Jul 2026, BTC/ETH/SOL/BNB/XRP, 5m–1D; Benchmark: buy & hold
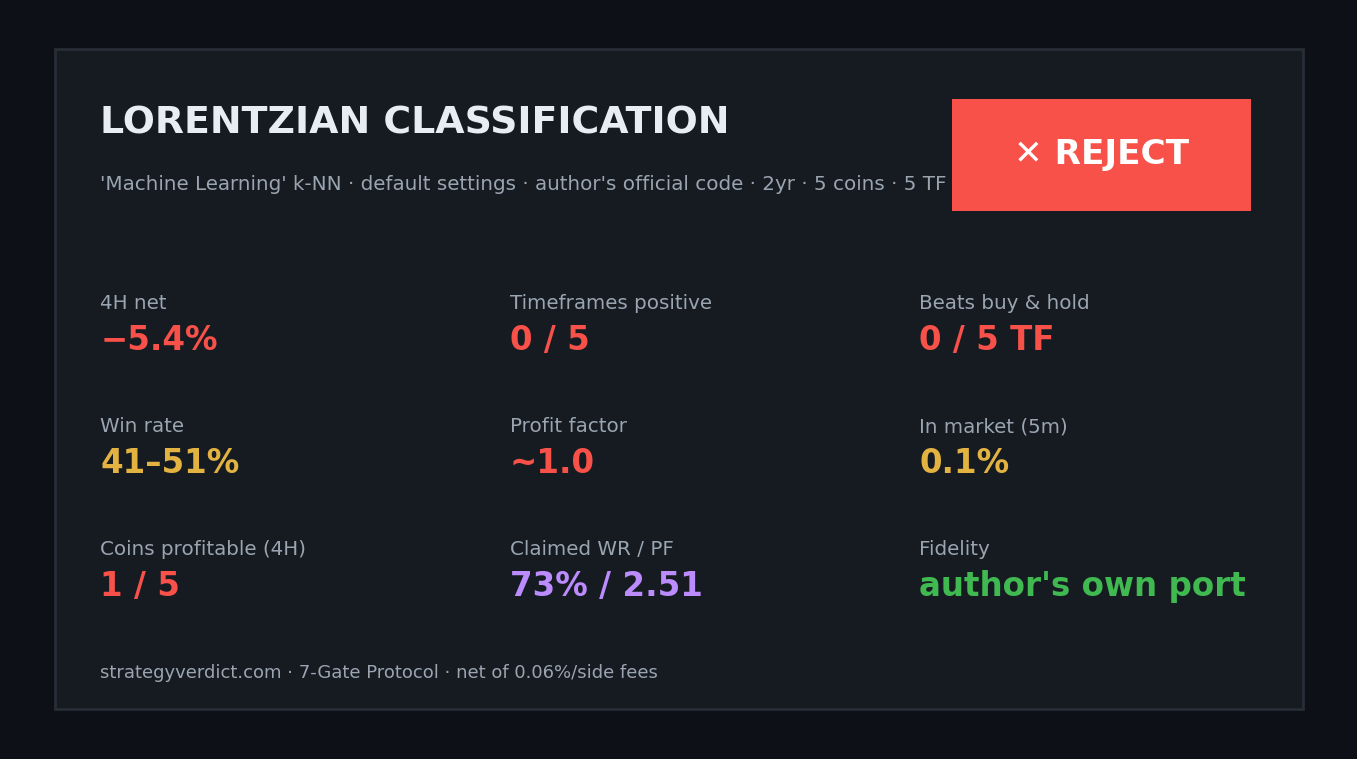
    Lorentzian Classification 7-gate verdict tearsheet, reject, all timeframes negative, barely trades

    The verdict in one chart: it barely trades

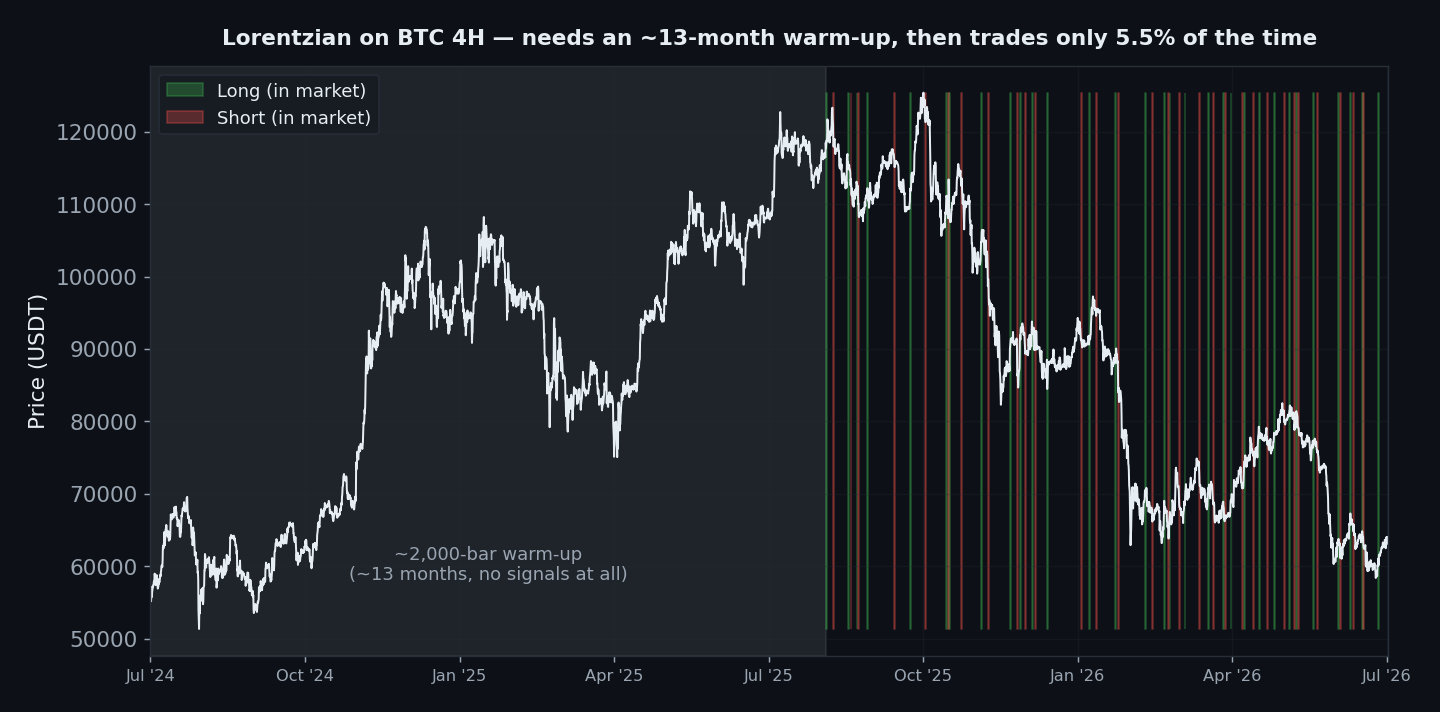
    Lorentzian Classification on BTC 4H, 13-month warm-up then in the market only 5.5% of the time, sparse long short shading

    Here is the whole story. Before it fires a single signal, Lorentzian needs a ~2,000-bar warm-up — about 13 months on the 4-hour chart (and, absurdly, 5+ years on the daily). After that it is in the market roughly 5.5% of the time; the rest is cash. That is the secret behind the “low drawdown” everyone screenshots: you cannot lose much when you almost never have a position. You also cannot win.

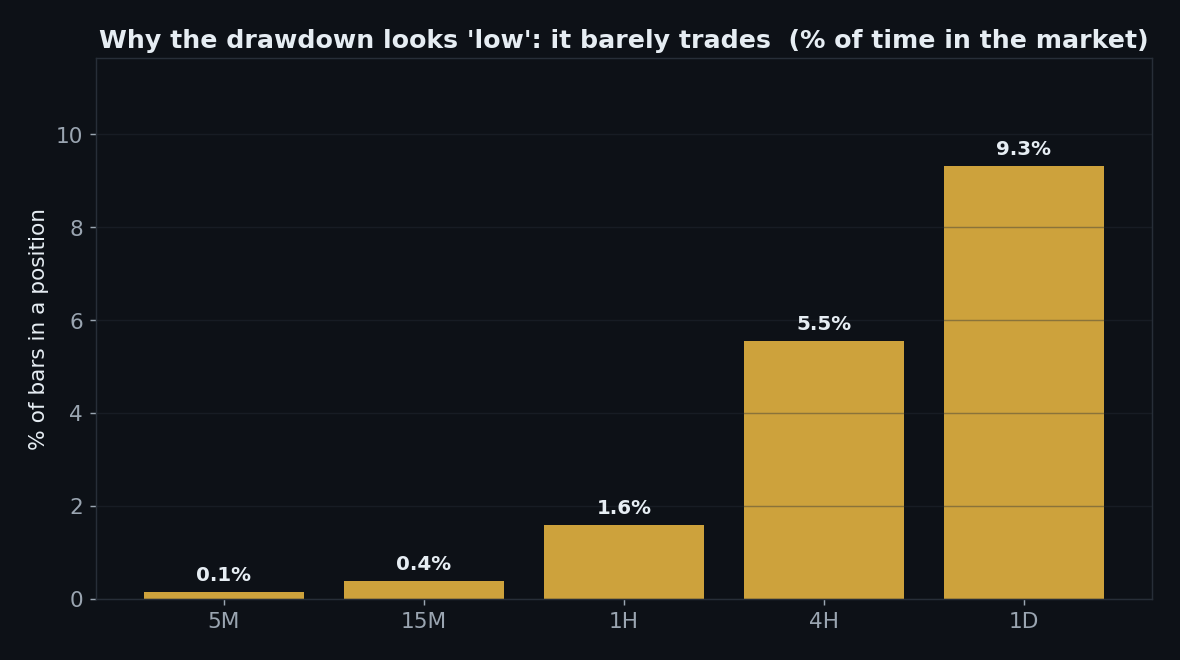
    Lorentzian percent of time in the market by timeframe, 0.1 percent on 5m, why drawdown looks low

    Drop to the timeframe the scalping videos love and it gets sillier: on 5-minute bars the strategy holds a position 0.1% of the time — effectively never — and still finishes down 8.8%.

    Gate 06a — Every Timeframe

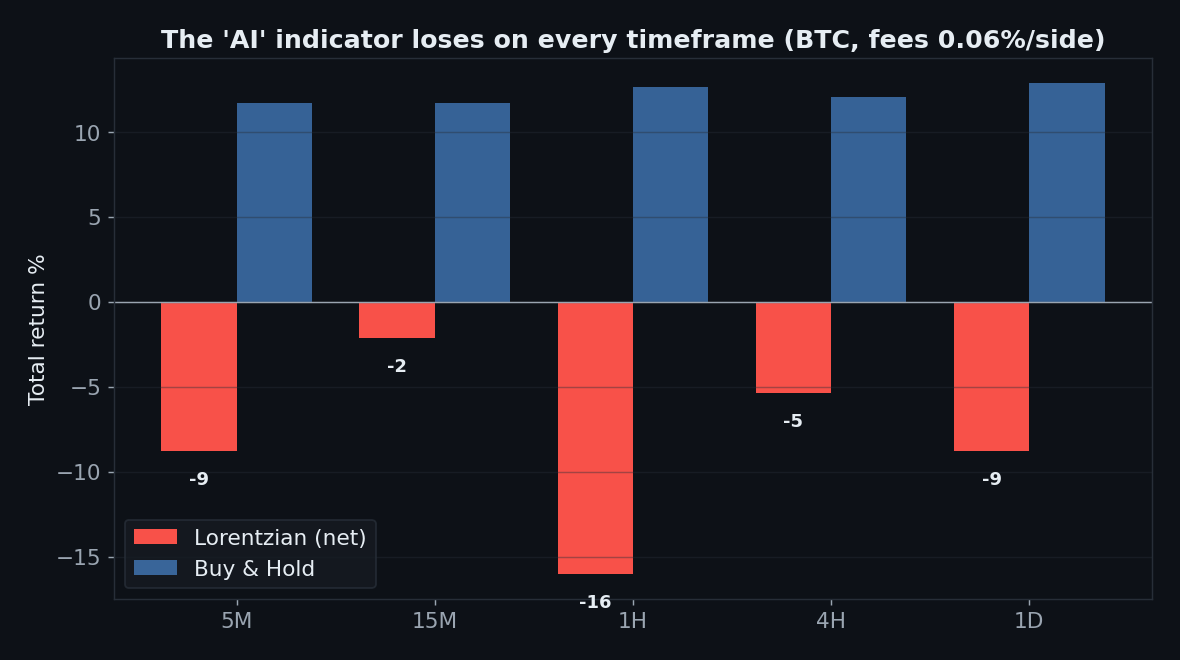
    Lorentzian net return by timeframe, all five negative, loses to buy and hold on every timeframe, BTC

    Five timeframes, five losses, and it loses to buy & hold on every single one: 5m −8.8%, 15m −2.1%, 1h −16.0%, 4h −5.4%, 1d −8.8% — versus B&H around +12% throughout. The much-advertised “AI edge” does not appear on any resolution.

    Claim vs. reality

    Lorentzian claimed 73 percent win rate 2.51 profit factor vs reproduced 50.8 percent 1.07 negative return

    The screenshotted numbers do not reproduce. Claimed 73% win rate → measured 50.8% (BTC 4H, its best). Claimed PF 2.51 → measured 1.07. The only claim that survives is the low drawdown — and we’ve already seen why that one is an artifact of near-zero market exposure, not skill.

    Gate 02 — Friction

    The gross edge is wafer-thin. With zero fees the BTC 4H strategy makes +1.8%; at a realistic 0.06% per side it is −5.4%; at 0.11% it’s −11%. Whatever tiny signal exists is smaller than the cost of acting on it.

    Gate 06b — Five Coins

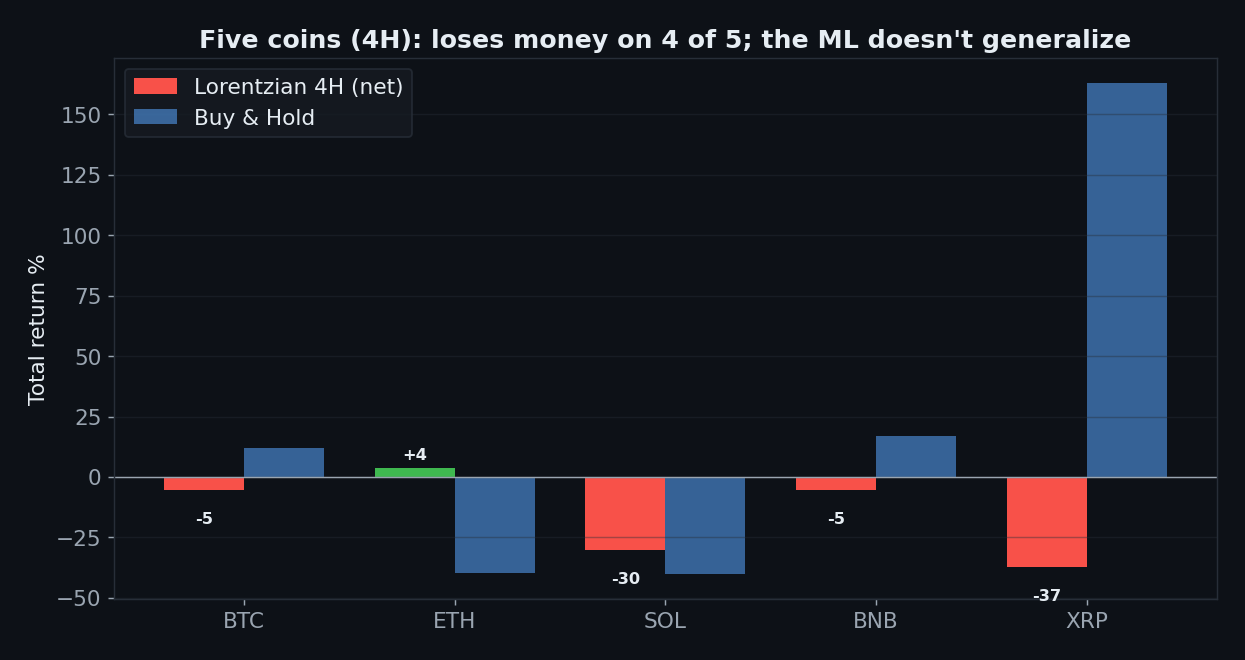
    Lorentzian on five coins 4H, loses money on four of five, machine learning does not generalize

    On the 4-hour chart it loses money on 4 of 5 coins (ETH +3.7% is the lone positive; SOL −30%, XRP −37%). A classifier that “learned” the market should generalize across similar liquid assets. This one does not.

    Gate 04 — Out-of-Sample

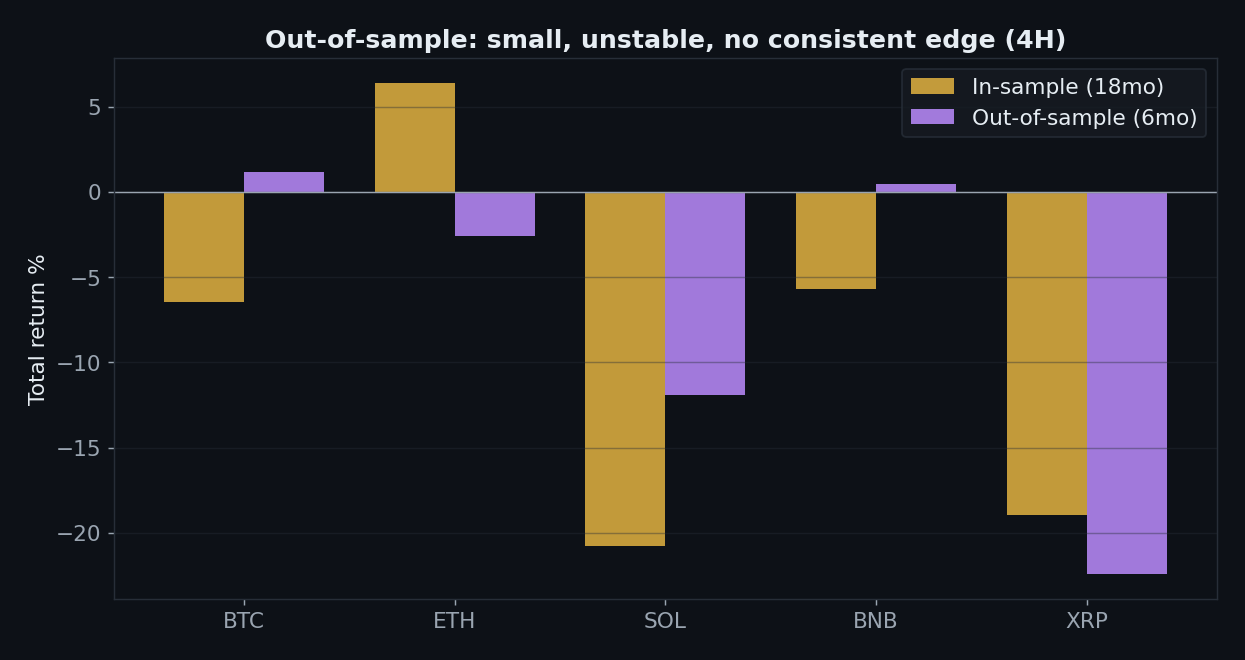
    Lorentzian out of sample 4H, small unstable no consistent edge

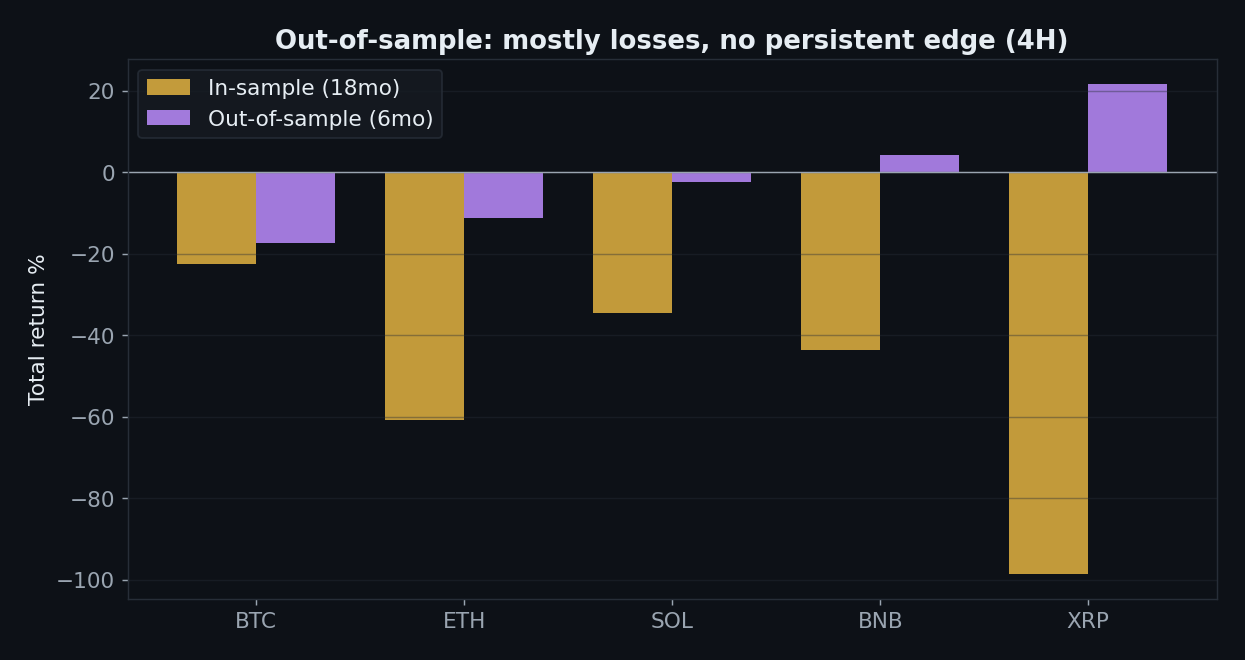
    Split 18 months in / 6 months out and the results are small and unstable — only 2 of 5 coins positive out-of-sample, with profit factors flopping across the split. There is no persistent edge to carry forward.

    What the equity curve actually looks like

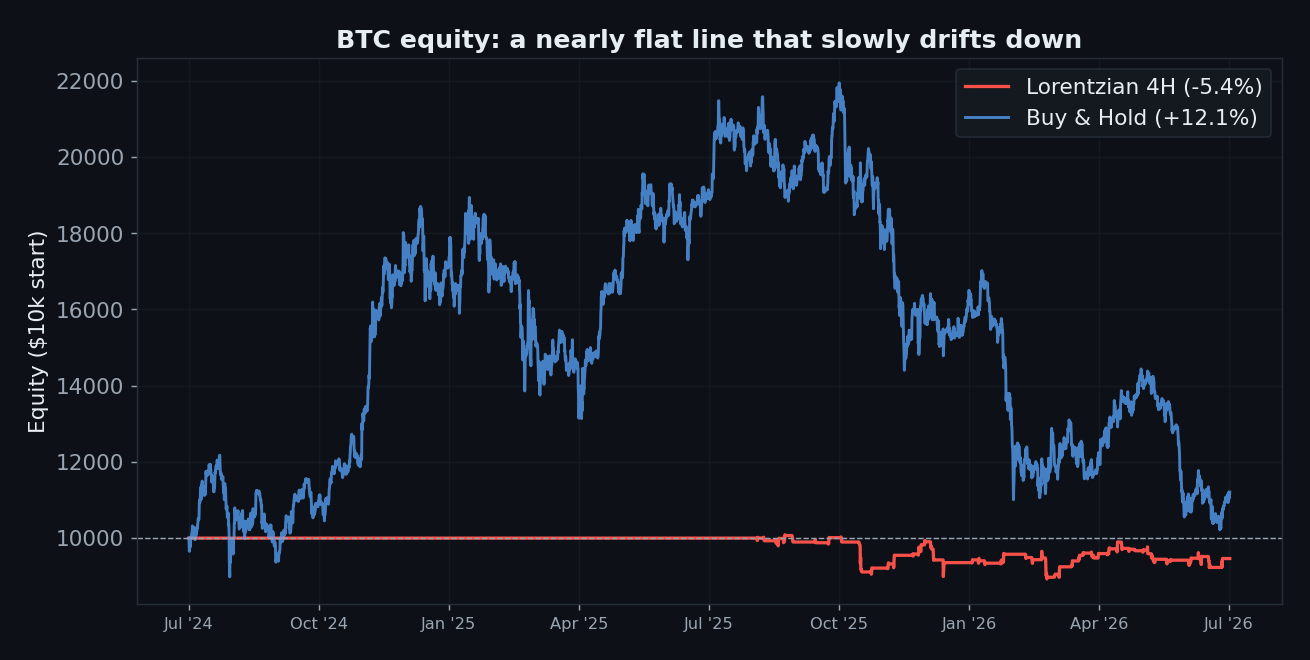
    Lorentzian BTC equity curve nearly flat drifting down versus buy and hold

    Not a crash, not a moonshot — a nearly flat line that slowly drifts downward. That is the honest portrait of “AI-powered price prediction” once you pay real fees and stop cherry-picking the window.

    The Verdict: REJECT

    • Gate 0 — Indicator fidelitypass (we ran the author’s own official Python port, so the signals are his indicator’s by construction)
    • Gate 1 — Sanitypass (signals on closed bars, no look-ahead)
    • Gate 2 — Frictionfail (+1.8% gross → −5.4% net on 4H)
    • Gate 3 — Yearly consistencyfail (no consistently positive year; it barely holds a position)
    • Gate 4 — Out-of-samplefail (2/5 positive out-of-sample)
    • Gate 5 — Robustnessfail (defaults; the multi-coin and out-of-sample results show nothing stable to tune)
    • Gate 6 — Multi-marketfail (loses on 4 of 5 coins; 0 of 5 timeframes positive)
    • Gate 7 — vs Buy & Holdfail (behind buy & hold on every timeframe)

    The most celebrated “machine-learning” indicator in retail trading, run through its creator’s own official code, produces a flat line that quietly loses to holding. Its famous low drawdown isn’t skill — it’s the by-product of a strategy that needs a year of warm-up and then sits in cash 95% of the time. “AI predicts the market” makes a great thumbnail. It does not make an edge.

    FAQ

    Isn’t Lorentzian Classification a serious, well-built indicator?
    Yes — it’s genuinely clever engineering and deservedly won Most Valuable Pine Script. “Well-built” and “profitable to trade” are different questions. We only measured the second one.

    Maybe you used the wrong settings?
    We used the defaults, and we used the author’s own port. You can change features and filters, but that’s parameter-mining after the fact — and the multi-coin, out-of-sample results already show nothing stable to mine.

    What about the low 10% drawdown?
    Real, and meaningless: it comes from being in the market ~5% of the time (0.1% on 5m). Cash has a 0% drawdown too.

    Can I replicate this?
    Completely. Public Binance OHLCV, advanced-ta defaults, 0.06%/side. We didn’t hand-build the indicator — the person who invented it did.

    See also: UT Bot, Triple SuperTrend, Golden Cross, RSI 30/70, and VWAP pullback (our one conditional pass).


    Disclaimer: educational research, not financial advice. Past performance does not guarantee future results. Never trade money you cannot afford to lose.
  • UT Bot Alerts Backtest: ‘5-Minute Easy Profits’ on 5 Coins and 5 Timeframes

    UT Bot Alerts Backtest: ‘5-Minute Easy Profits’ on 5 Coins and 5 Timeframes

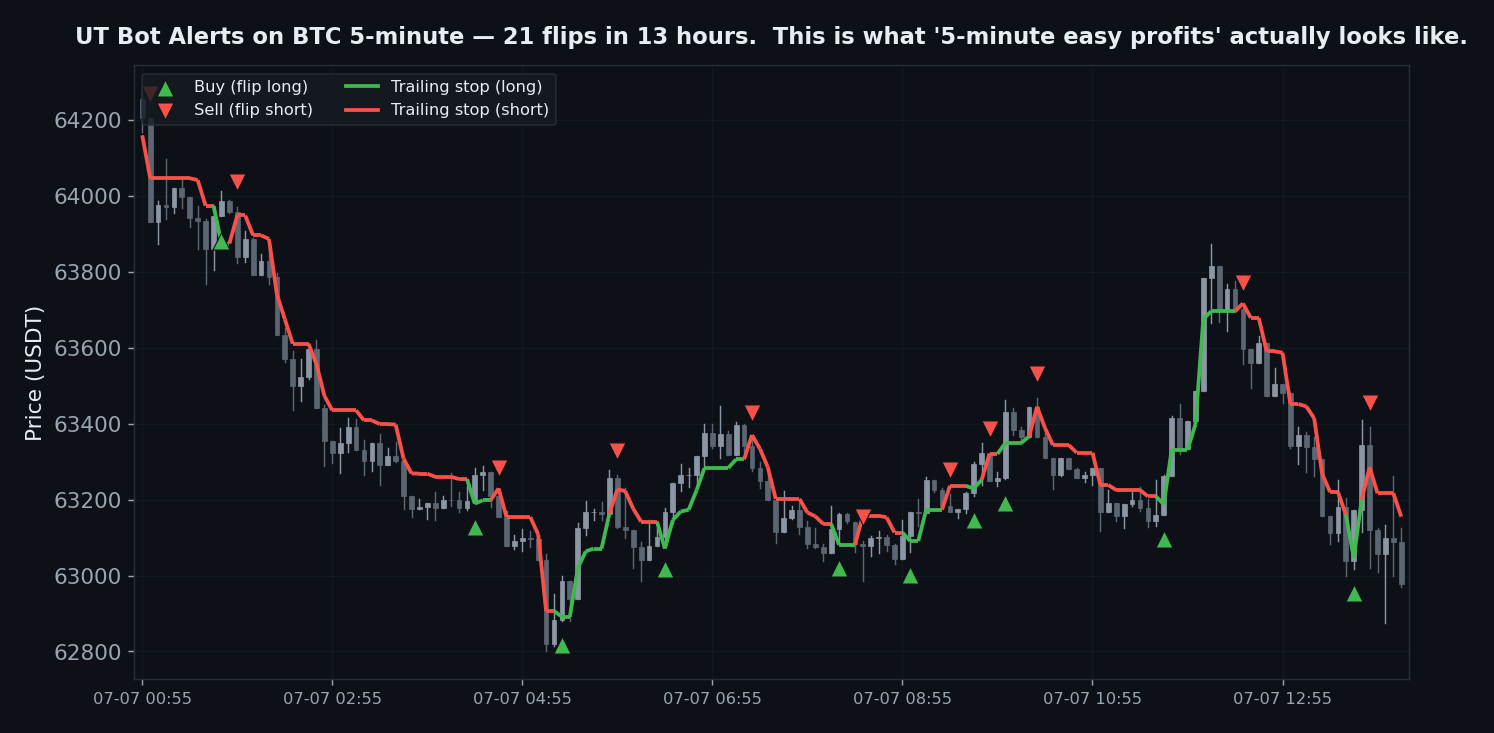
    UT Bot Alerts is one of the most-screenshotted indicators on trading YouTube. “UT Bot makes crazy profits.” “The only indicator you need.” “5-minute easy money.” It is an ATR trailing-stop that paints a green “Buy” when price crosses above the stop and a red “Sell” when it crosses below — a clean, hypnotic flip-flop that looks unbeatable in a cherry-picked clip.

    We ran it through the full 7-Gate Protocol: 2 years of Binance data, 5 liquid coins, 5 timeframes from 5-minute to daily, a parameter sweep, an out-of-sample split, and two popular variants (Heikin-Ashi, EMA-200 filter). The verdict is reject — but the reason is genuinely interesting, and this time we begin by doing something most “backtest” videos never do: proving our indicator is bit-for-bit the real one.

    Gate 00 — First, we proved the indicator is real

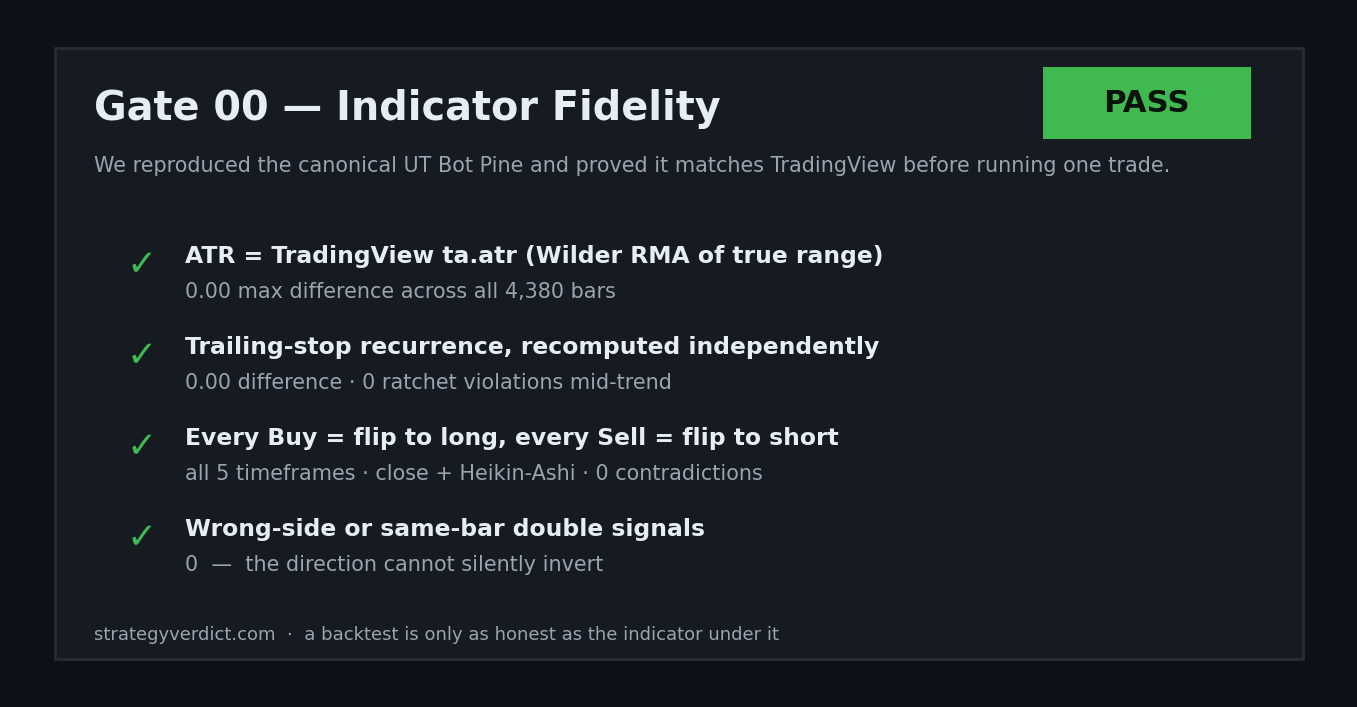
    A backtest is worthless if the indicator underneath it doesn’t match what you actually see on TradingView. A single flipped comparison and your “short” becomes a “long” — the numbers look real but describe a strategy nobody trades. So before judging UT Bot, we reimplemented the canonical UT Bot Alerts Pine Script line-for-line and verified it three independent ways:

    • ATR match: our ATR equals TradingView’s ta.atr (Wilder RMA of true range) to 0.00 over all 4,380 bars — not “close”, identical.
    • Trailing-stop recurrence: the stop, recomputed by a second independent method, matches the engine to 0.00; and the stop never loosens mid-trend (0 ratchet violations) — the defining property of UT Bot.
    • No silent long/short inversion: across every timeframe and both close and Heikin-Ashi modes, every Buy coincides exactly with a flip to long and every Sell with a flip to short — zero same-bar contradictions, zero “wrong-side” signals. The direction is structurally incapable of inverting.

    Only after that check did we let it trade. Every number below rests on an indicator we can prove is the real thing.

    UT Bot indicator fidelity scorecard: ATR 0.00 diff over 4380 bars, trailing stop 0 diff, no long/short inversion, verification pass

    The Exact Rules

    • Indicator: UT Bot Alerts, default Key Value = 1, ATR Period = 10, source = close
    • Signal: price crosses above the ATR trailing stop → go long; crosses below → go short. It is always in the market (stop-and-reverse)
    • Execution: signal on the bar close, enter at that close — no look-ahead
    • Costs: 0.06% per side (fees + slippage), on every entry and exit
    • Data: Binance spot, Jul 2024 – Jul 2026, BTC/ETH/SOL/BNB/XRP, 5m–1D
    • Benchmark: buy & hold over the identical window
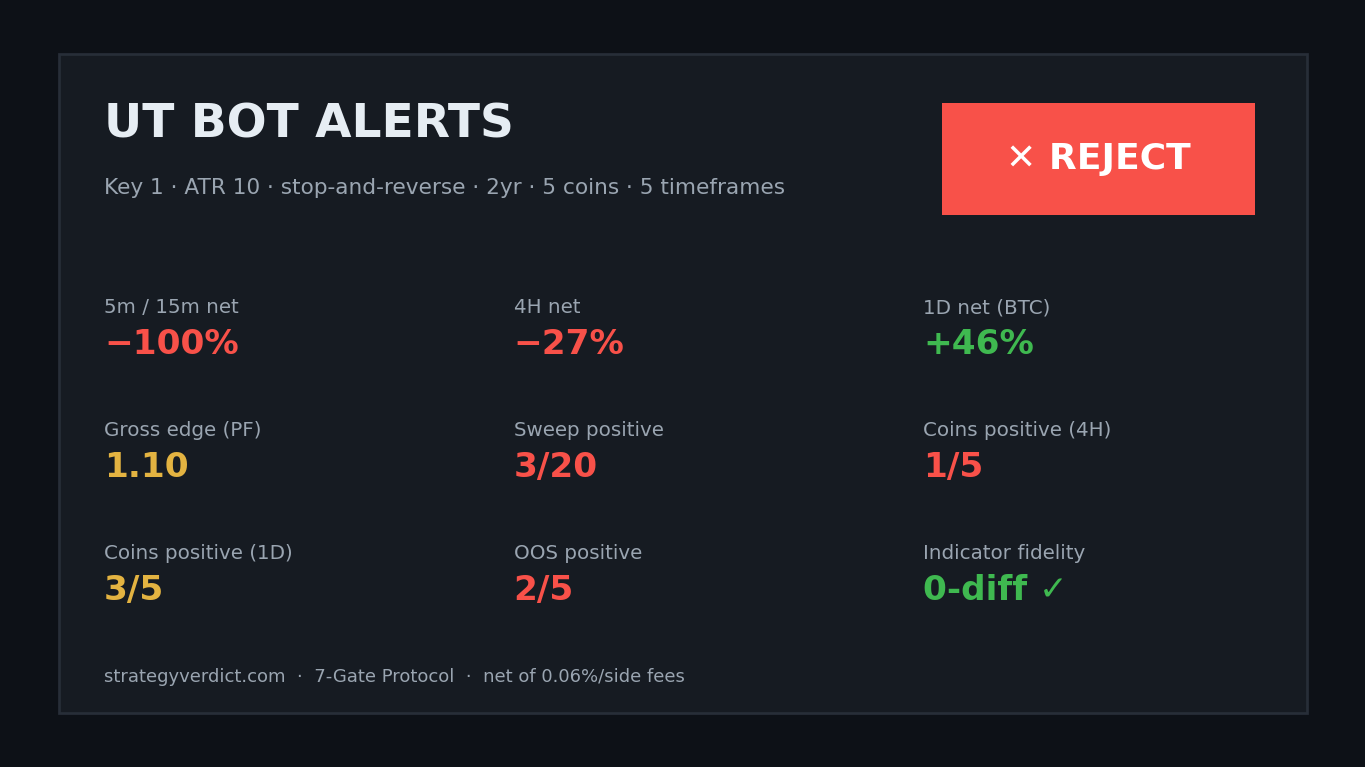
    UT Bot Alerts 7-gate verdict tearsheet, reject, BTC 2 years, key 1 ATR 10

    Gate 06a — Every Timeframe (the whole story)

    UT Bot net return by timeframe, 5m and 15m minus 100 percent, only daily positive, BTC

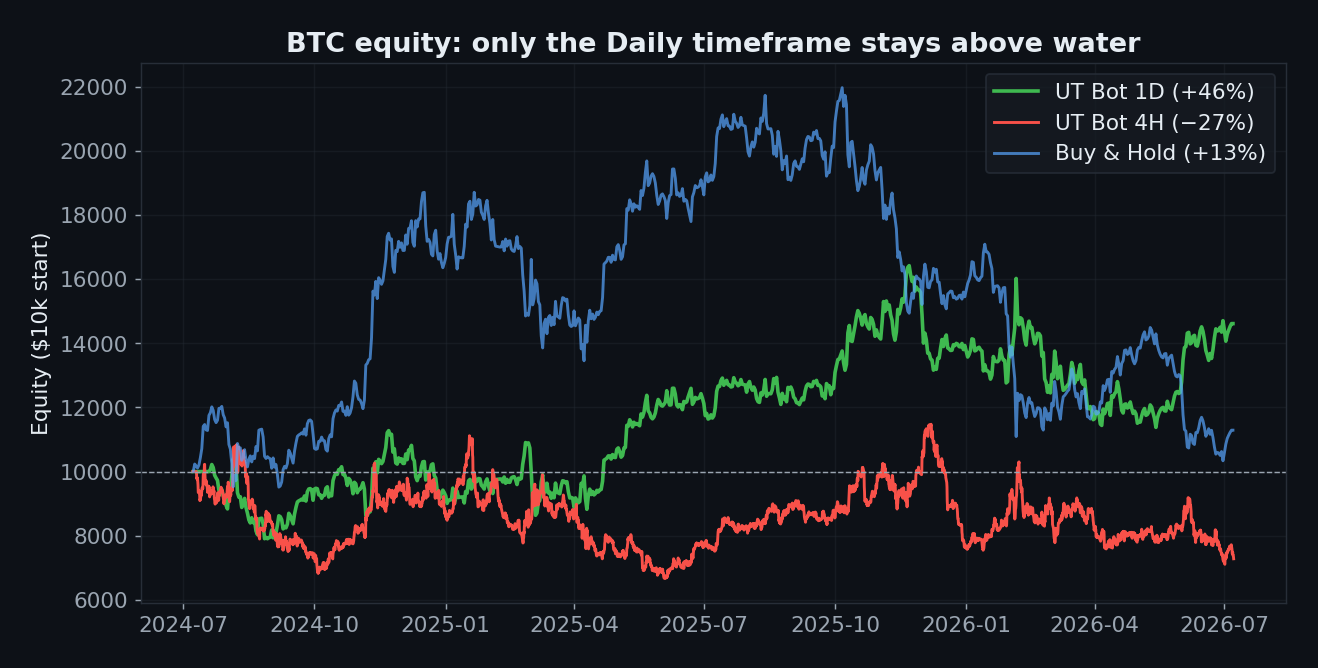
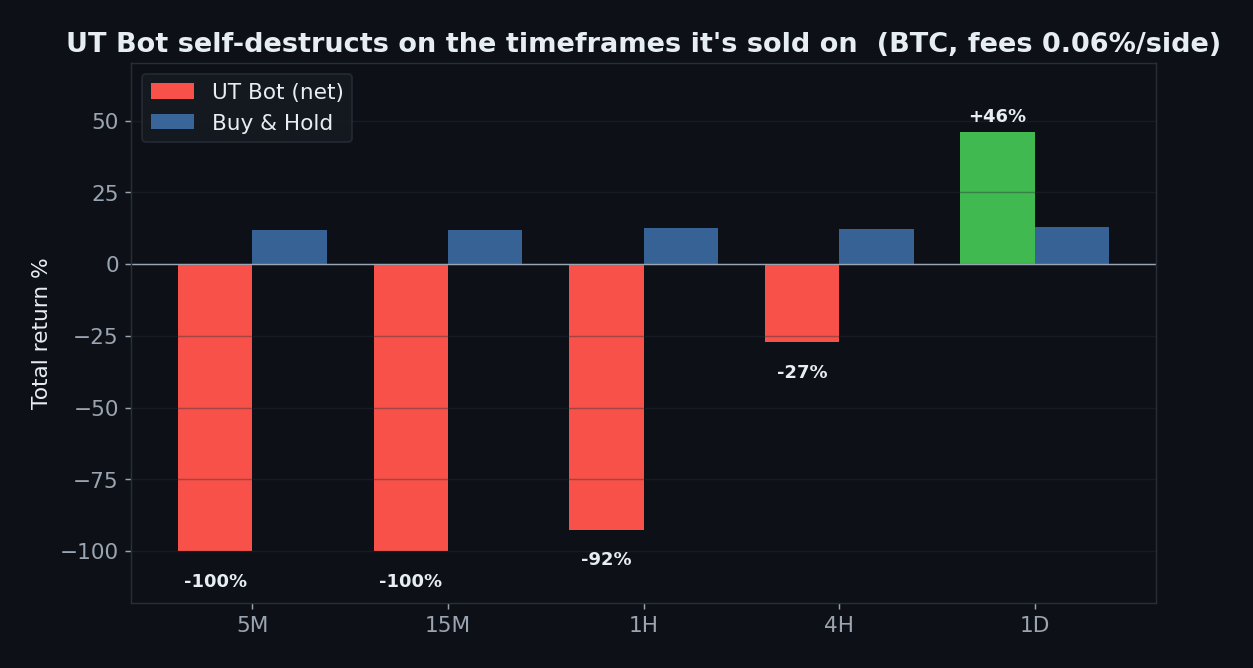
    Here is the punchline in one chart. UT Bot is sold on low timeframes — the “5-minute easy profits” clips — and that is precisely where it detonates. On BTC 5-minute bars it takes 31,242 trades and returns −100%: the account is gone. 15m: −100%. 1H: −92%. 4H: −27%. The only timeframe that stays alive is the daily (+46%, 76 trades) — the one timeframe nobody makes hype videos about. The pattern is monotonic: the faster you trade this thing, the faster it kills you.

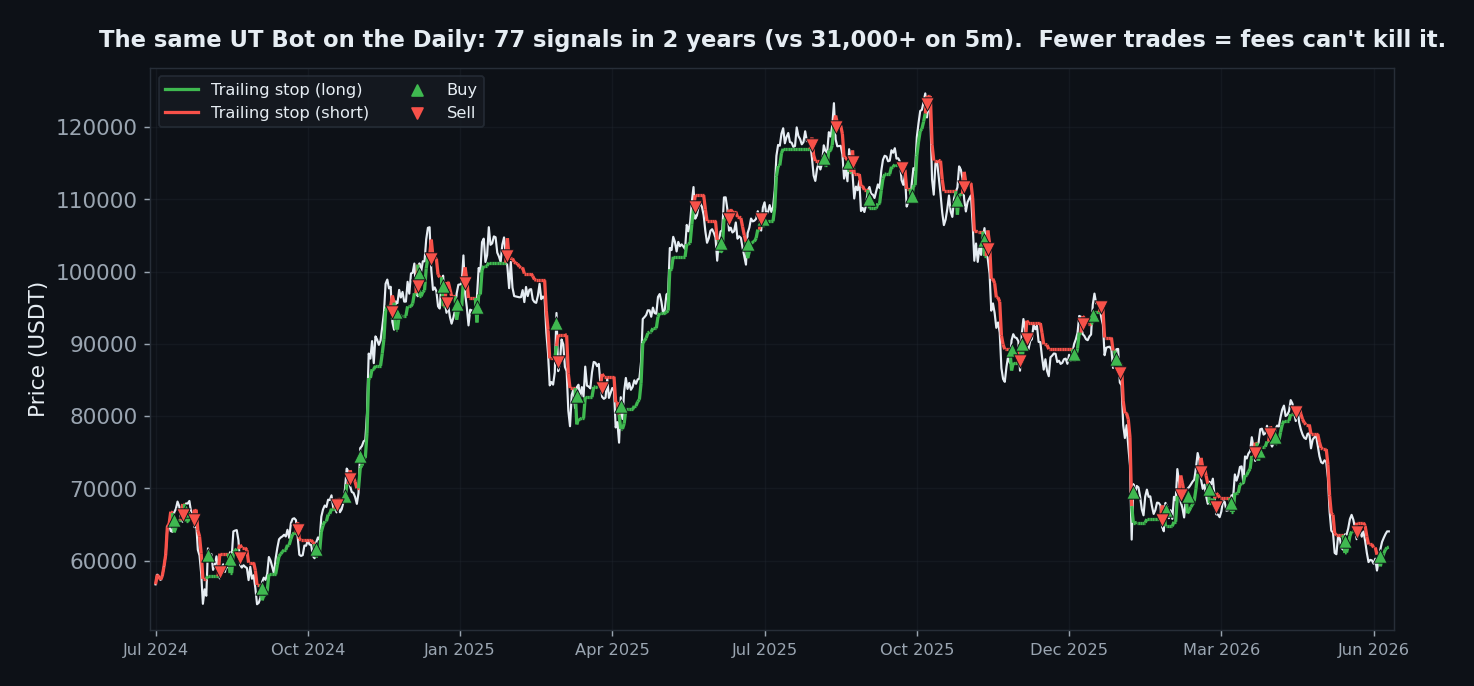
    UT Bot on BTC daily chart, 77 signals in 2 years vs 31000 on 5-minute, trailing stop with buy sell markers

    The same indicator, same rules, on the daily — about 77 signals in two years instead of tens of thousands. That, and nothing cleverer, is why the daily survives fees while every intraday chart does not.

    Gate 02 — Friction (why it dies)

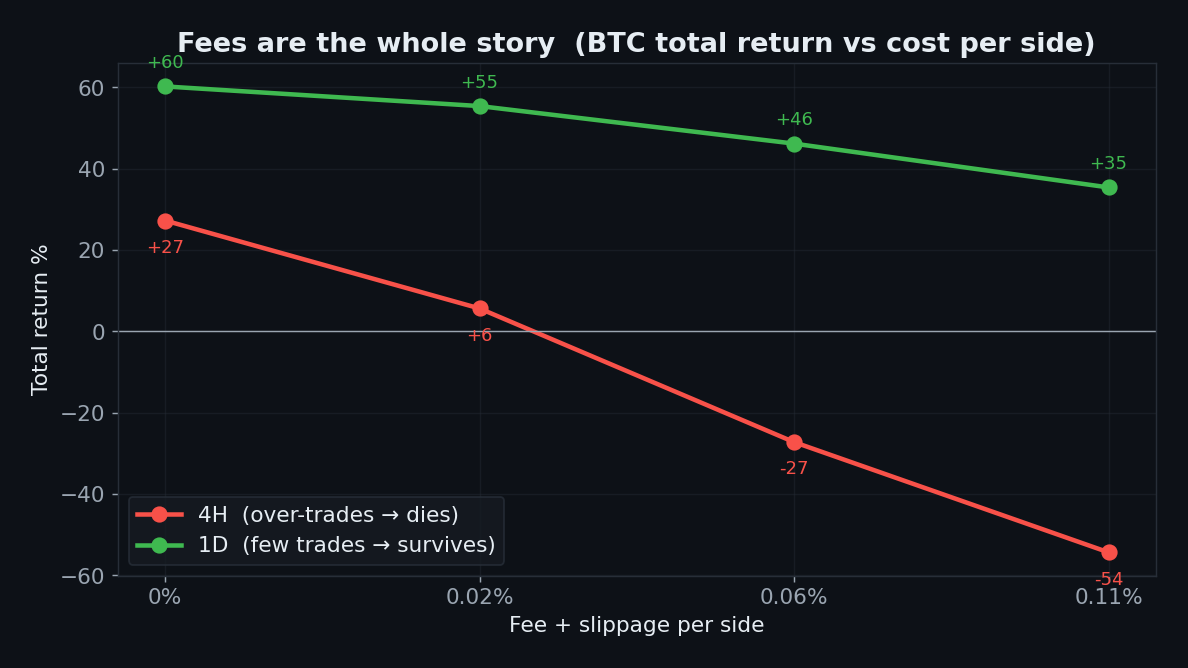
    UT Bot BTC total return vs fee per side, 4H dies at realistic fees, daily fee robust

    The mechanism is not mysterious. UT Bot’s gross edge is razor-thin — a profit factor of just 1.10 on 4H. With zero fees the 4H strategy makes +27%; at a realistic 0.06% per side it flips to −27%; at 0.11% it’s −54%. The entire “edge” is smaller than the transaction cost of harvesting it. The daily timeframe survives for one reason only: it trades ~75 times instead of 31,000, so friction barely touches it.

    Gate 03 — Yearly Consistency

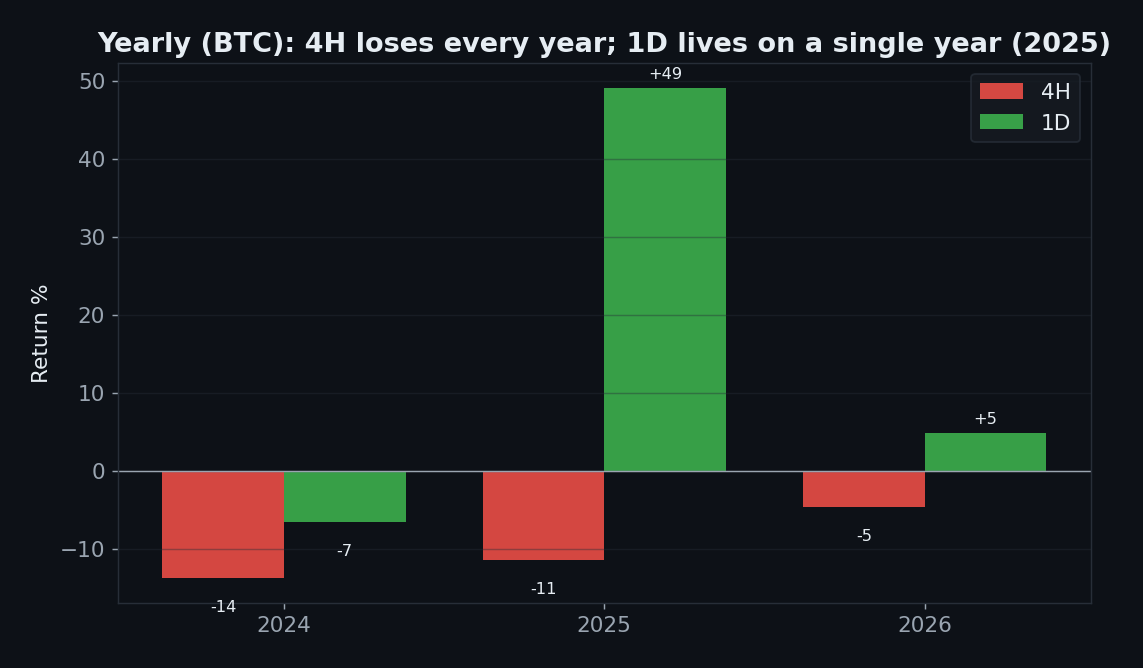
    UT Bot yearly returns BTC, 4H loses every year, daily lives on 2025 alone

    On 4H, UT Bot loses money every single year (−14%, −11%, −5%). The daily’s headline +46% is not steady income either — it lives almost entirely in 2025 (+49%), with 2024 slightly negative and 2026 flat. One good year is not an edge; it’s a sample of one.

    Gate 06b — Five Coins

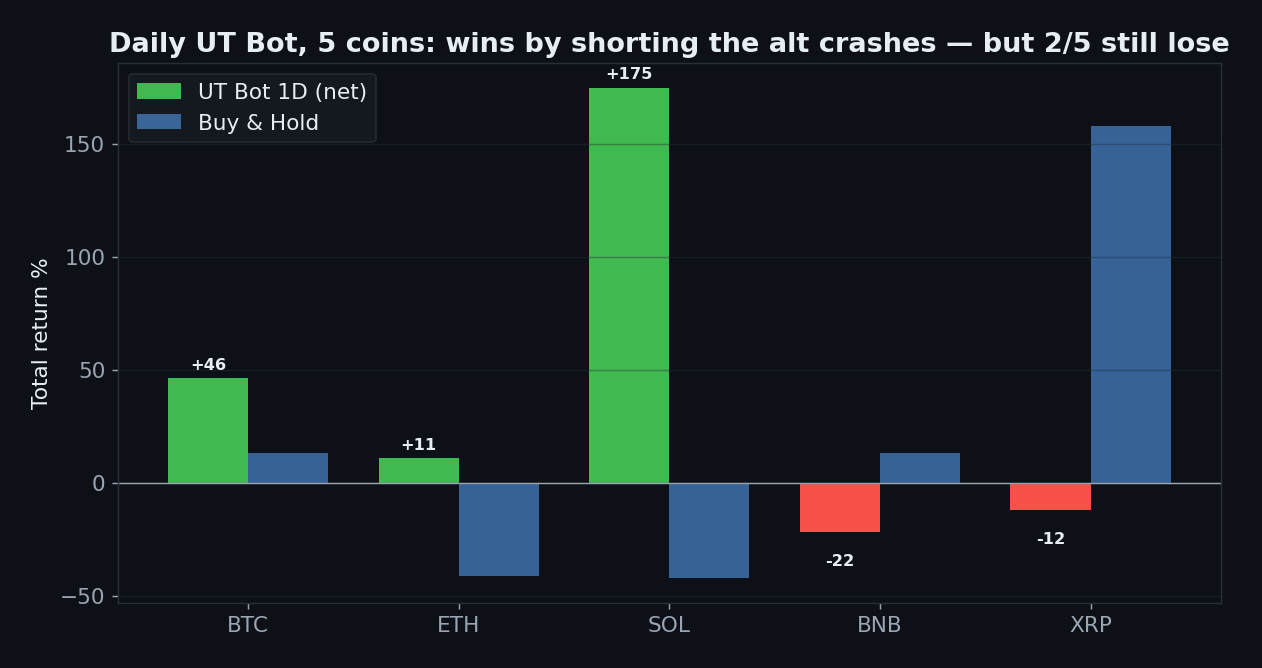
    UT Bot daily on five coins vs buy and hold, wins by shorting alt crashes, two of five lose

    On 4H, only 1 of 5 coins is profitable. On the daily it looks better — 3 of 5 positive and all three beat buy & hold — but read how:

    Coin (1D) UT Bot Buy & Hold Why
    BTC +46% +13% beat B&H in an up market
    ETH +11% −41% profited by shorting the crash
    SOL +175% −42% profited by shorting the crash
    BNB −22% +13% whipsawed, lost
    XRP −12% +158% missed the rally, lost

    The daily wins come from UT Bot’s short side catching the 2024–25 altcoin bear — something any long/short trend-follower would have done. It is not a UT-Bot-specific edge; it’s generic trend exposure, and it still failed on 2 of 5 coins with drawdowns of 50–80%.

    Gate 04 — Out-of-Sample

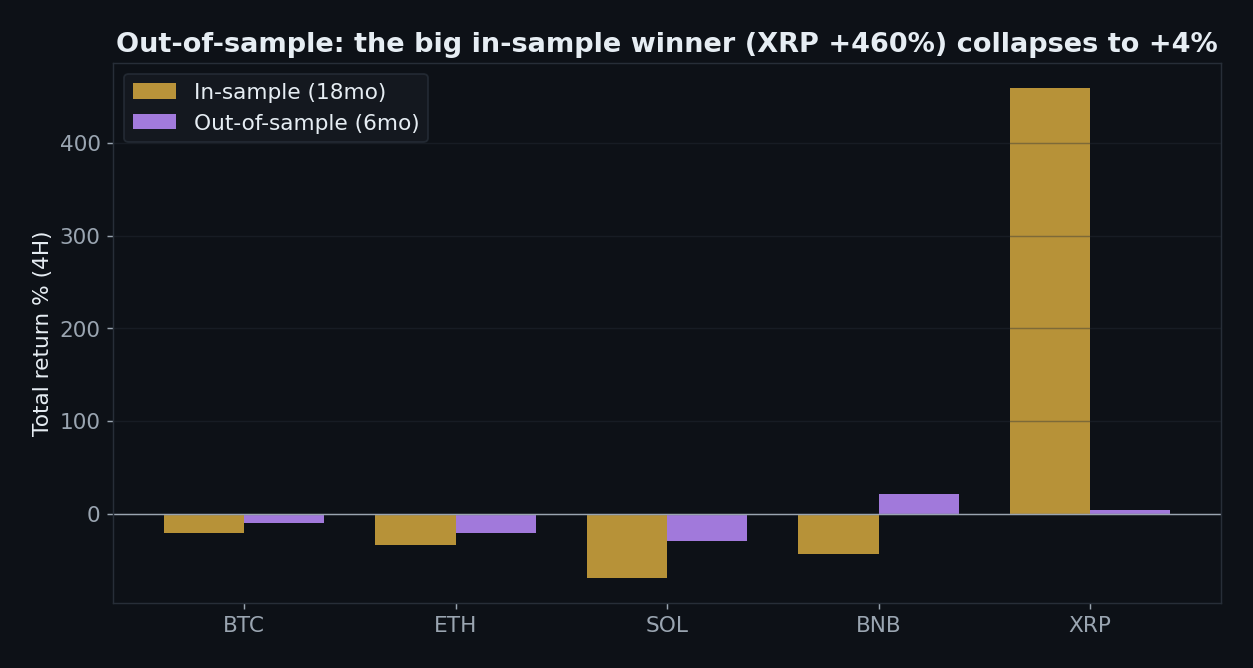
    UT Bot out of sample 4H, XRP in-sample plus 460 percent collapses to plus 4 percent

    Split each coin 18 months in-sample / 6 months out. The tell is XRP: a monstrous +460% in-sample collapses to +4% out-of-sample — the signature of a curve that fit noise. Only 2 of 5 coins are positive out-of-sample. Whatever looked like an edge does not survive contact with unseen data.

    Gate 05 — Parameter Robustness

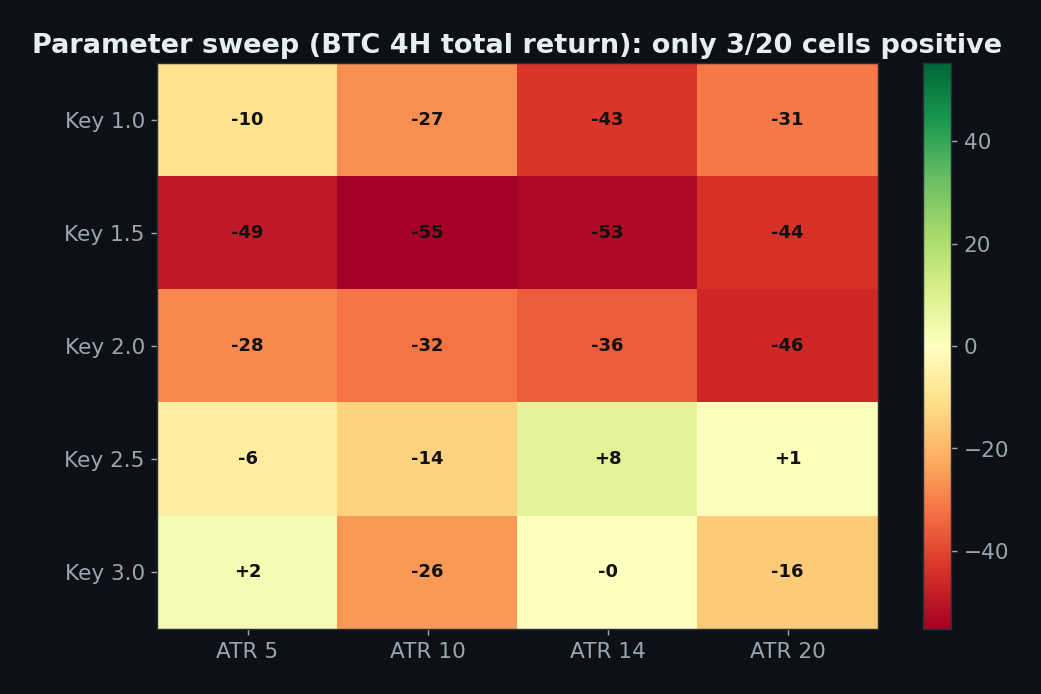
    UT Bot key value by ATR period parameter sweep BTC 4H, only 3 of 20 cells positive

    We swept Key Value (1–3) against ATR Period (5–20) on BTC 4H: only 3 of 20 combinations are positive, and the profitable islands are scattered, not clustered. A real edge is robust to its own knobs; UT Bot’s result is a coin toss over the parameter grid.

    Do the popular variants save it?

    No. On BTC 4H: Heikin-Ashi source makes it worse (−48% vs the base −27%). An EMA-200 regime filter — only longing above the 200-EMA, shorting below — helps but stays negative (−17%). The combination is −30%. None of the “just add this one thing” fixes crosses zero.

    UT Bot BTC equity curve 4H vs 1D vs buy and hold, only daily stays above water

    Monte Carlo — Is the Daily’s +46% Just Luck?

    UT Bot Monte Carlo BTC daily 2000 bootstrap paths, median +46 percent, 71 percent beat buy and hold, wide -35 to +214 band

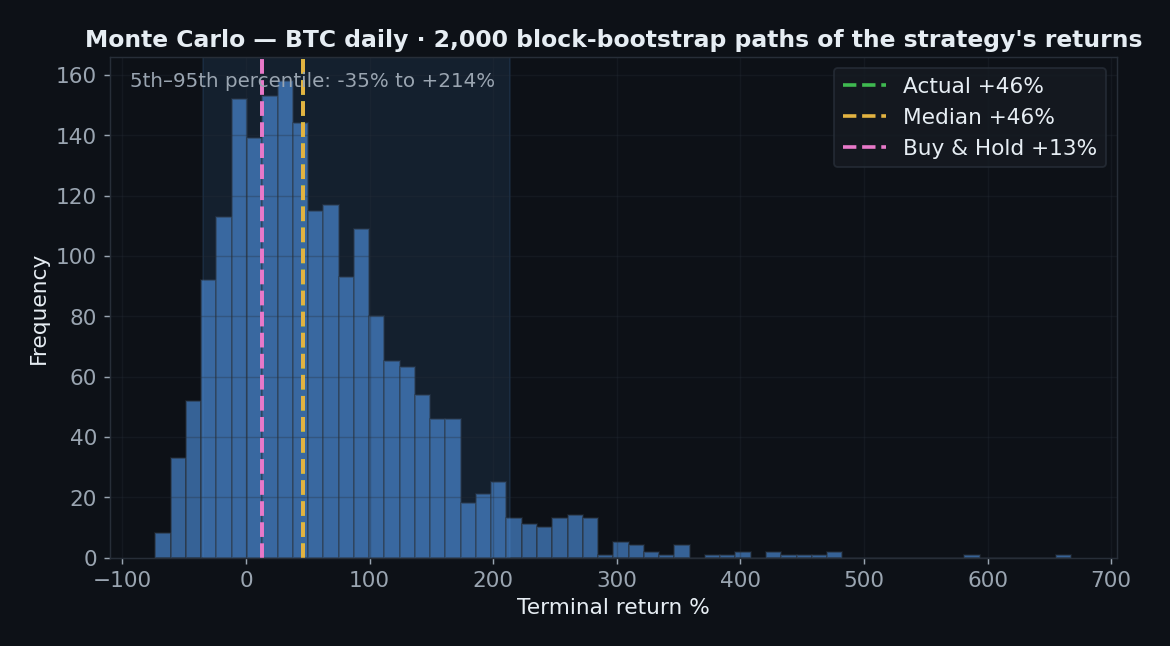
    We resampled the daily strategy’s returns into 2,000 block-bootstrap paths. Here the daily earns a little credit: the median path is +46% — the real result sits right on the median, not out on a lucky tail — and 71% of paths beat buy & hold. But the 5th–95th percentile band runs from −35% to +214%: even on its one survivable timeframe, UT Bot carries a real chance of a deep loss, and the fat right tail shows a handful of big trend trades doing most of the work. Dependable edges have tight distributions; this one does not.

    The Verdict: REJECT

    • Gate 0 — Indicator fidelitypass (ATR and trailing stop match TradingView to 0.00; every Buy is a flip to long and every Sell a flip to short — the direction cannot invert)
    • Gate 1 — Sanitypass (signal on the closed bar, entry at that close, no look-ahead)
    • Gate 2 — Frictionfail (+27% gross → −27% net on 4H; 5m and 15m go to −100%)
    • Gate 3 — Yearly consistencyfail (4H loses money every year; the daily’s +46% is almost entirely 2025)
    • Gate 4 — Out-of-samplefail (2/5 positive; XRP +460% in-sample collapses to +4% out)
    • Gate 5 — Robustnessfail (only 3 of 20 key-value × ATR cells positive)
    • Gate 6 — Multi-marketfail (4H 1/5 coins; daily 3/5, and only via generic short exposure)
    • Gate 7 — vs Buy & Holdmixed (beats it only on the daily, and only on 3 of 5 coins)

    UT Bot Alerts is marketed on exactly the timeframes where its constant flipping self-destructs on fees. Move it up to the daily and it stops bleeding — but that is the opposite of the “5-minute easy profits” pitch, and even there it’s a 3-of-5 coin toss with 30–80% drawdowns that mostly just shorted a bear market. The ATR trailing stop is a legitimate concept; UT Bot as sold is not a strategy.

    FAQ

    The videos show huge wins — are they lying?
    Usually they show gross returns (no fees) on a single lucky window and timeframe. Add real costs and test it out-of-sample on multiple coins and the picture inverts. That gap is the entire business model of hype channels.

    What about the Heikin-Ashi version everyone raves about?
    We tested it. On BTC 4H it was worse than the standard version (−48%). Smoother candles delay the flips but don’t create an edge.

    So the daily “+46%” means it works?
    On one coin, in one year, with a 31% drawdown and a tiny 76-trade sample. On the other four coins the daily is 2 losses and two wins that are really just “short the crash.” That is not a dependable edge.

    Can I replicate this?
    Yes — the rules above are complete, the data is public Binance OHLCV, fees 0.06%/side. We even proved the indicator matches TradingView to the decimal before running a single trade.

    See also: Triple SuperTrend (also −100% on 5m), the Golden Cross (loses to holding on all 5 coins), RSI 30/70 (died at gate 2), and VWAP pullback (our first conditional pass).


    Disclaimer: educational research, not financial advice. Past performance does not guarantee future results. Never trade money you cannot afford to lose.
  • Golden Cross Strategy: Does It Beat Buy & Hold? 9 Years, 5 Coins, 5 Timeframes

    Golden Cross Strategy: Does It Beat Buy & Hold? 9 Years, 5 Coins, 5 Timeframes

    The golden cross — a short moving average crossing above a long one — is the most famous signal retail traders know. YouTube sells it by the million views: “buy the golden cross, ride the trend.” So does it actually beat simply holding?

    We ran it through the full 7-Gate Protocol: 9 years of daily data, 5 liquid coins, 5 timeframes down to 5-minute bars, a parameter sweep, and a 2,000-path Monte Carlo. It failed — and not narrowly. Here is the complete autopsy.

    The Exact Rules

    • Signal: fast MA crosses above slow MA (default 50/200) → go long; death cross → flat (cash)
    • Position: spot, long-only, no leverage
    • Execution: signal on the daily close, enter the next bar — no look-ahead
    • Costs: 0.11% per side (fees + slippage), applied on every entry and exit
    • Data: Binance daily, Aug 2017 – Jul 2026 (plus intraday for the timeframe test)
    • Benchmark: buy & hold over the identical window

    The Baseline: BTC, 50/200

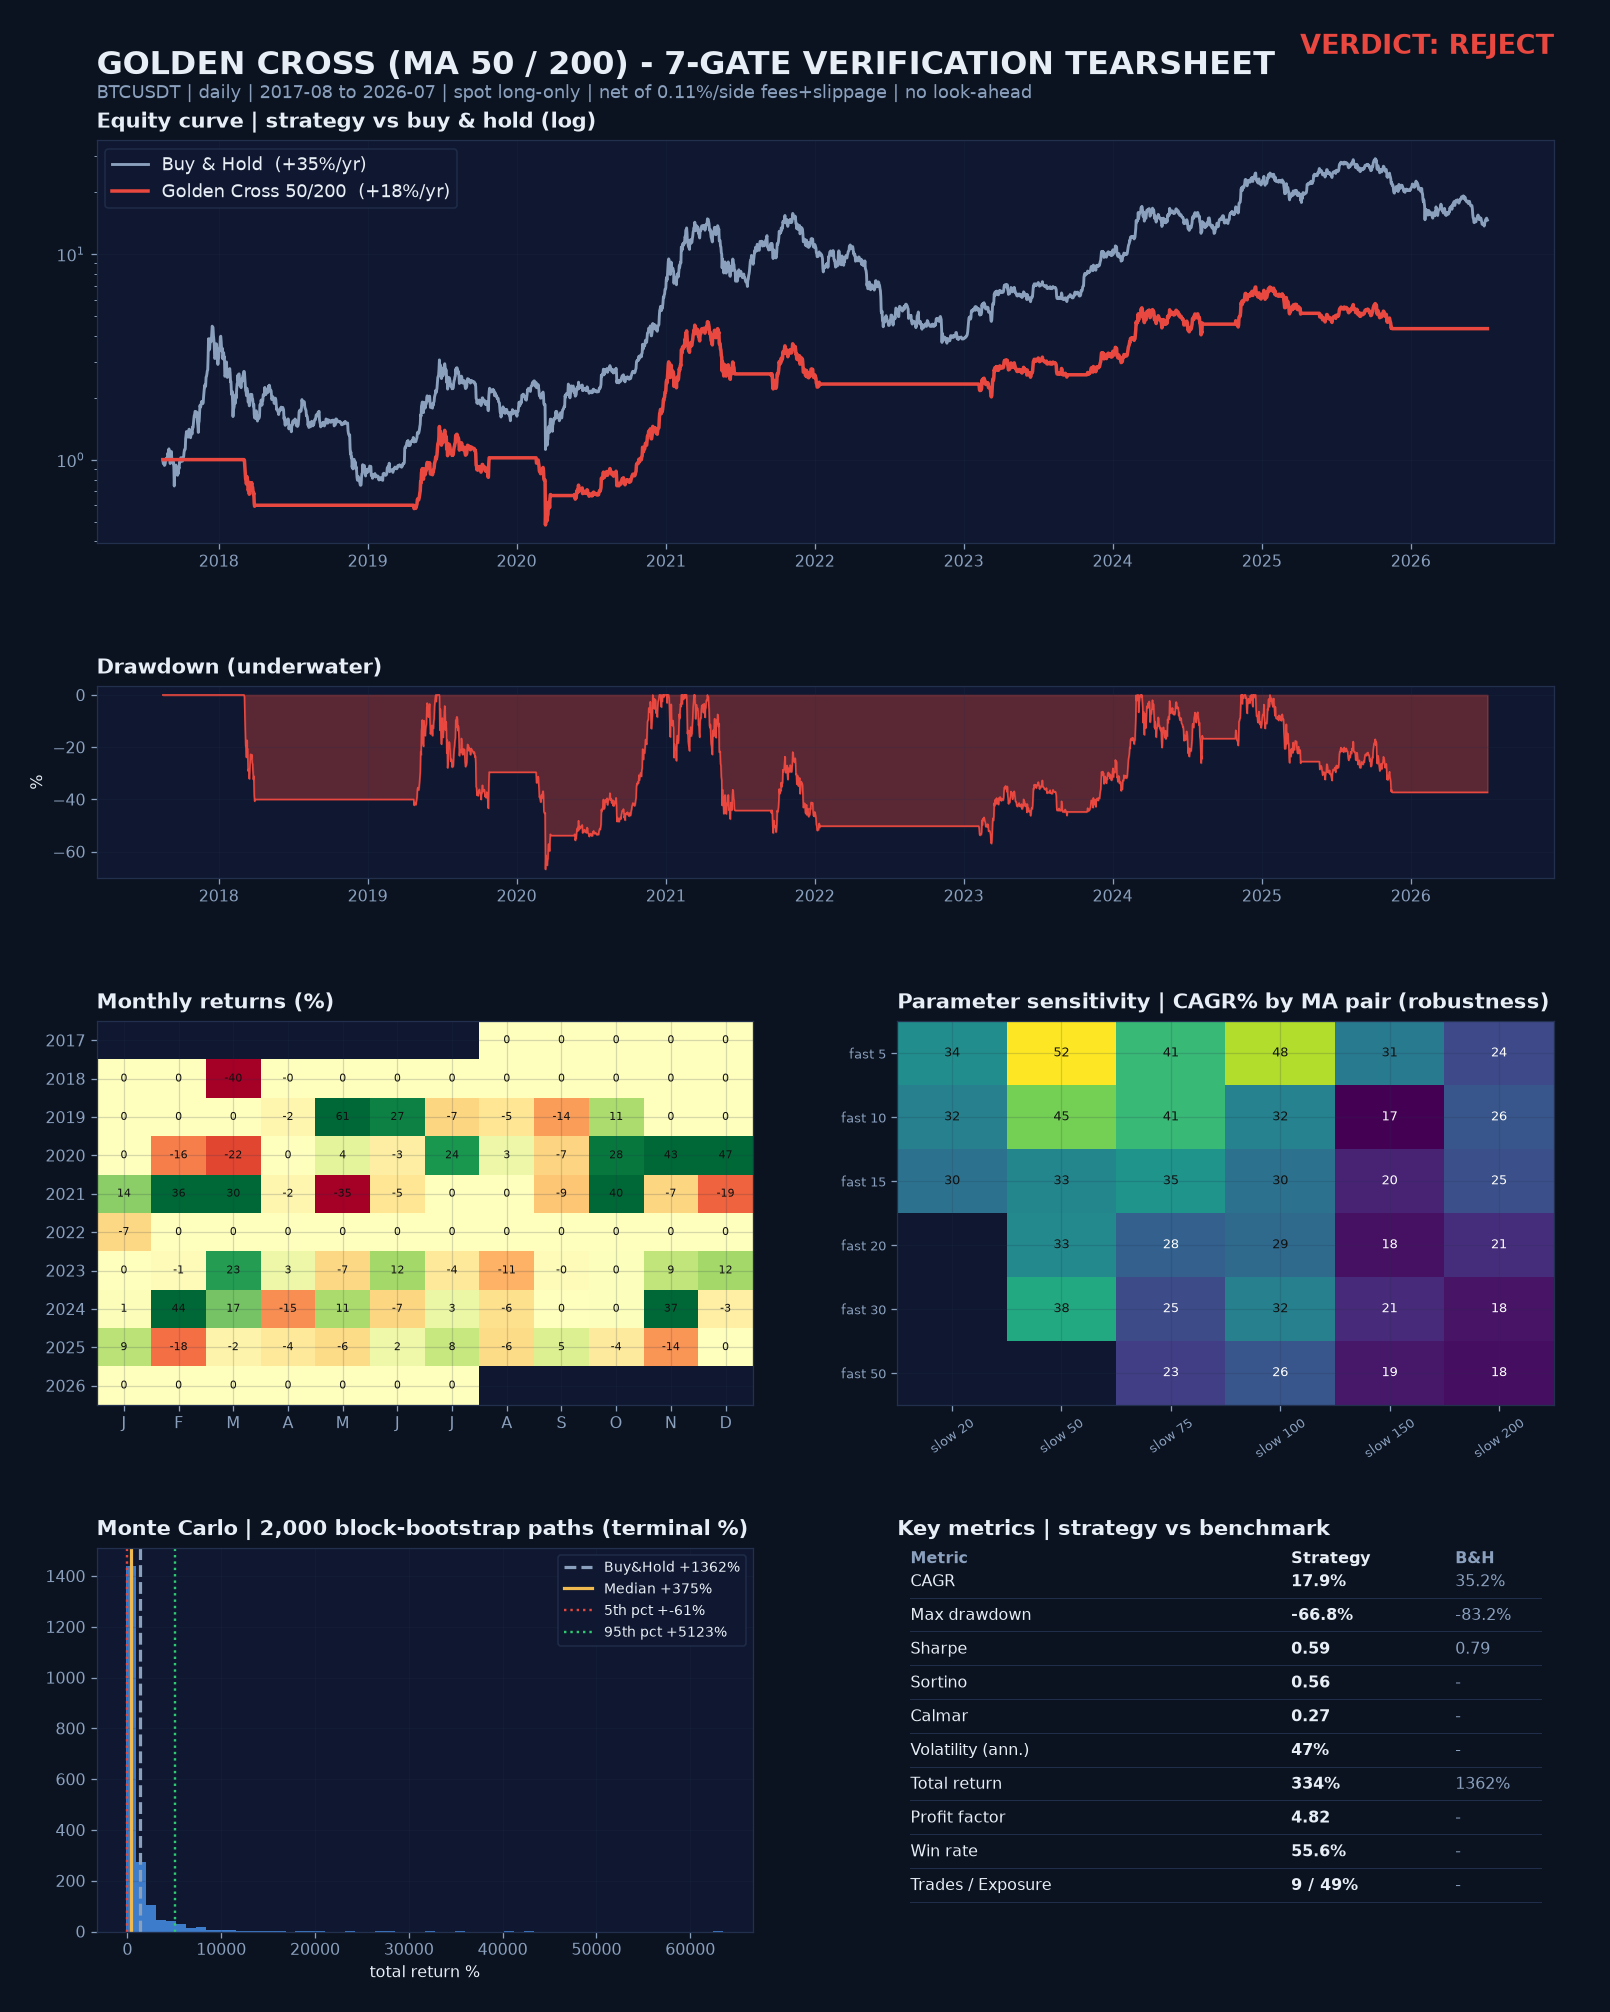
    Golden cross 50/200 seven-gate verification tearsheet, BTC 2017-2026, verdict reject

    +334% total return sounds great — until you see buy & hold did +1,362% over the same window. Sharpe 0.59 vs 0.79. Calmar 0.27. The strategy’s only real contribution is a smaller drawdown (−66.8% vs −83.2%). It doesn’t make you more; it loses you less. That is a risk tool, not a profit engine — and it is the opposite of what the golden-cross evangelists promise.

    Gate 03 — Yearly & Monthly

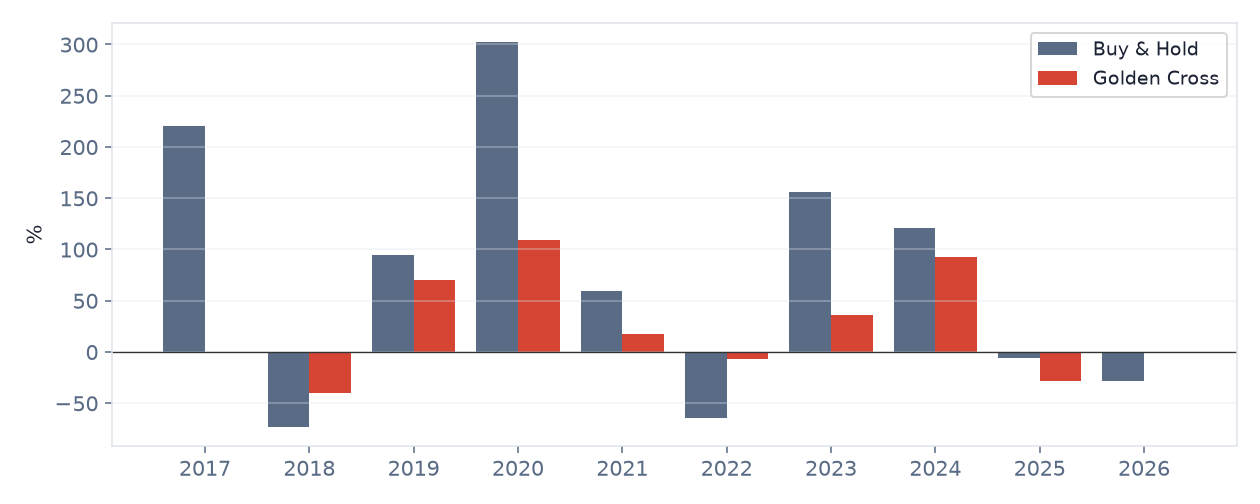
    Golden cross vs buy and hold yearly returns, BTC

    The pattern is unmistakable: the golden cross only wins in crash years — 2018 (−40% vs −73%), 2022 (−7% vs −64%). In every bull year it lags badly (2020: +109% vs +302%; 2021: +18% vs +60%). It is a drawdown filter wearing a profit strategy’s clothes.

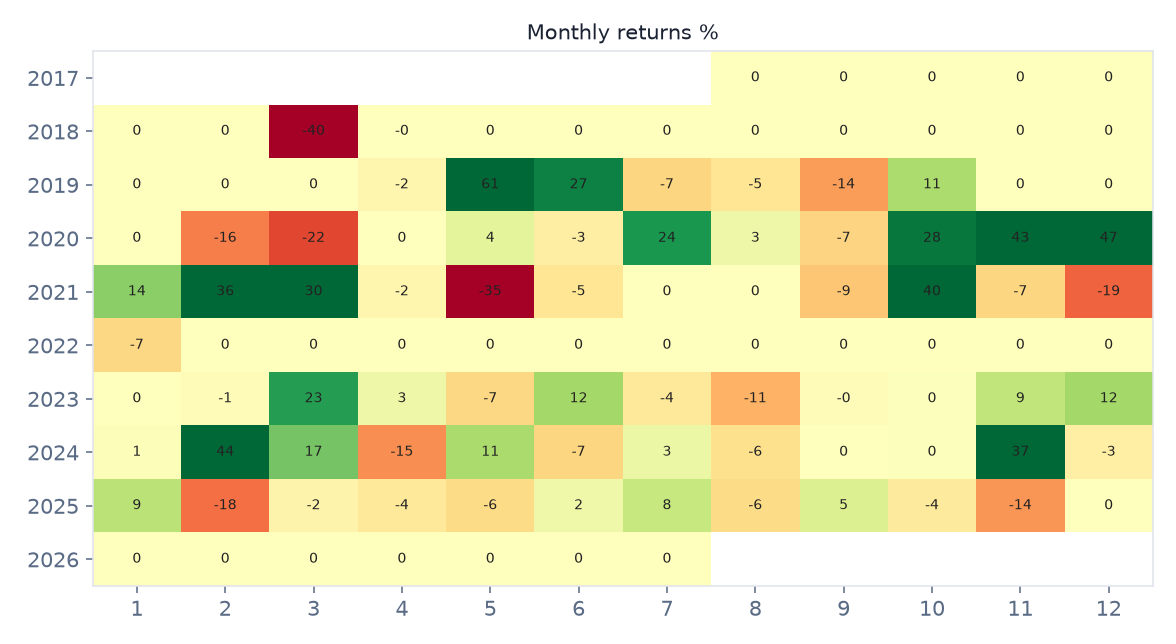
    Golden cross monthly returns heatmap by year

    Monthly, there is no seasonality — long flat stretches (cash) punctuated by the occasional green month. You don’t get paid on a schedule; you get paid only when a big trend shows up.

    Gate 04 — Out-of-Sample

    Split the history in half. First half (2017–2022, an explosive bull): golden cross +133% vs buy & hold +759% — a rout. Second half (2022–2026, chop and decline): +86% (−37% DD) vs +69% (−67% DD) — here it wins, mostly on drawdown. The edge is regime-dependent, not stable.

    Gate 05 — Parameter Robustness (the killer)

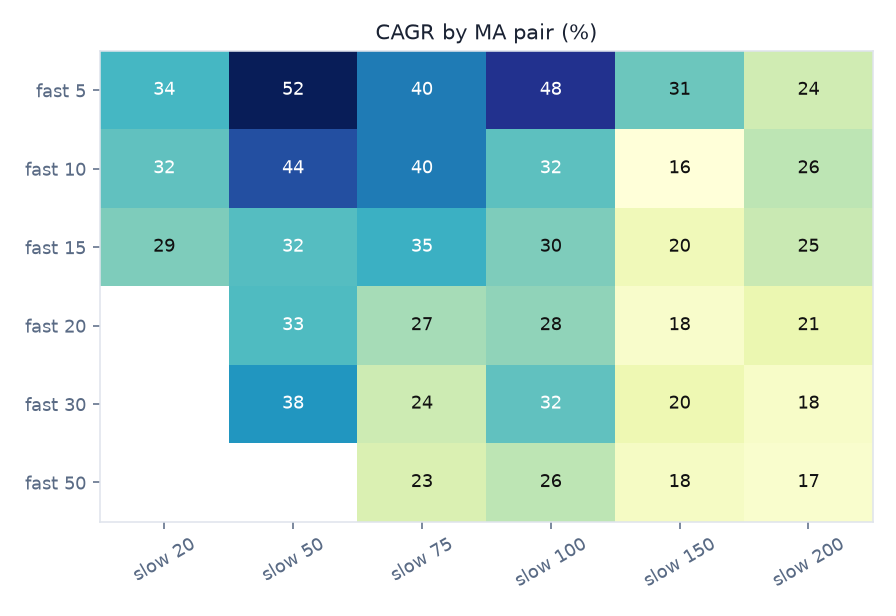
    Golden cross CAGR by moving average pair, parameter robustness heatmap

    “Golden cross” means 50/200 to almost everyone. But CAGR swings wildly with the MA pair: the best combination reaches ~52% CAGR while the famous 50/200 sits near the bottom at ~18%. On ETH the gap is extreme — a 10/30 cross returns ~59% CAGR versus ~15% for 50/200. Most of the “performance” is simply which moving average you happened to pick. That is not an edge; that is luck, and the crowd picked one of the worst cells.

    Gate 06a — Every Timeframe (the scalper’s grave)

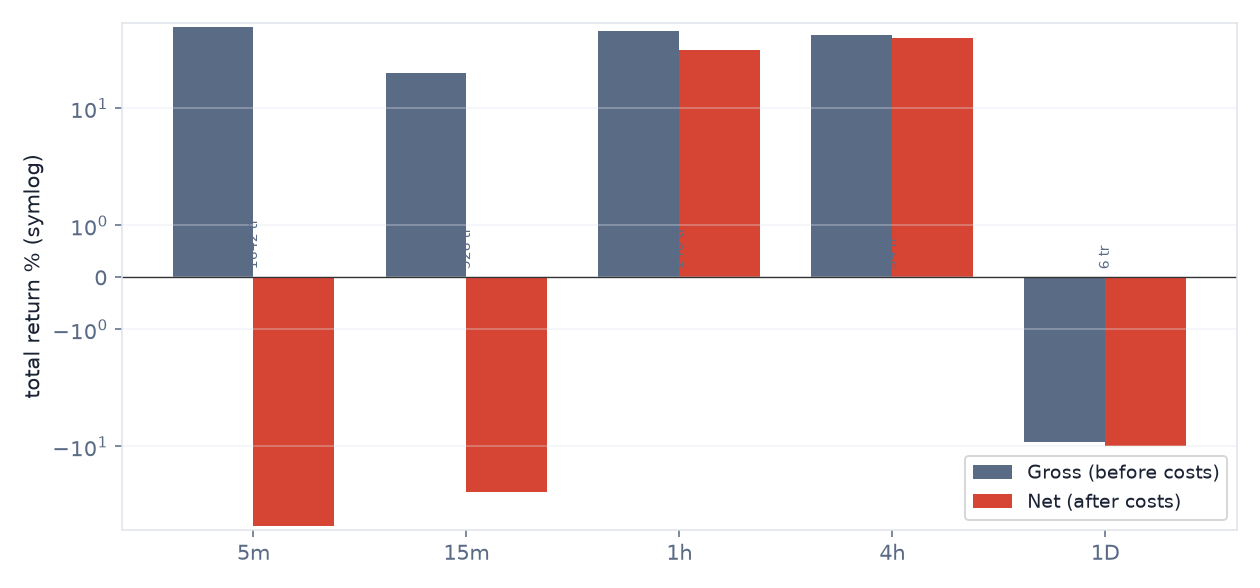
    Golden cross across timeframes, gross vs net after fees, friction destroys low timeframes

    Does it work intraday, the way the “golden cross scalping” videos claim? We ran the identical 50/200 cross on 5m, 15m, 1h, 4h and daily. The result is brutal: on 5-minute bars it is +74% gross but −71% net once you pay for 1,642 trades. 15m: +24% → −31%. The lower the timeframe, the faster friction eats it alive. 4H is the least-bad (+56% net) yet still loses to buy & hold (+74%) over the same window. Golden-cross scalping is dead on arrival — the fees alone bury it.

    Gate 06b — Five Liquid Coins

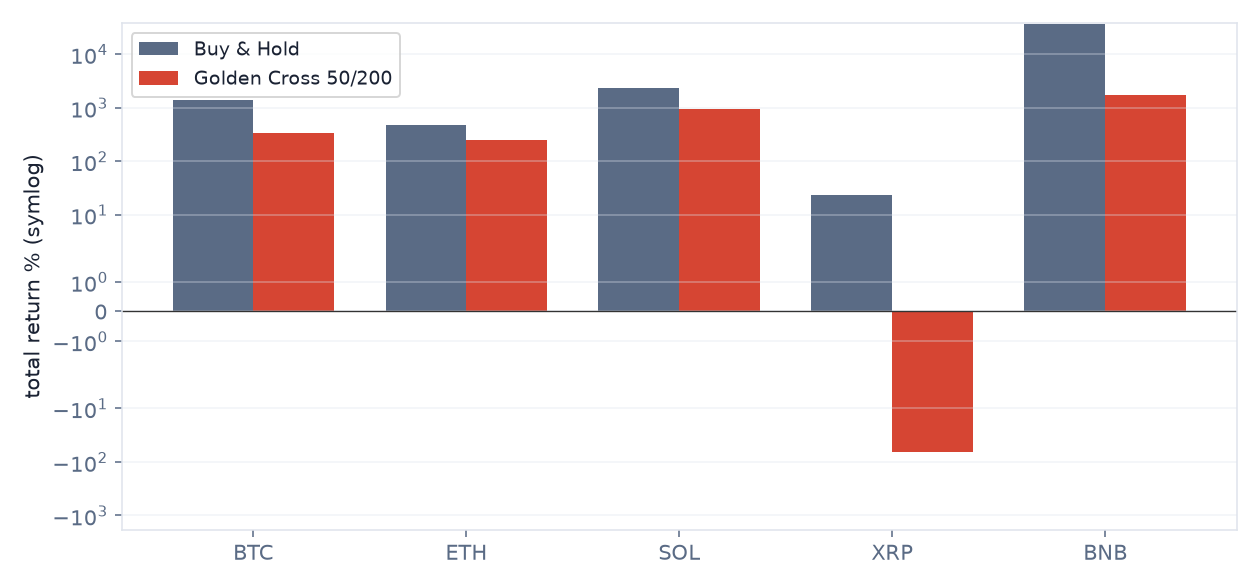
    Golden cross vs buy and hold on five liquid coins BTC ETH SOL XRP BNB
    Symbol Golden Cross Buy & Hold Strategy Max DD Verdict
    BTC +334% +1,362% −66.8% loses to holding
    ETH +245% +481% −79.4% loses to holding
    SOL +922% +2,272% −78.4% loses to holding
    XRP −65% +23% −91.4% loses money
    BNB +1,740% +36,044% −77.3% loses to holding

    Five of the most liquid coins in crypto. The golden cross loses to buy & hold on every single one. On XRP it doesn’t merely underperform — it loses money (−65% while holding made +23%), whipsawed to death by a coin that mostly went sideways. Note BNB: even against a 361× monster, the golden cross returned “only” +1,740% — underperforming by a factor of twenty. The stronger the trend, the more it leaves on the table.

    Gate 07 — Monte Carlo

    Golden cross Monte Carlo 2000 bootstrap paths terminal return distribution

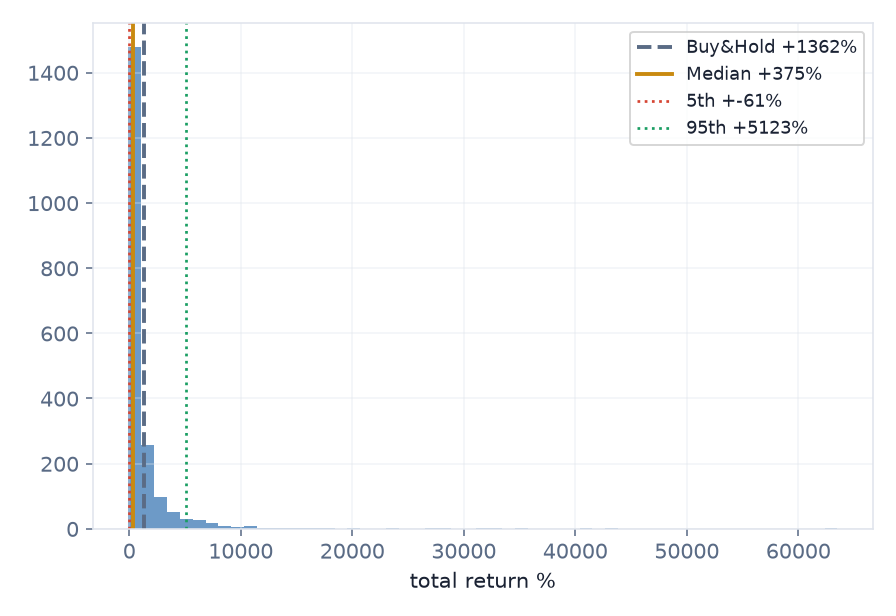
    2,000 block-bootstrap paths of the daily returns. The median outcome is +375% — close to the actual +334%, and still far below buy & hold’s +1,362%. The 5th–95th percentile band is enormous (−61% to +5,123%), confirming heavy path-dependence. Translation: even luck doesn’t rescue it.

    Take-profit to stop-loss — and why it cannot help

    Could a fixed target beat holding to the death cross? We swept a fixed stop (3×ATR) and target on the daily 50/200 crosses, 2017–2026.

    TP : SL Trades Win rate Profit factor Net return
    1 : 0.5 8 62.5% 0.75 −12%
    1 : 1 8 50.0% 1.01 −5%
    1 : 1.5 8 50.0% 1.52 +16%
    1 : 2 8 50.0% 2.03 +40%
    1 : 2.5 8 50.0% 2.55 +69%
    1 : 3 8 50.0% 3.06 +101%

    Two problems leap out. First, the sample: a 50/200 golden cross fires just 8 times in nine years, so every figure here rests on eight trades — statistically meaningless, however tidy the rising profit factor looks. Second, even the best fixed target (+101% at 1:3) is far below simply holding to the death cross (+334%), and further still below buy-and-hold (+1362%). A take-profit on a trend-following cross only caps the rare winners that justify it. TP:SL cannot rescue a signal already beaten by doing nothing.

    The Verdict: REJECT

    Adding up the gates:

    • Gate 0 — Indicator fidelitypass (standard 50/200 simple-moving-average cross)
    • Gate 1 — Sanitypass (signal on the closed bar, entry next bar, no look-ahead)
    • Gate 2 — Frictionfail intraday (5m/15m flip to losses purely on fees)
    • Gate 3 — Yearly consistencyfail (wins only in crash years, lags every bull)
    • Gate 4 — Out-of-samplepartial (regime-dependent)
    • Gate 5 — Robustnessfail (result hinges on the MA pair; 50/200 is near-worst)
    • Gate 6 — Multi-marketfail (loses to holding on all 5 coins)
    • Gate 7 — vs Buy & Holdfail (behind on total return and Sharpe)

    “Buy the golden cross and profit” is, on the data, false. Its only value is drawdown reduction — and even that depends on a moving-average pair you got lucky with. As a standalone profit strategy it is a myth. As a defensive trend filter bolted onto a real system, maybe. Nothing more.

    That distinction is the whole point of this site. One YouTube title says “The golden cross made 922% on Solana!” Another says “I tested the golden cross and lost money!” Both are technically true (SOL and XRP, right here). Neither is the truth.

    FAQ

    Then why does everyone still use it?
    Because in crash years it looks like genius, and almost nobody backtests the bull years it quietly lags. Availability bias does the rest.

    Isn’t a smaller drawdown worth it?
    Only if you value risk reduction over returns and accept the parameter fragility. A plain “exit below the 200-day” achieves similar defense with far less overfitting risk.

    Does it work on stocks or forex?
    Different assets, different result. This test is crypto spot, daily and intraday. We only publish what we measured.

    Can I replicate this?
    Yes — the rules above are complete, the data is public Binance OHLCV, fees 0.11%/side. Every number in this article falls out of those inputs.

    See also: the RSI 30/70 strategy (died at gate 2) and the VWAP trend-pullback strategy (the first to earn a conditional pass).


    Disclaimer: This is educational research, not financial advice. Past performance does not guarantee future results. Never trade money you cannot afford to lose.
  • VWAP Strategy Backtest: 5 Coins, 16 Parameter Sets, Full Out-of-Sample Test

    VWAP Strategy Backtest: 5 Coins, 16 Parameter Sets, Full Out-of-Sample Test

    Last time, the RSI 30/70 strategy died at gate 2 — fees ate it alive before we even got to the interesting questions. This strategy is different. It’s the first one to make it deep into the 7-Gate Protocol: five symbols, sixteen parameter sets, and a full out-of-sample split.

    It survived more gates than anything we’ve tested. It still didn’t survive all of them. Here’s the complete autopsy — including exactly where it works and where it dies.

    The Exact Rules

    • Timeframe: 4H candles
    • Trend filter: EMA(100) — longs only above it, shorts only below it
    • Entry: price pulls back and touches the daily VWAP, then closes back in the trend direction
    • Stop loss: fixed at entry ± 2.0 × ATR(14) — never trailed
    • Exit: close crossing back through the EMA(100) (trend over), or the stop
    • Fees: 0.06% per side, intrabar stop fills
    • Data: 2 years (July 2024 – July 2026), Binance public data

    One counterintuitive detail from our earlier testing: a trailing stop destroys this strategy (PF 0.76). Pullback entries get shaken out by noise. The fixed stop is not a preference — it’s the difference between profit and ruin.
    The Baseline: BTC, 4H

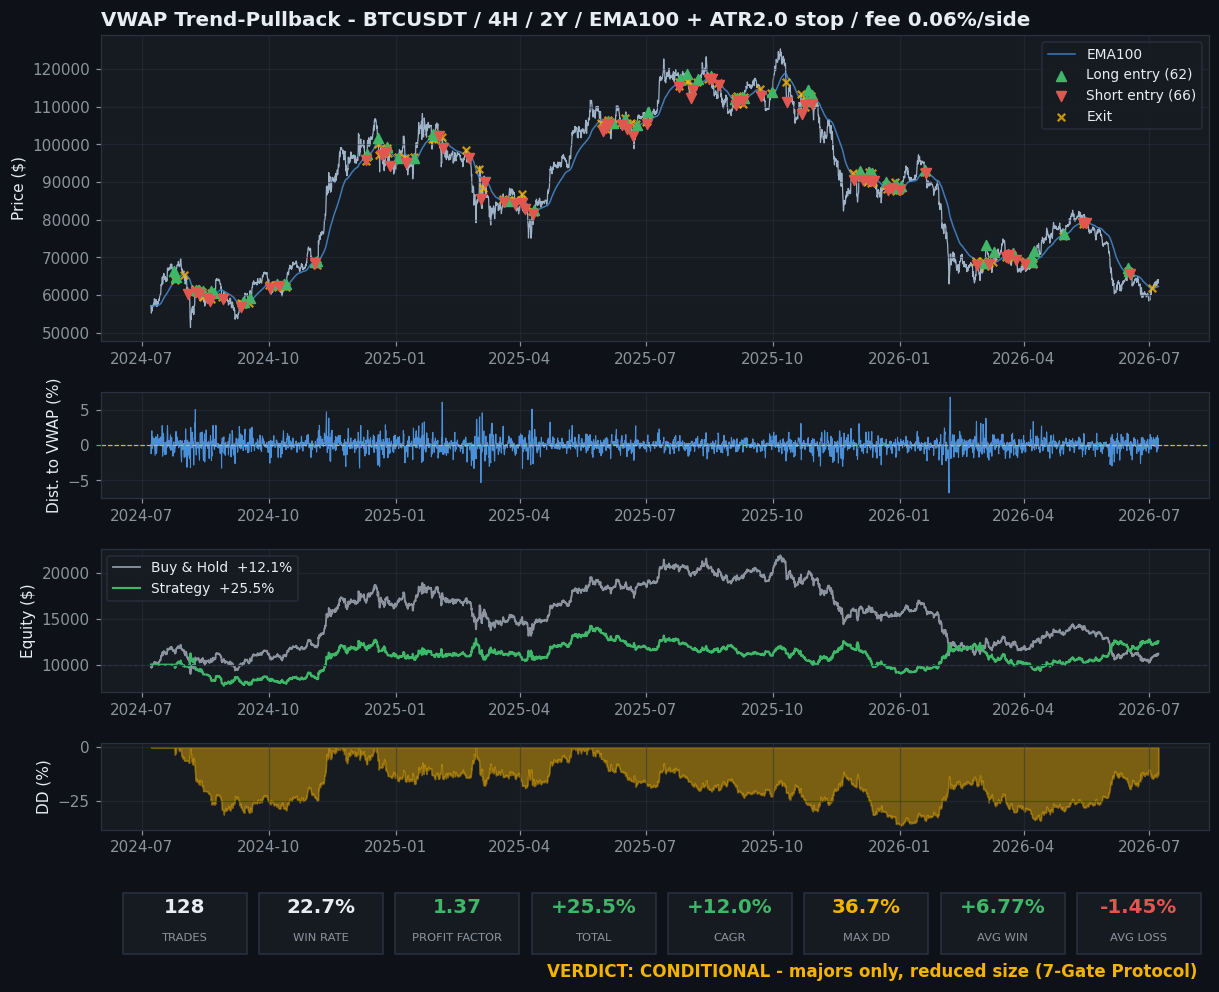
    VWAP trend pullback strategy backtest tear sheet BTCUSDT 4H with trade markers

    Look at that win rate: 22.7%. Three losses out of four trades — and it still made +25.5%, double Buy & Hold. This is the exact mirror image of the RSI lesson: average win +6.77%, average loss −1.45%. Win rate is a vanity metric. Payoff asymmetry is the business model.

    Gate 03 — Monthly Consistency

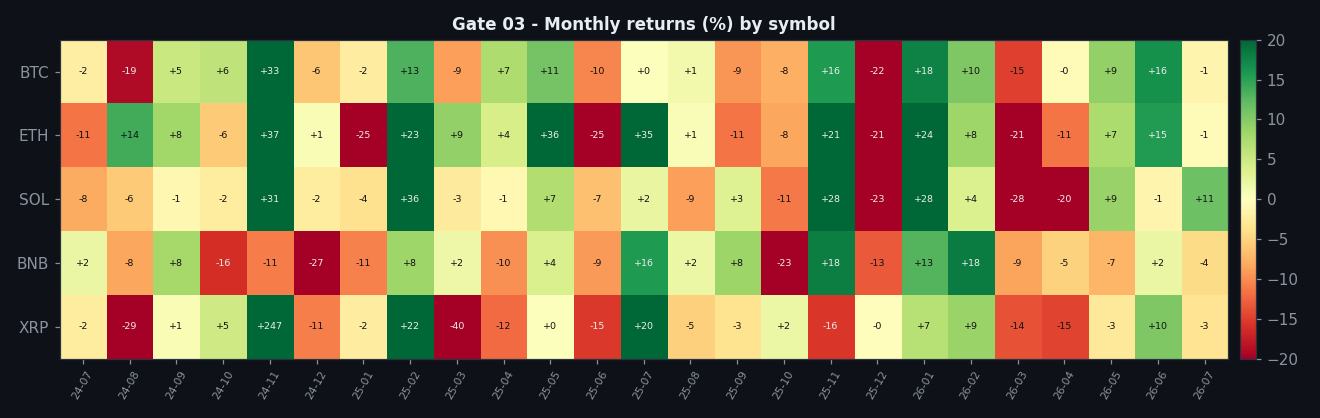
    VWAP strategy monthly returns heatmap by symbol

    Not pretty, not terrible. Long flat-to-red stretches punctuated by big green months — the classic trend-following profile. You don’t get paid monthly; you get paid when trends happen.
    Gate 04 — Out-of-Sample

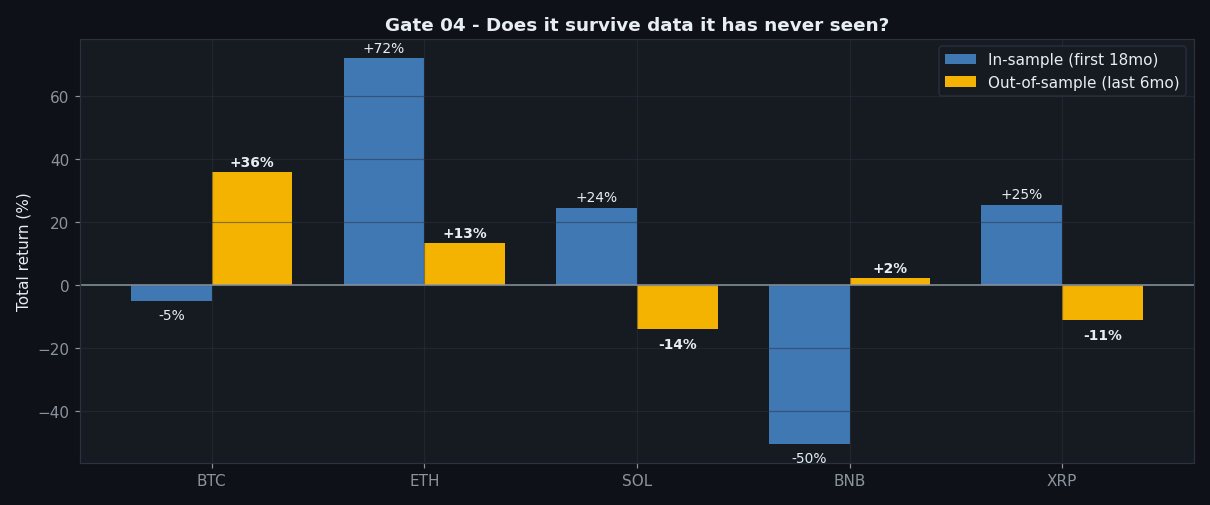
    VWAP strategy in-sample vs out-of-sample returns by symbol

    We split the data: first 18 months in-sample, last 6 months untouched. 3 of 5 symbols stayed positive out-of-sample. BTC actually got better (PF 2.46 out-of-sample). SOL and XRP flipped negative. Partial pass — the edge doesn’t evaporate on unseen data, but it’s not universal either.

    Gate 05 — Parameter Robustness

    VWAP strategy parameter sweep heatmap EMA ATR robustness

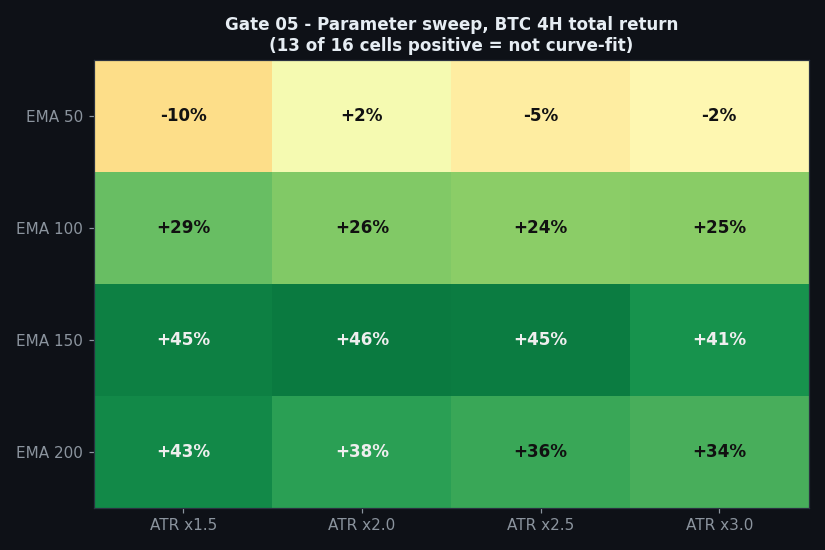
    Sixteen combinations of EMA length (50–200) and ATR stop multiple (1.5–3.0): 13 of 16 positive. This is what a real edge looks like — it degrades gracefully when you wiggle the knobs. A curve-fit strategy shows one green cell in a sea of red.

    Gate 06 — Five Symbols, Same Rules

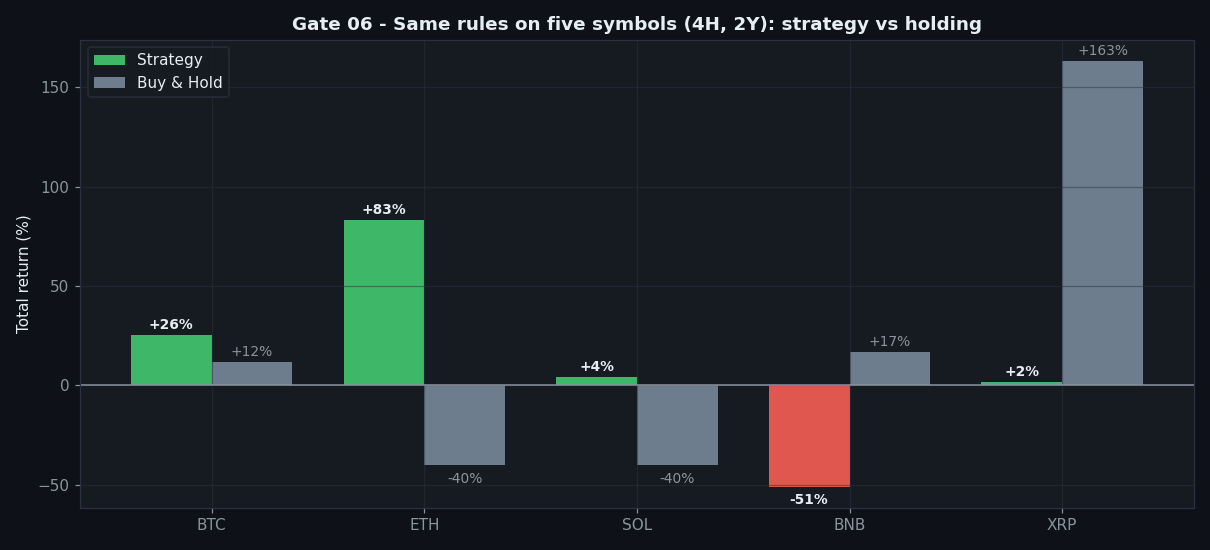
    VWAP strategy tested on five crypto symbols vs buy and hold
    Symbol Trades PF Total return Max DD Buy & Hold Verdict
    BTC 128 1.37 +25.5% 36.7% +12.1% beats holding
    ETH 128 1.51 +83.3% 41.8% −39.8% crushes holding
    SOL 133 1.15 +4.2% 51.1% −40.2% beats holding
    BNB 165 0.80 −50.8% 60.6% +16.8% fails
    XRP 148 1.68 +1.5% 75.9% +163.2% loses to holding

    This is why gate 06 exists. Test on BTC alone and you’d call it a winner. Test on BNB and you’d call it garbage. Both would be wrong: the edge is real on majors and absent elsewhere. Anyone selling you a strategy that “works on everything” hasn’t run this test.

    Every timeframe (why 4-hour is the whole story)

    A conditional pass comes with a condition, and for VWAP pullback it is the timeframe. The identical rules, run from 5-minute to daily:

    Timeframe Trades Win rate Profit factor Net return
    5-minute 9,124 11.7% 0.22 −100%
    15-minute 3,097 15.1% 0.37 −100%
    30-minute 1,442 18.4% 0.54 −93%
    1-hour 709 20.3% 0.71 −68%
    4-hour (baseline) 159 22.6% 1.20 +21%
    1-day 30 20.0% 0.73 −28%

    Every intraday interval loses — a total wipe on 5-minute — and the edge appears only on the 4-hour. Push to daily and the sample thins and it slips back to −28%. This is not a strategy you can run anywhere; it is a 4-hour phenomenon, which is precisely why the verdict is conditional.

    Take-profit to stop-loss (4-hour)

    Swapping the exit for a fixed stop (2×ATR) and a swept target:

    TP : SL Trades Win rate Profit factor Net return
    1 : 0.5 102 69.6% 0.93 −8%
    1 : 1 77 57.1% 1.15 +13%
    1 : 1.5 72 50.0% 1.29 +31%
    1 : 2 61 41.0% 1.16 +14%
    1 : 2.5 55 38.2% 1.29 +27%
    1 : 3 53 32.1% 1.11 +5%

    Unlike the rejects on this site, VWAP’s edge survives the exit sweep: for every reward-to-risk from 1:1 to 1:3 the profit factor holds above 1.0, peaking at 1.29. That resilience across exits is what separates a conditional pass from a rejection — though a very tight 1:0.5 target still tips it slightly negative.

    The Verdict: CONDITIONAL

    Adding up the gates:

    • Gate 0 — Indicator fidelitypass (standard daily VWAP with an EMA trend filter and ATR stop)
    • Gate 1 — Sanitypass (signals on closed bars, no look-ahead)
    • Gate 2 — Frictionpass (still profitable after 0.06%/side — the gate where RSI died)
    • Gate 3 — Yearly consistencypartial (trend-dependent, with long flat stretches)
    • Gate 4 — Out-of-samplepartial (3 of 5 positive)
    • Gate 5 — Robustnesspass (13 of 16 sweep cells positive)
    • Gate 6 — Multi-marketpartial (works on majors; BNB fatal)
    • Gate 7 — vs Buy & Holdpartial (beats it on 3 of 5 coins)

    Our verdict stamp says CONDITIONAL, and now the conditions are precise:

    Majors only (BTC/ETH). Reduced position size — the 37–42% drawdowns are real. As a portfolio component, not a standalone system. Traded outside those conditions, expect the BNB outcome.

    That nuance is the whole point of this site. A YouTube title would say “this VWAP strategy made 83% on ETH!” A different YouTube title would say “I tested VWAP and lost 50%!” Both are technically true. Neither is the truth.

    FAQ

    Why does it fail on BNB?
    BNB spent much of the window in choppy, range-bound conditions where trend filters generate false regime signals. The strategy needs trends; BNB didn’t provide them.

    Would a different VWAP (weekly, anchored) help?
    In our earlier tests, weekly VWAP performed worse as a touch level. Volume-profile POC levels also degraded results — daily VWAP carried all the edge.

    What about the low win rate — can I handle 3 losses out of 4?
    That’s the real question. Statistically it works; psychologically most people abandon it during the losing streaks. That’s a you-parameter, not a strategy parameter.

    Can I replicate this?
    Yes — the rules above are complete, data is public Binance OHLCV, fees 0.06%/side. Every number in this article falls out of those inputs.


    Disclaimer: This is educational research, not financial advice. Past performance does not guarantee future results. Never trade money you cannot afford to lose.