If UT Bot is the plumber of trading indicators, Lorentzian Classification is the astronaut. It is the single most-hyped “AI / machine-learning” indicator on TradingView — jdehorty’s open-source publication was voted TradingView’s Most Valuable Pine Script of 2023 — and the YouTube pitch is intoxicating: a k-nearest-neighbours classifier that “learns” historical market states and predicts the next move. The headline claim making the rounds: 73% win rate, 2.51 profit factor, 10.2% max drawdown.
We ran it through the full 7-Gate Protocol on 2 years of Binance data, 5 coins and 5 timeframes. It is a reject. And this time the fidelity question answers itself.
Gate 00 — We used the author’s own official code
Reimplementing a machine-learning indicator invites exactly one criticism: “you coded it wrong.” So we removed that possibility entirely. In 2024 jdehorty officially ported his own indicator to Python (the open-source advanced-ta package). We fed our Binance candles straight into his classifier and traded his buy/sell signals. There is no reimplementation to get wrong — the signals are, by construction, the ones his TradingView indicator produces.
The Exact Setup
- Indicator: Machine Learning: Lorentzian Classification (jdehorty), default settings — 5 features (RSI, WaveTrend, CCI, ADX), Lorentzian-distance k-NN, default volatility/regime/ADX filters
- Trades: the indicator’s own
startLongTrade/startShortTrade/ exit signals (default dynamic 4-bar exit) - Execution: enter/exit on the signal bar’s close — no look-ahead
- Costs: 0.06% per side; Data: Binance spot, Jul 2024–Jul 2026, BTC/ETH/SOL/BNB/XRP, 5m–1D; Benchmark: buy & hold
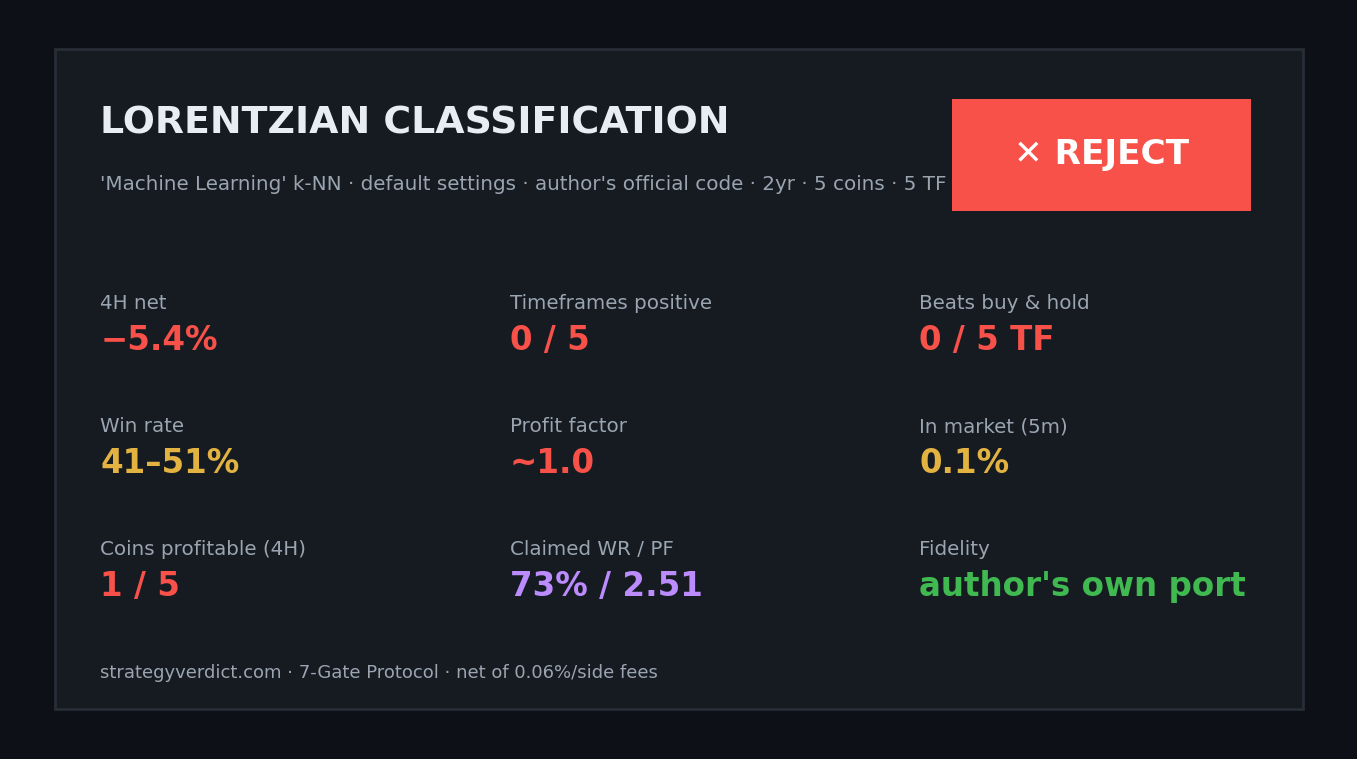
The verdict in one chart: it barely trades
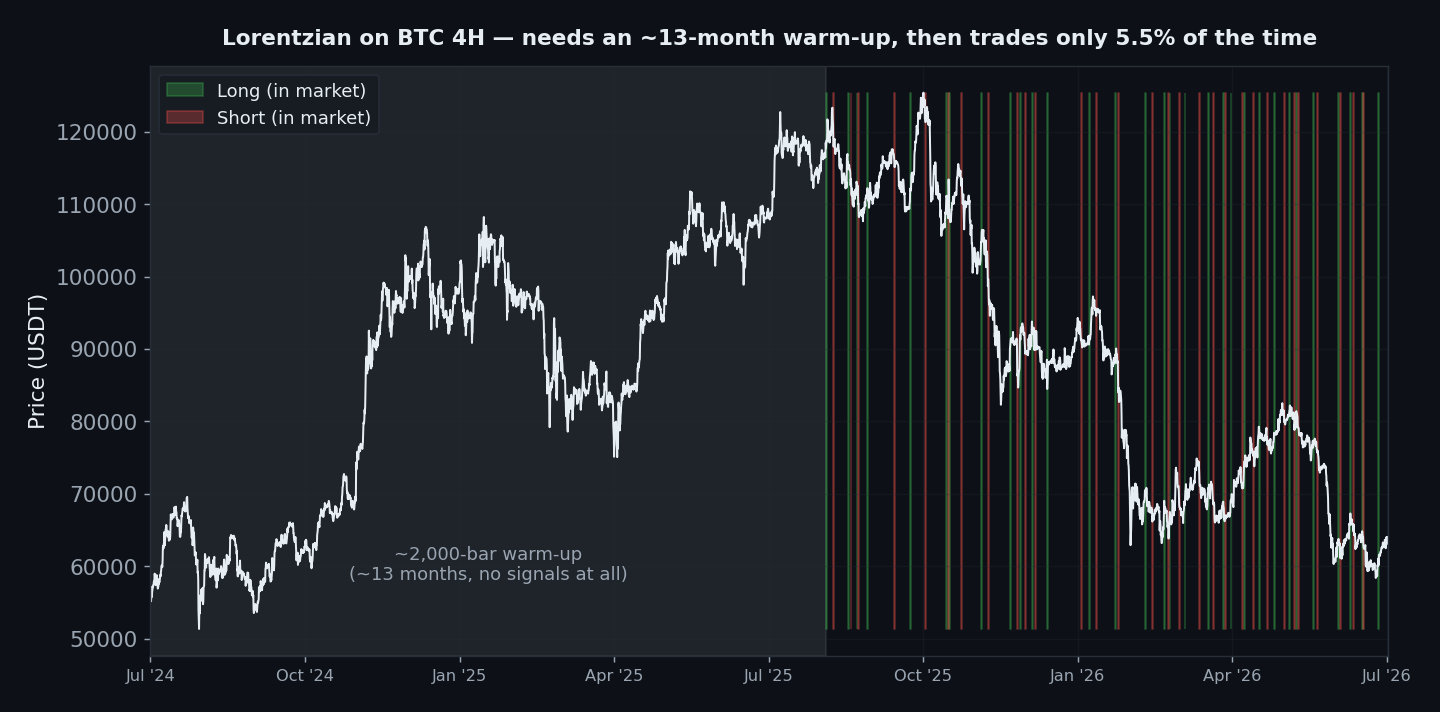
Here is the whole story. Before it fires a single signal, Lorentzian needs a ~2,000-bar warm-up — about 13 months on the 4-hour chart (and, absurdly, 5+ years on the daily). After that it is in the market roughly 5.5% of the time; the rest is cash. That is the secret behind the “low drawdown” everyone screenshots: you cannot lose much when you almost never have a position. You also cannot win.
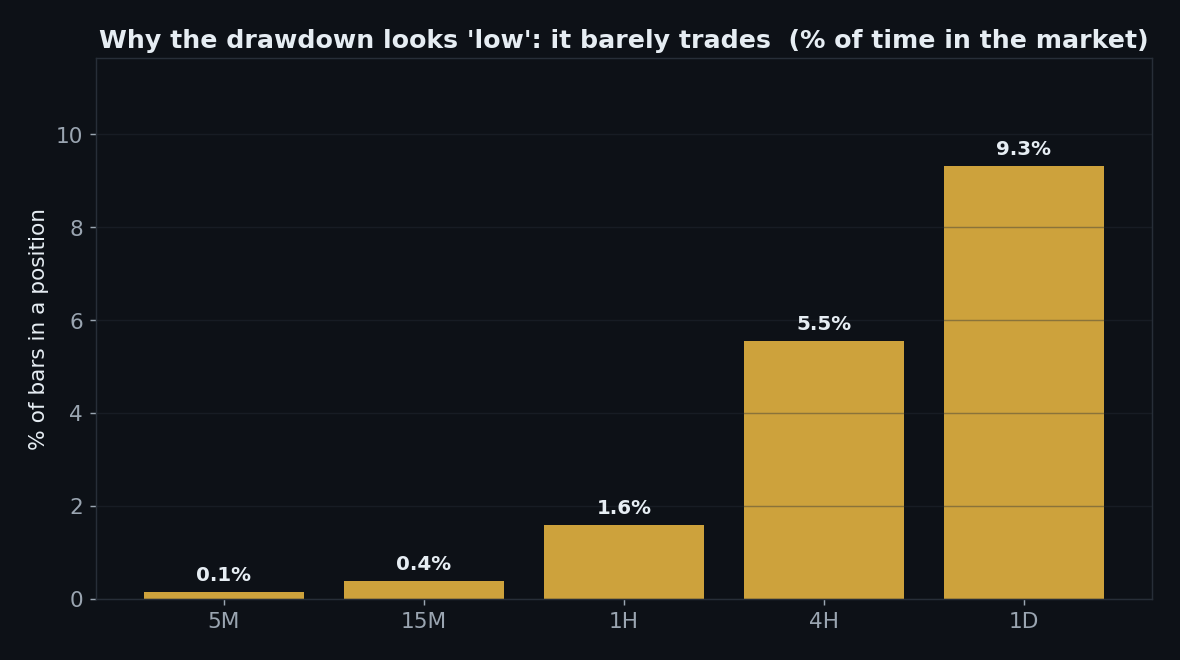
Drop to the timeframe the scalping videos love and it gets sillier: on 5-minute bars the strategy holds a position 0.1% of the time — effectively never — and still finishes down 8.8%.
Gate 06a — Every Timeframe
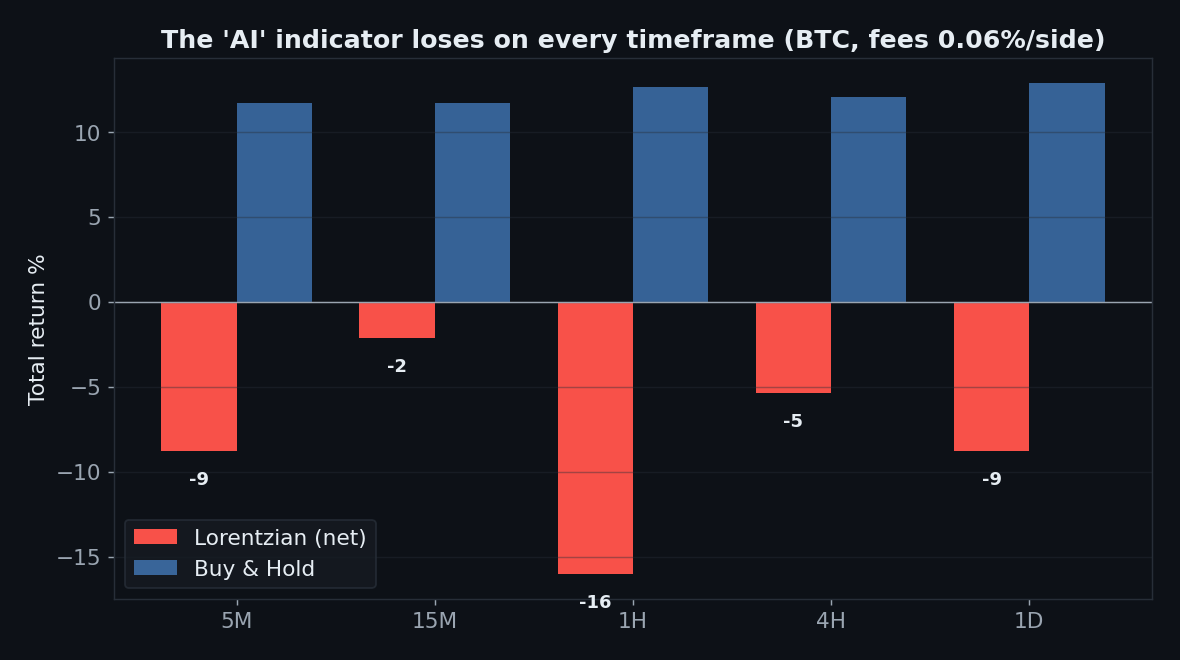
Five timeframes, five losses, and it loses to buy & hold on every single one: 5m −8.8%, 15m −2.1%, 1h −16.0%, 4h −5.4%, 1d −8.8% — versus B&H around +12% throughout. The much-advertised “AI edge” does not appear on any resolution.
Claim vs. reality
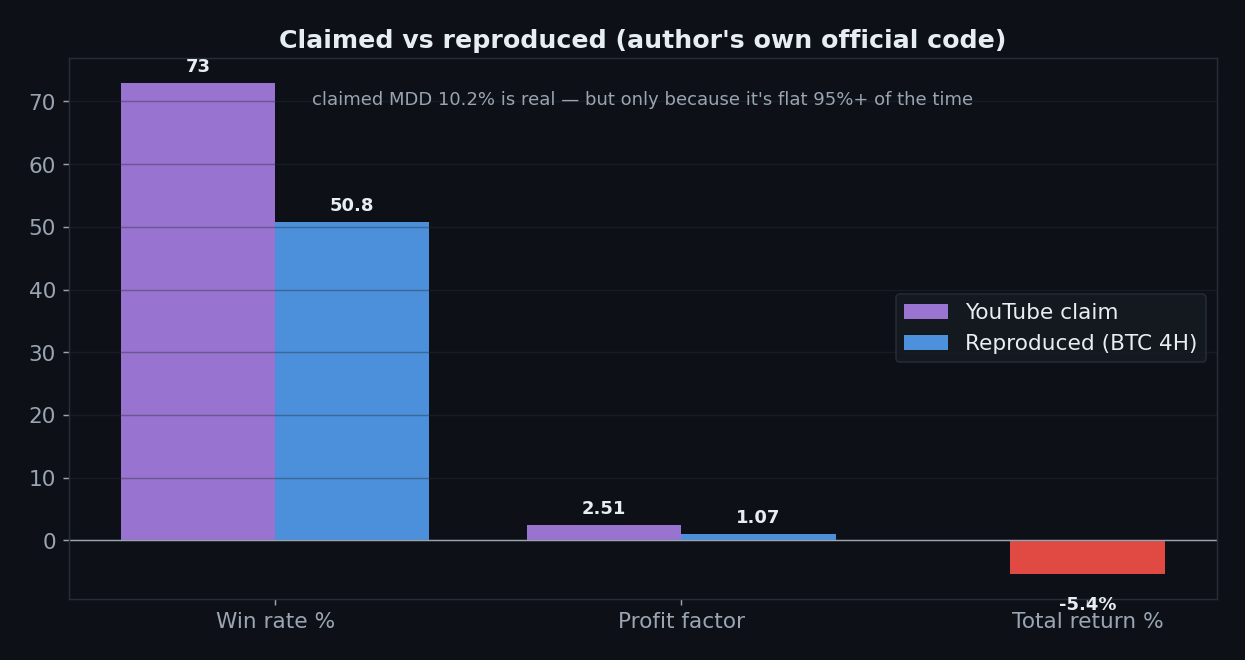
The screenshotted numbers do not reproduce. Claimed 73% win rate → measured 50.8% (BTC 4H, its best). Claimed PF 2.51 → measured 1.07. The only claim that survives is the low drawdown — and we’ve already seen why that one is an artifact of near-zero market exposure, not skill.
Gate 02 — Friction
The gross edge is wafer-thin. With zero fees the BTC 4H strategy makes +1.8%; at a realistic 0.06% per side it is −5.4%; at 0.11% it’s −11%. Whatever tiny signal exists is smaller than the cost of acting on it.
Gate 06b — Five Coins
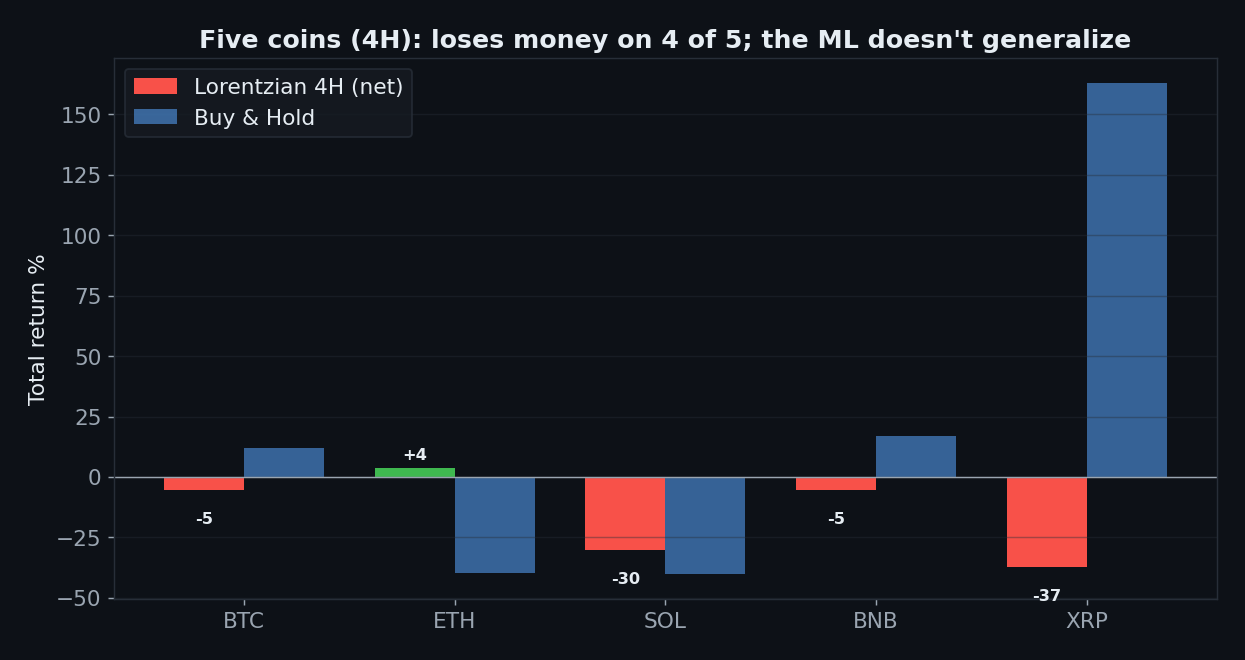
On the 4-hour chart it loses money on 4 of 5 coins (ETH +3.7% is the lone positive; SOL −30%, XRP −37%). A classifier that “learned” the market should generalize across similar liquid assets. This one does not.
Gate 04 — Out-of-Sample
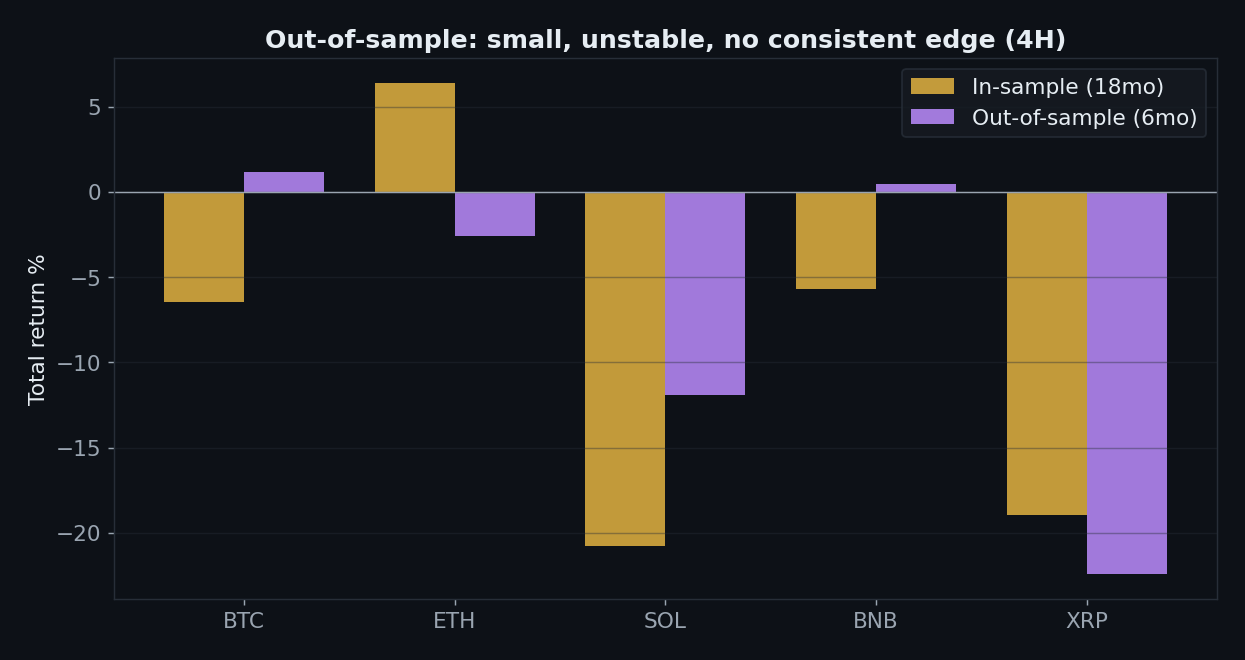
Split 18 months in / 6 months out and the results are small and unstable — only 2 of 5 coins positive out-of-sample, with profit factors flopping across the split. There is no persistent edge to carry forward.
What the equity curve actually looks like
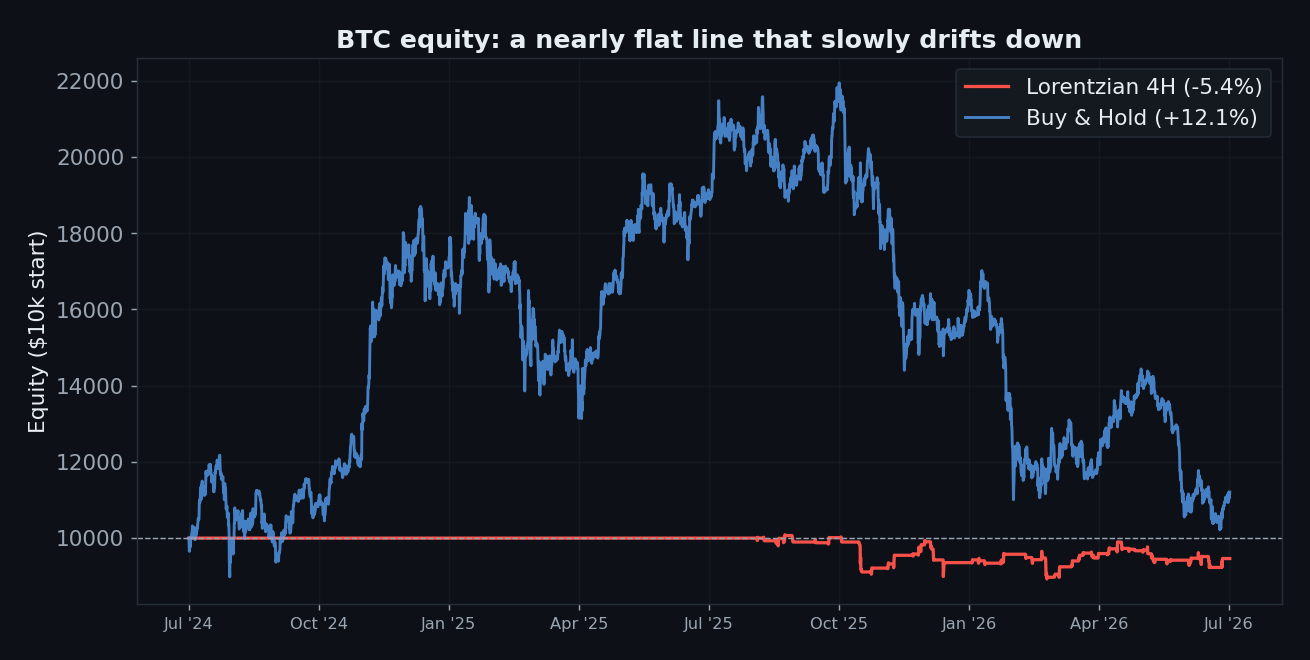
Not a crash, not a moonshot — a nearly flat line that slowly drifts downward. That is the honest portrait of “AI-powered price prediction” once you pay real fees and stop cherry-picking the window.
The Verdict: REJECT
- Gate 0 — Indicator fidelity — pass (we ran the author’s own official Python port, so the signals are his indicator’s by construction)
- Gate 1 — Sanity — pass (signals on closed bars, no look-ahead)
- Gate 2 — Friction — fail (+1.8% gross → −5.4% net on 4H)
- Gate 3 — Yearly consistency — fail (no consistently positive year; it barely holds a position)
- Gate 4 — Out-of-sample — fail (2/5 positive out-of-sample)
- Gate 5 — Robustness — fail (defaults; the multi-coin and out-of-sample results show nothing stable to tune)
- Gate 6 — Multi-market — fail (loses on 4 of 5 coins; 0 of 5 timeframes positive)
- Gate 7 — vs Buy & Hold — fail (behind buy & hold on every timeframe)
The most celebrated “machine-learning” indicator in retail trading, run through its creator’s own official code, produces a flat line that quietly loses to holding. Its famous low drawdown isn’t skill — it’s the by-product of a strategy that needs a year of warm-up and then sits in cash 95% of the time. “AI predicts the market” makes a great thumbnail. It does not make an edge.
FAQ
Isn’t Lorentzian Classification a serious, well-built indicator?
Yes — it’s genuinely clever engineering and deservedly won Most Valuable Pine Script. “Well-built” and “profitable to trade” are different questions. We only measured the second one.
Maybe you used the wrong settings?
We used the defaults, and we used the author’s own port. You can change features and filters, but that’s parameter-mining after the fact — and the multi-coin, out-of-sample results already show nothing stable to mine.
What about the low 10% drawdown?
Real, and meaningless: it comes from being in the market ~5% of the time (0.1% on 5m). Cash has a 0% drawdown too.
Can I replicate this?
Completely. Public Binance OHLCV, advanced-ta defaults, 0.06%/side. We didn’t hand-build the indicator — the person who invented it did.
See also: UT Bot, Triple SuperTrend, Golden Cross, RSI 30/70, and VWAP pullback (our one conditional pass).
Disclaimer: educational research, not financial advice. Past performance does not guarantee future results. Never trade money you cannot afford to lose.
Leave a Reply