Tag: Trend Following

  • TRIX Indicator Strategy Backtest: a Genuine Daily Momentum Edge

    TRIX Indicator Strategy Backtest: a Genuine Daily Momentum Edge

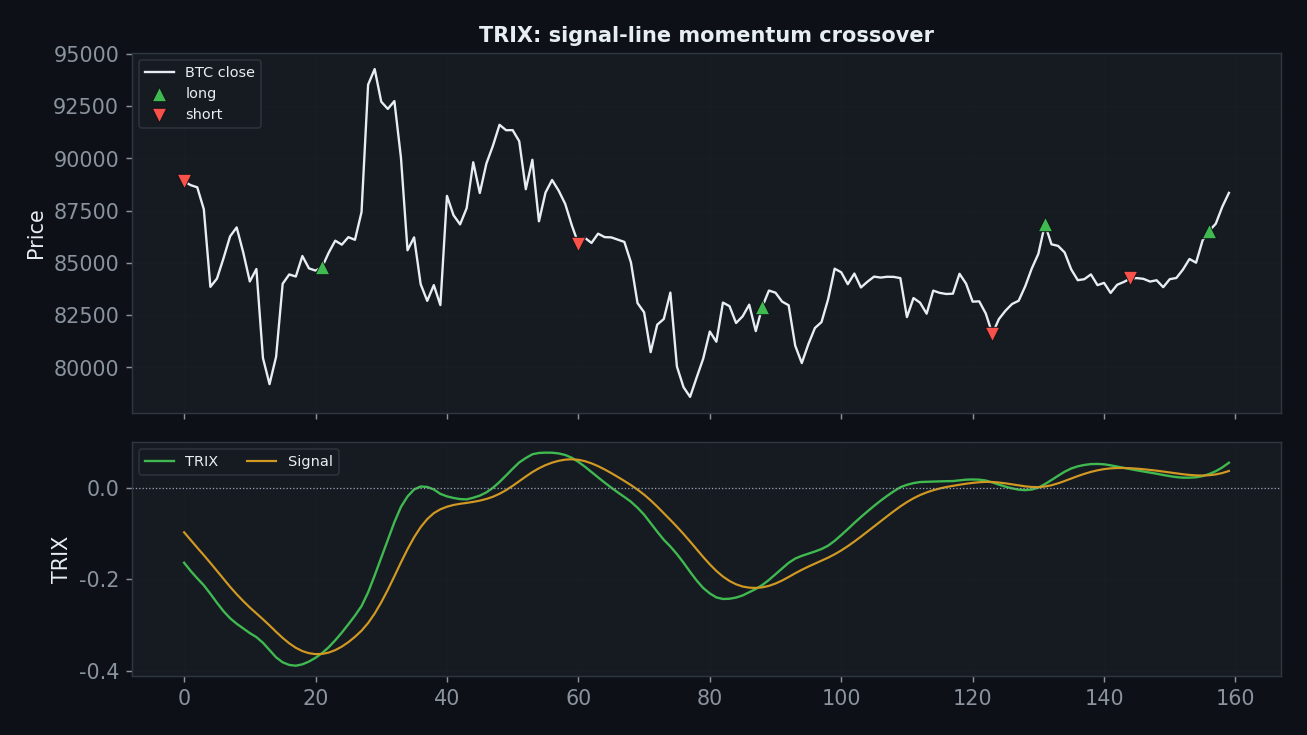
    TRIX is a triple-smoothed momentum oscillator — the heavy smoothing is designed to filter noise and leave only the dominant trend. The taught signal is the TRIX/signal-line cross. Unlike most of this series, it earned a conditional pass. We ran the standard TRIX(18) through the 7-Gate Protocol. Verdict: conditional.

    Methodology

    • Data: Binance spot, Jul 2024–Jul 2026 (2 years), BTC/ETH/SOL/BNB/XRP
    • Timeframes: 5m–1D (9 buckets, incl. resampled)
    • Execution: TRIX is the 1-bar rate-of-change of a triple-smoothed EMA of price. Long when TRIX crosses above its signal line, short when below. Closed-bar, no look-ahead
    • Friction: 0.06%/side (real); 0-fee gross reported too. Benchmark: buy & hold
    • Six axes: timeframe, trix length, TP:SL, multi-coin, yearly, out-of-sample

    Gate 0 — Fidelity

    TRIX is the 1-bar rate-of-change of a triple-smoothed EMA of price. Long when TRIX crosses above its signal line, short when below. Reproduced exactly (pass).
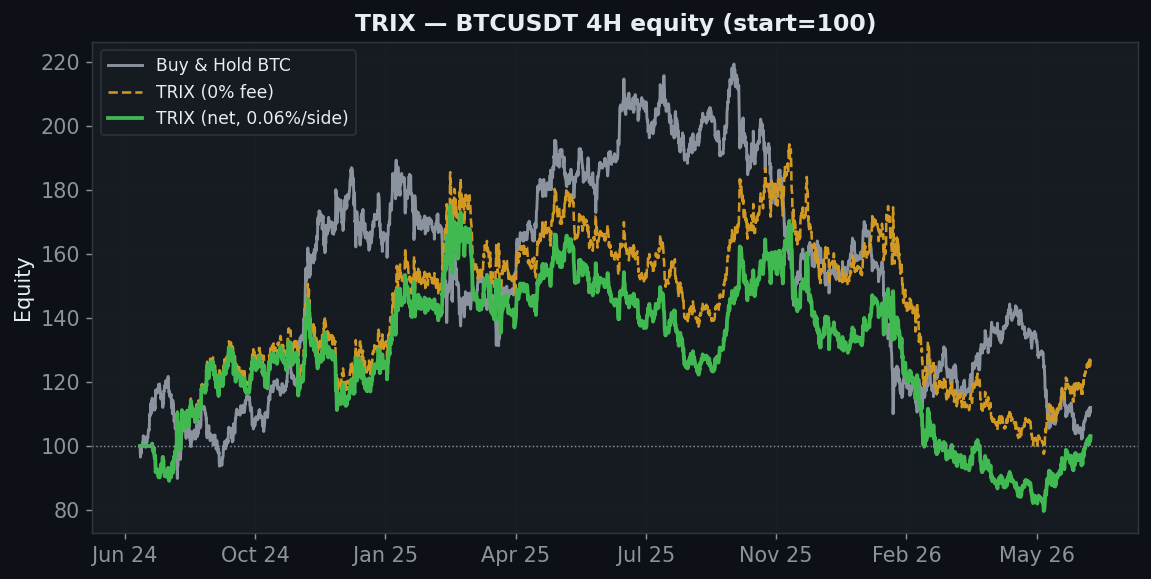
    TRIX equity chart, StrategyVerdict 7-gate backtest

    How It Behaves

    TRIX sig chart, StrategyVerdict 7-gate backtest

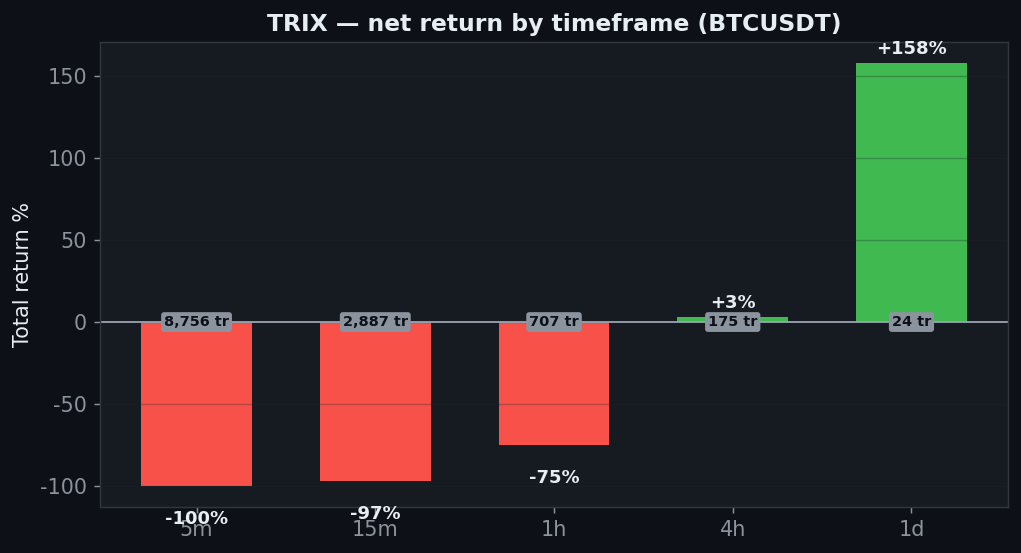
    Triple smoothing makes TRIX slow — and on crypto that’s a feature on the higher timeframes. It ignores intraday noise and only flips on sustained momentum shifts, so on the daily it holds big trends beautifully (+158%). The cost of that patience shows up as thinness on the faster 4H.

    Axis 1 — Timeframe

    Timeframe Trades Gross (0 fee) Net (real)
    5분 8,756 −22% −100%
    15분 2,887 −9% −97%
    30분 1,400 −15% −84%
    1시간 707 −41% −75%
    2시간 336 +33% −11%
    4시간 175 +27% +3%
    6시간 120 −32% −41%
    12시간 57 −34% −39%
    1일 24 +166% +158%

    The daily is the story: +158% net. The 4H is only marginally positive (+3%), and lower timeframes lose as the smoothing lag stops helping. This is a higher-timeframe tool, and the daily is where it belongs.
    TRIX tf chart, StrategyVerdict 7-gate backtest

    Axis 2 — TRIX length

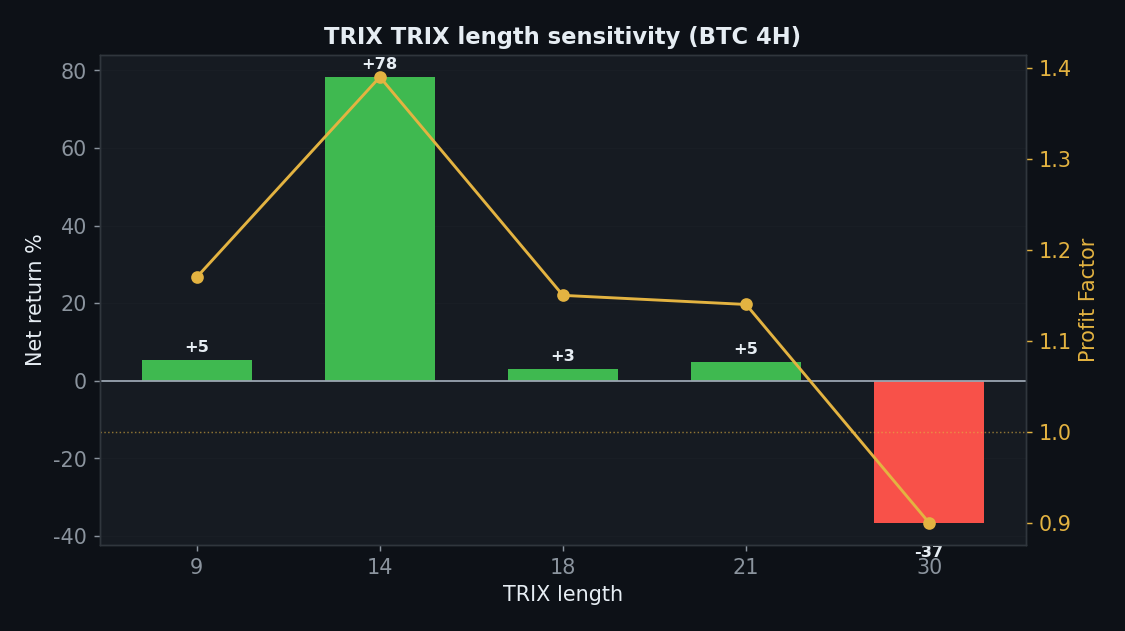
    TRIX length Net PF
    9 +5% 1.17
    14 +78% 1.39
    18 +3% 1.15
    21 +5% 1.14
    30 −37% 0.90

    Robust where it counts: 4 of 5 periods are positive (9, 14, 18, 21), with 14 strongest (+78%). Only the longest (30) loses. That’s a genuine plateau, not a single lucky point.
    TRIX sens_param chart, StrategyVerdict 7-gate backtest

    Axis 3 — TP:SL

    TP:SL Net PF
    1:0.5 +9% 1.08
    1:1 +47% 1.21
    1:1.5 +31% 1.15
    1:2 +67% 1.25
    1:2.5 +36% 1.17
    1:3 +34% 1.17
    1:4 +20% 1.13
    1:5 +33% 1.17

    All eight TP:SL ratios are positive (PF above 1 throughout), peaking at 1:2 (+67%). A robust profit surface across exits — the hallmark of a real edge.
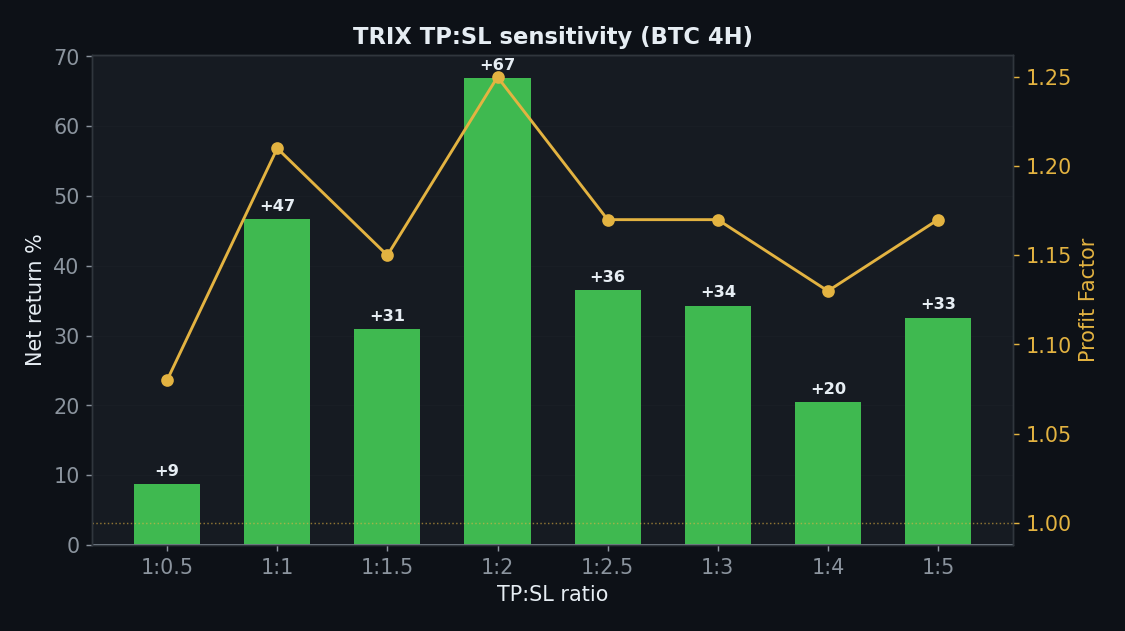
    TRIX sens_tpsl chart, StrategyVerdict 7-gate backtest

    Axis 4 — Five Coins

    Coin Strategy net Buy & Hold
    BTC +3% +12%
    ETH −29% −40%
    SOL −74% −40%
    BNB −43% +17%
    XRP +174% +163%

    Here’s the catch: only 2 of 5 coins clearly win (BTC +3%, XRP +175%). ETH, SOL and BNB lose. The edge concentrates in the strong trenders, so it isn’t an all-market system.
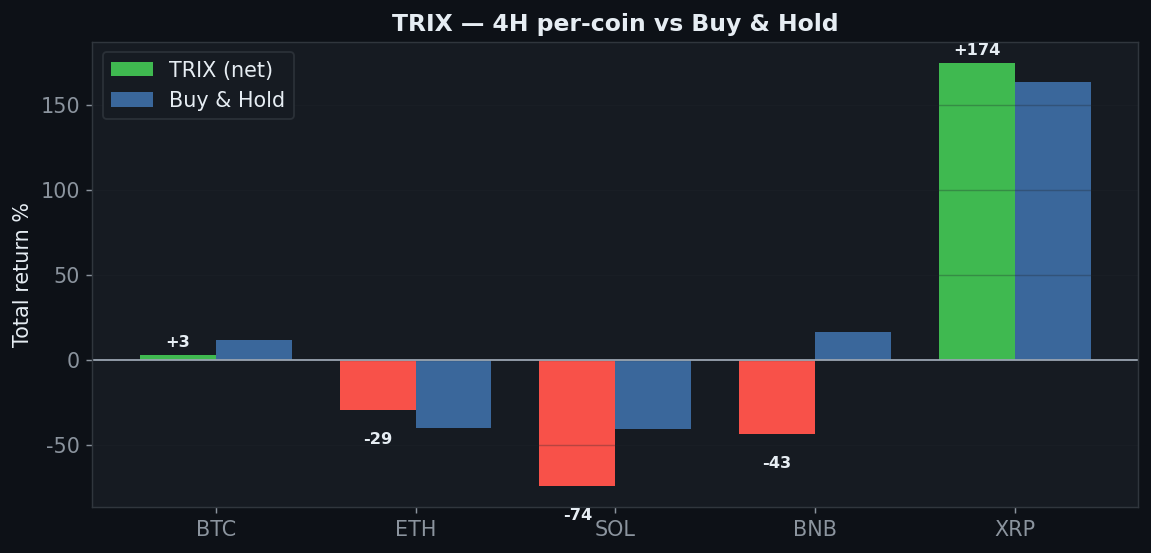
    TRIX coins chart, StrategyVerdict 7-gate backtest

    Axis 5 — Yearly

    Year BTC 4H net
    2024 +19%
    2025 +9%
    2026 −21%

    The standout: +19% (2024), +9% (2025), −21% (2026). It is the only strategy in this series that stayed positive through 2025’s grind — strong evidence the daily edge is more than one-year luck.

    Axis 6 — Friction
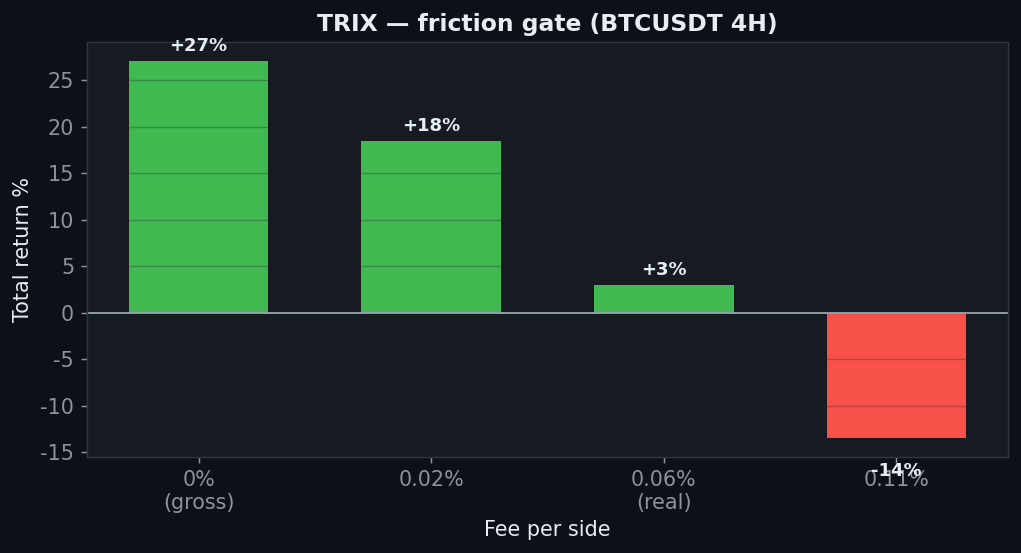
    TRIX friction chart, StrategyVerdict 7-gate backtest

    4H friction: +27% gross → +3% net → −14% at 0.11%. The 4H is churn-sensitive; the daily, with far fewer trades, keeps the bulk of its edge.

    The Verdict: CONDITIONAL

    • Gate 0 — Indicator fidelitypass (standard TRIX(18))
    • Gate 1 — Sanitypass
    • Gate 2 — Frictionconditional — daily edge survives; 4H is thin and churn-sensitive
    • Gate 3 — Yearlypass — +19 / +9 / −21; the only one positive through 2025
    • Gate 4 — Robustness (period)pass — 4 of 5 periods positive
    • Gate 5 — Robustness (TP:SL)pass — all 8 positive
    • Gate 6 — Multi-marketfail — 2 of 5 coins
    • Gate 7 — vs Buy & Holdpass — daily +158% crushes holding

    TRIX is the second genuine edge of the batch. On the daily it returns +158%, every take-profit ratio is positive, four of five periods work, and — alone in this series — it stayed green through 2025’s chop. The catch: the 4H is thin (+3%) and only 2 of 5 coins win. As a daily momentum filter in trending markets it passes cleanly; as an all-timeframe, all-coin system it doesn’t. Conditional.

    FAQ

    Why does TRIX work when the Awesome Oscillator didn’t?
    Both are momentum, but TRIX’s triple smoothing filters far more noise, so on the daily it flips only on real momentum shifts rather than chop. The trade-off is lag — which is why its own 4H is thin. It’s a higher-timeframe instrument.

    Is +158% on the daily reliable?
    It rests on relatively few daily trades, so treat the exact figure with caution. But the supporting gates — robust across periods and exits, and positive through 2025 — are what make it a conditional pass rather than a fluke.

    Can I replicate this?
    Yes — TRIX(18) signal cross, public Binance data, 0.06%/side, five coins, nine timeframes. Every table reproduces.

    See also the other conditional passes Vortex and Ichimoku (daily), and the rejects Keltner and Donchian.


    Disclaimer: educational research, not financial advice. Past performance does not guarantee future results. Never trade money you cannot afford to lose.
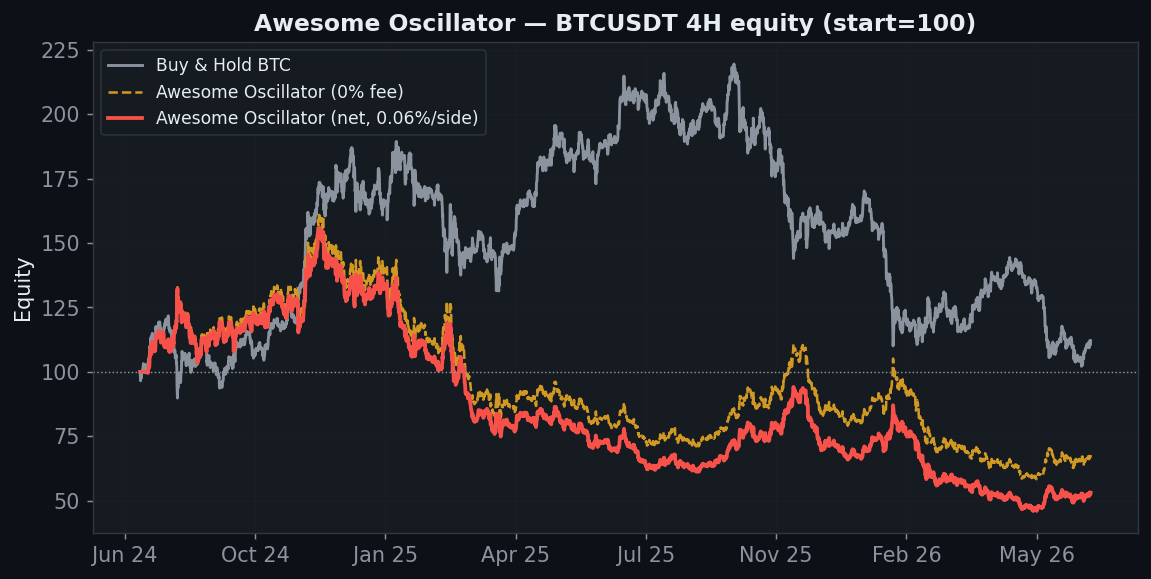
  • Awesome Oscillator Strategy Backtest: the Standard Setting Loses Everywhere but the Daily

    Awesome Oscillator Strategy Backtest: the Standard Setting Loses Everywhere but the Daily

    Bill Williams’ Awesome Oscillator (AO) is a staple momentum histogram: the gap between a fast and slow average of the median price. The taught signal is the zero-line cross. We ran the standard AO(5/34) through the 7-Gate Protocol. Verdict: reject.

    Methodology

    • Data: Binance spot, Jul 2024–Jul 2026 (2 years), BTC/ETH/SOL/BNB/XRP
    • Timeframes: 5m–1D (9 buckets, incl. resampled)
    • Execution: The Awesome Oscillator is SMA(median, 5) minus SMA(median, 34). Long when AO is above zero, short when below. Closed-bar, no look-ahead
    • Friction: 0.06%/side (real); 0-fee gross reported too. Benchmark: buy & hold
    • Six axes: timeframe, slow sma, TP:SL, multi-coin, yearly, out-of-sample

    Gate 0 — Fidelity

    The Awesome Oscillator is SMA(median, 5) minus SMA(median, 34). Long when AO is above zero, short when below. Reproduced exactly (pass).

    Awesome Oscillator equity chart, StrategyVerdict 7-gate backtest

    How It Behaves

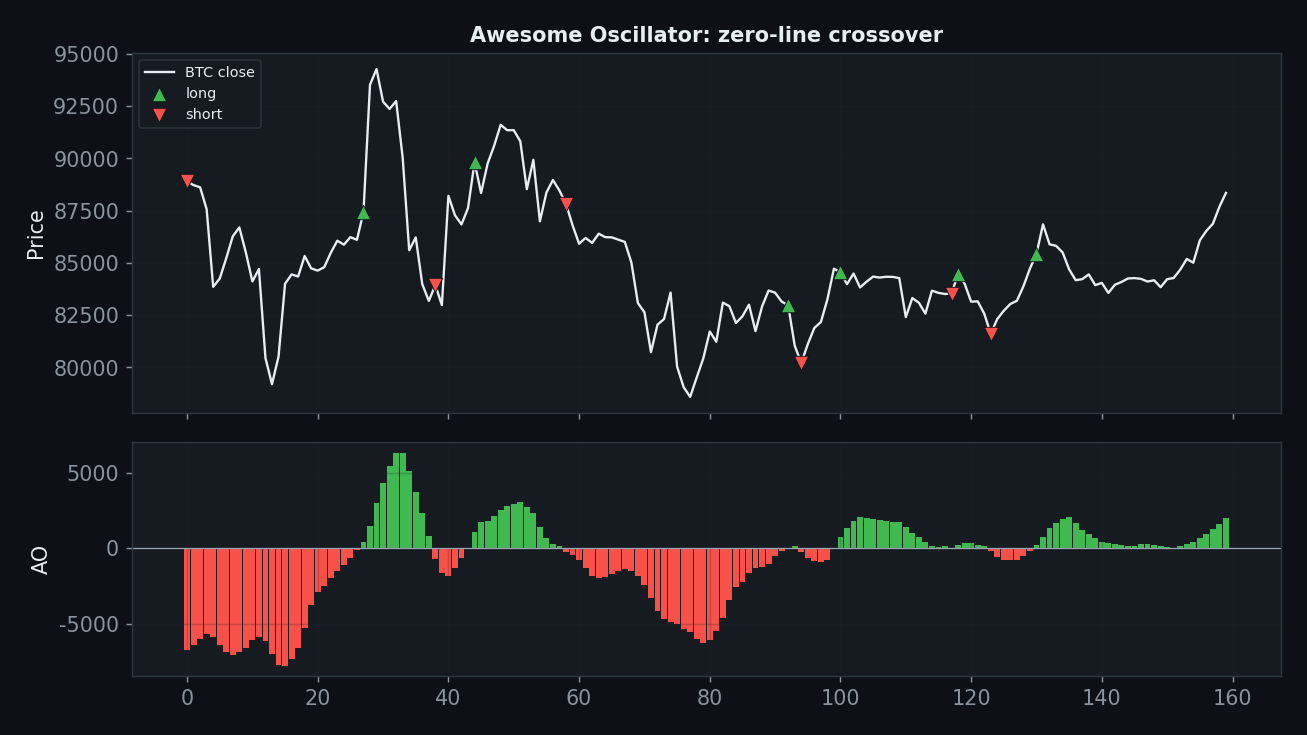
    Awesome Oscillator sig chart, StrategyVerdict 7-gate backtest

    The zero-line cross is a slow, laggy dual-SMA crossover in disguise. It enters late into moves and, in choppy conditions, crosses back and forth around zero — late entries plus whipsaw, the worst of both.

    Axis 1 — Timeframe

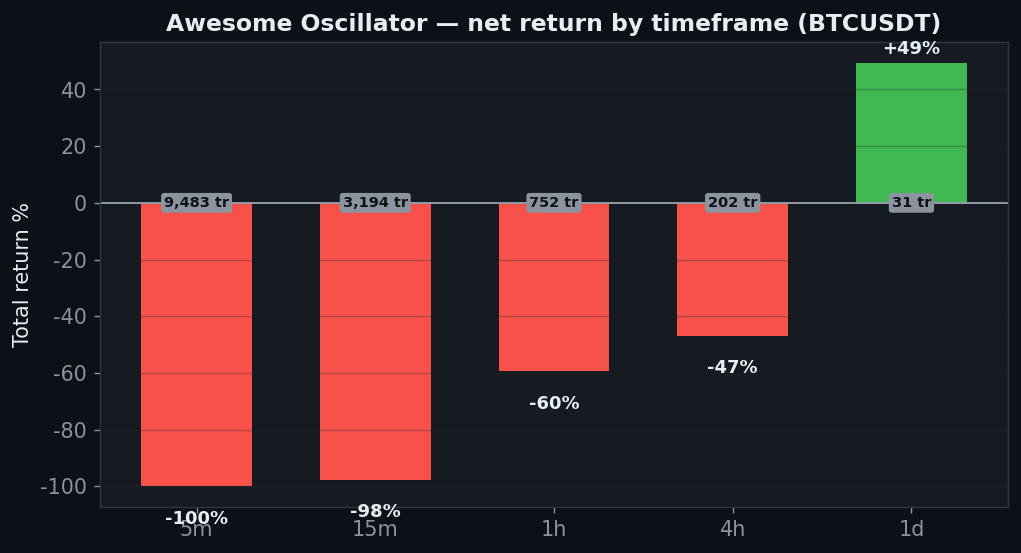
    Timeframe Trades Gross (0 fee) Net (real)
    5분 9,483 −10% −100%
    15분 3,194 +5% −98%
    30분 1,548 −35% −90%
    1시간 752 +0% −60%
    2시간 336 +98% +32%
    4시간 202 −32% −47%
    6시간 130 +4% −11%
    12시간 56 +86% +74%
    1일 31 +55% +49%

    Only the daily is positive (+49%); the standard 4H loses 47% and is negative even at zero fees. A single working timeframe with the default losing everywhere else is not an edge.

    Awesome Oscillator tf chart, StrategyVerdict 7-gate backtest

    Axis 2 — Slow SMA

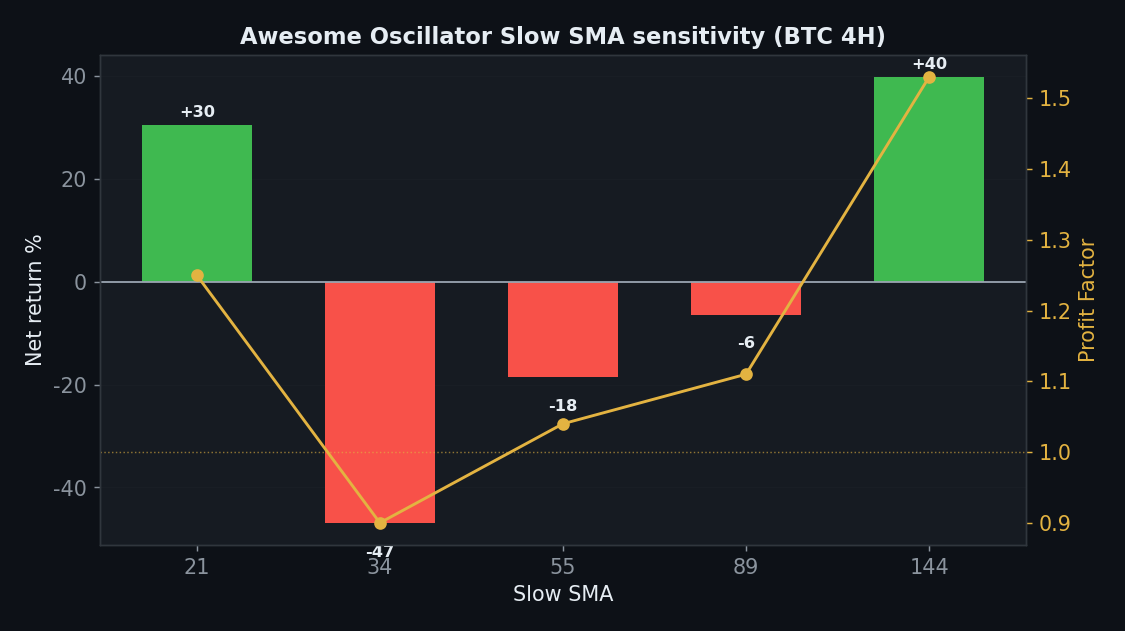
    Slow SMA Net PF
    21 +30% 1.25
    34 −47% 0.90
    55 −18% 1.04
    89 −6% 1.11
    144 +40% 1.53

    The default slow length (34) loses. Only the extremes — 21 and 144 — are positive, with everything in between negative. The taught setting sits in a losing zone; the wins are non-adjacent outliers.

    Awesome Oscillator sens_param chart, StrategyVerdict 7-gate backtest

    Axis 3 — TP:SL

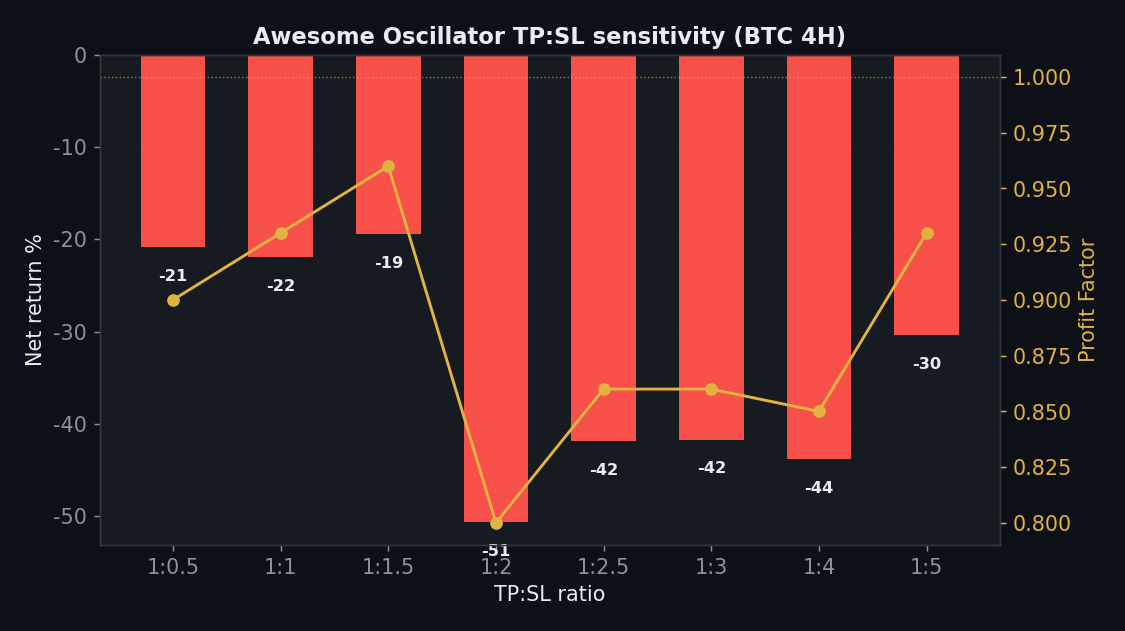
    TP:SL Net PF
    1:0.5 −21% 0.90
    1:1 −22% 0.93
    1:1.5 −19% 0.96
    1:2 −51% 0.80
    1:2.5 −42% 0.86
    1:3 −42% 0.86
    1:4 −44% 0.85
    1:5 −30% 0.93

    All eight TP:SL ratios lose. As with the HMA, there is no gross edge for any exit to protect.

    Awesome Oscillator sens_tpsl chart, StrategyVerdict 7-gate backtest

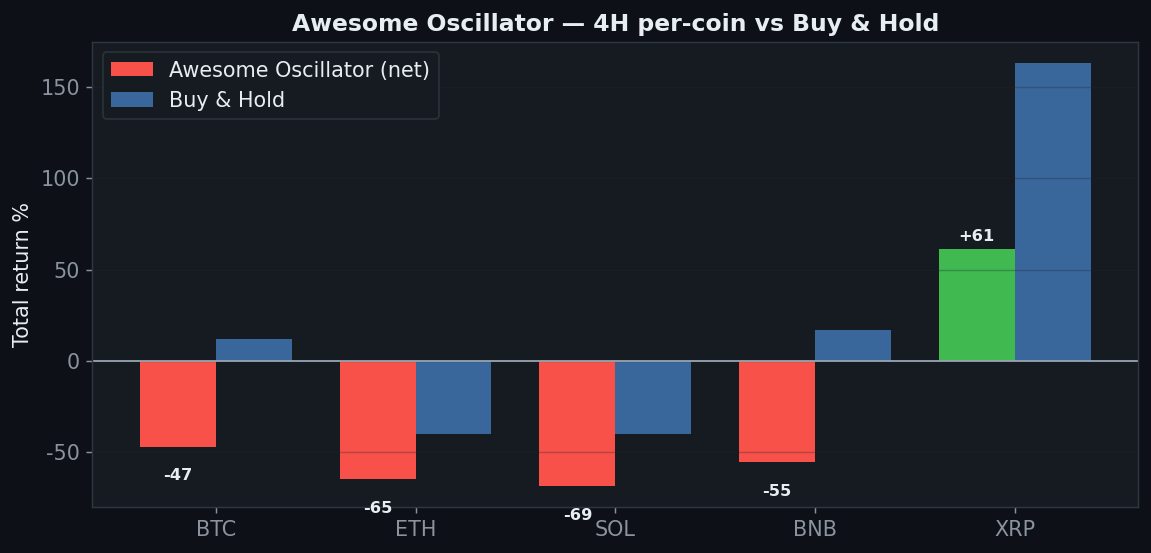
    Axis 4 — Five Coins

    Coin Strategy net Buy & Hold
    BTC −47% +12%
    ETH −65% −40%
    SOL −69% −40%
    BNB −55% +17%
    XRP +61% +163%

    Only 1 of 5 coins (XRP) is positive; BTC, ETH, SOL and BNB all lose 47–69%. The signal is broadly destructive across markets.

    Awesome Oscillator coins chart, StrategyVerdict 7-gate backtest

    Axis 5 — Yearly

    Year BTC 4H net
    2024 +31%
    2025 −49%
    2026 −21%

    2024 +31%, then 2025 −49% and 2026 −21%. One good year, two bad — the same fading pattern as the other rejects.

    Axis 6 — Friction

    Awesome Oscillator friction chart, StrategyVerdict 7-gate backtest

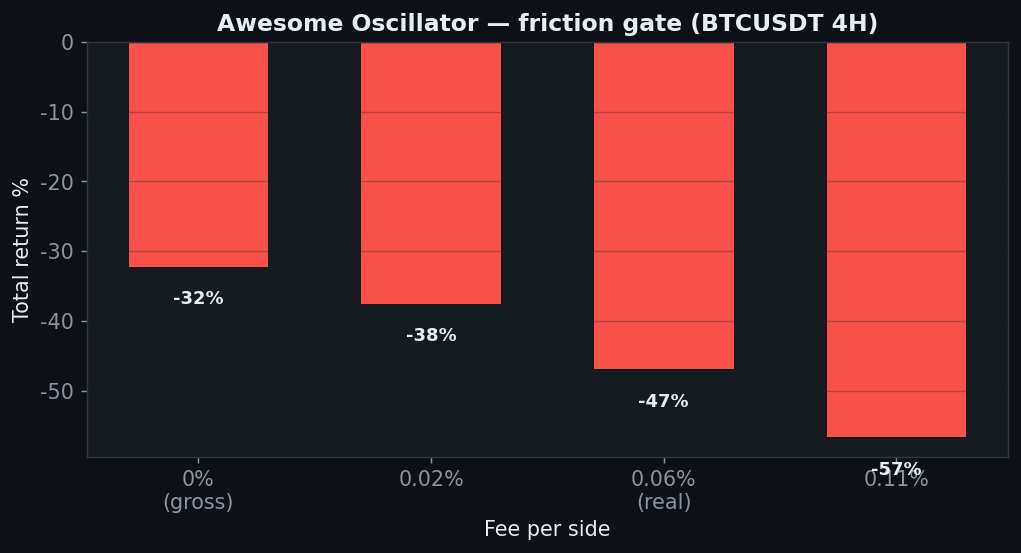
    −32% gross → −47% net → −57% at 0.11%. A losing signal made worse by 202 trades of cost.

    The Verdict: REJECT

    • Gate 0 — Indicator fidelitypass (standard AO 5/34)
    • Gate 1 — Sanitypass
    • Gate 2 — Frictionfail — −32% gross, −47% net on 4H
    • Gate 3 — Yearlyfail — +31 / −49 / −21
    • Gate 4 — Robustness (length)fail — the default 34 loses; only outliers 21/144 win
    • Gate 5 — Robustness (TP:SL)fail — 0 of 8 positive
    • Gate 6 — Multi-marketfail — 1 of 5 coins
    • Gate 7 — vs Buy & Holdfail — negative on 4 of 5 timeframes

    The Awesome Oscillator’s zero-line cross is a laggy dual-SMA crossover, and it behaves like one: the standard 5/34 loses 47% on BTC 4H (negative before fees), every TP:SL ratio loses, and only 1 of 5 coins survives. The one positive timeframe is the daily — while the default setting loses everywhere else. A momentum oscillator with no momentum edge. Reject.

    FAQ

    The AO has other signals (twin peaks, saucer) — did you test those?
    No — those are discretionary pattern reads that can’t be mechanized without ambiguity. We tested the one unambiguous rule, the zero-line cross. The subjective signals would need their own defined, testable rules first.

    It’s positive on the daily though.
    On one timeframe, while the standard setting loses on the other four and on 4 of 5 coins. One green cell in a sea of red is noise, not a strategy.

    Can I replicate this?
    Yes — AO(5/34) zero cross, public Binance data, 0.06%/side, five coins, nine timeframes. Every table reproduces.

    See also the rejects Keltner and Donchian, and the conditional Vortex.


    Disclaimer: educational research, not financial advice. Past performance does not guarantee future results. Never trade money you cannot afford to lose.
  • SSL Channel Strategy Backtest: a Real Gross Edge That Churn Eats Alive

    SSL Channel Strategy Backtest: a Real Gross Edge That Churn Eats Alive

    The SSL Channel is a popular crypto trend tool: two smoothed bands of highs and lows, with a flip when price closes through one. It looks clean on the chart. We ran the standard SSL(10) through the 7-Gate Protocol — and it produced the most interesting failure in this batch. Verdict: reject.

    Methodology

    • Data: Binance spot, Jul 2024–Jul 2026 (2 years), BTC/ETH/SOL/BNB/XRP
    • Timeframes: 5m–1D (9 buckets, incl. resampled)
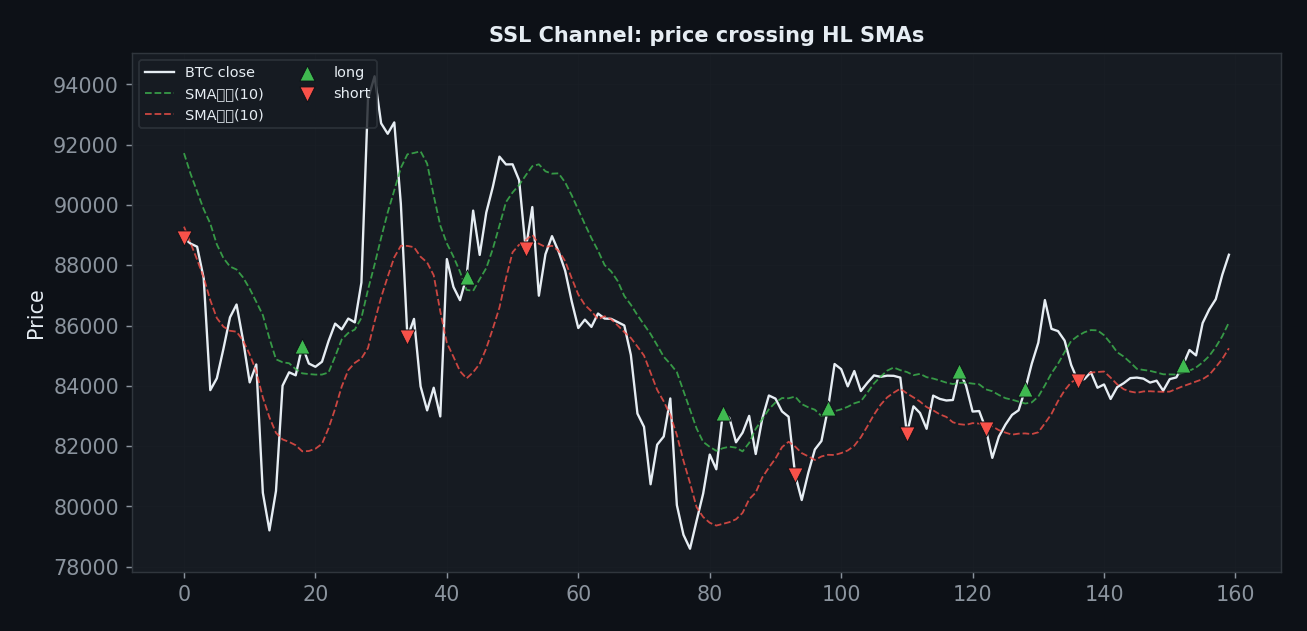
    • Execution: SSL builds two SMAs — one of highs, one of lows. Close above the high-SMA flips long; close below the low-SMA flips short. Closed-bar, no look-ahead
    • Friction: 0.06%/side (real); 0-fee gross reported too. Benchmark: buy & hold
    • Six axes: timeframe, ssl length, TP:SL, multi-coin, yearly, out-of-sample

    Gate 0 — Fidelity

    SSL builds two SMAs — one of highs, one of lows. Close above the high-SMA flips long; close below the low-SMA flips short. Reproduced exactly (pass).

    SSL Channel equity chart, StrategyVerdict 7-gate backtest

    How It Behaves

    SSL Channel sig chart, StrategyVerdict 7-gate backtest

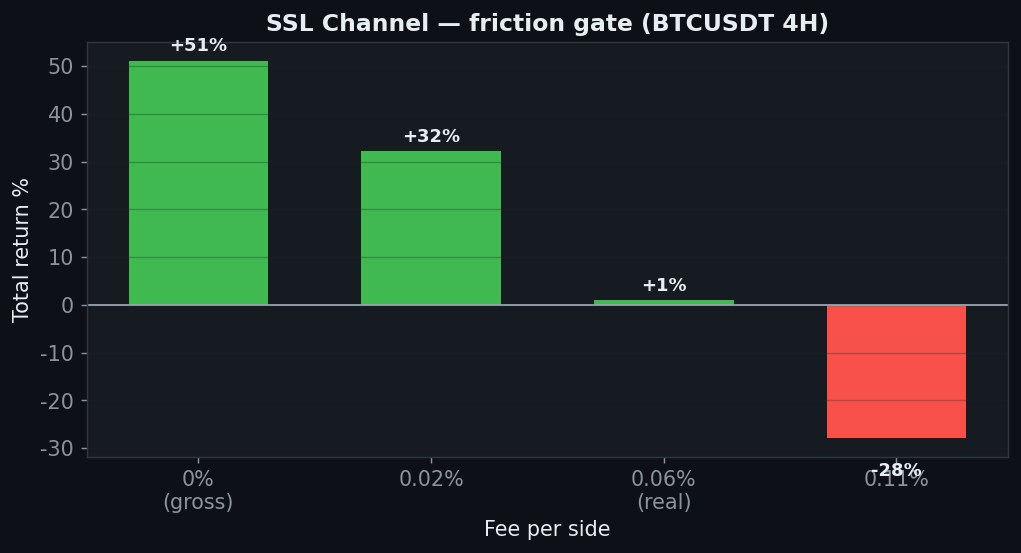
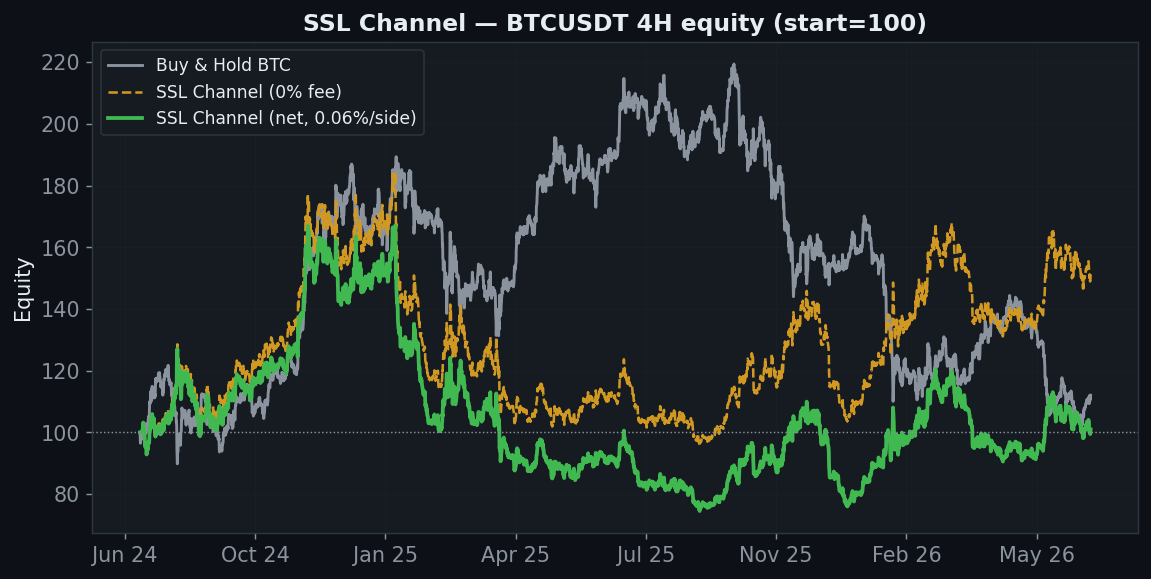
    SSL genuinely catches trends: at zero fees the BTC 4H returns +51%. The problem is turnover. Price closes back and forth across the bands during consolidations, generating 336 trades — and at real fees those crossings eat the entire edge.

    Axis 1 — Timeframe

    Timeframe Trades Gross (0 fee) Net (real)
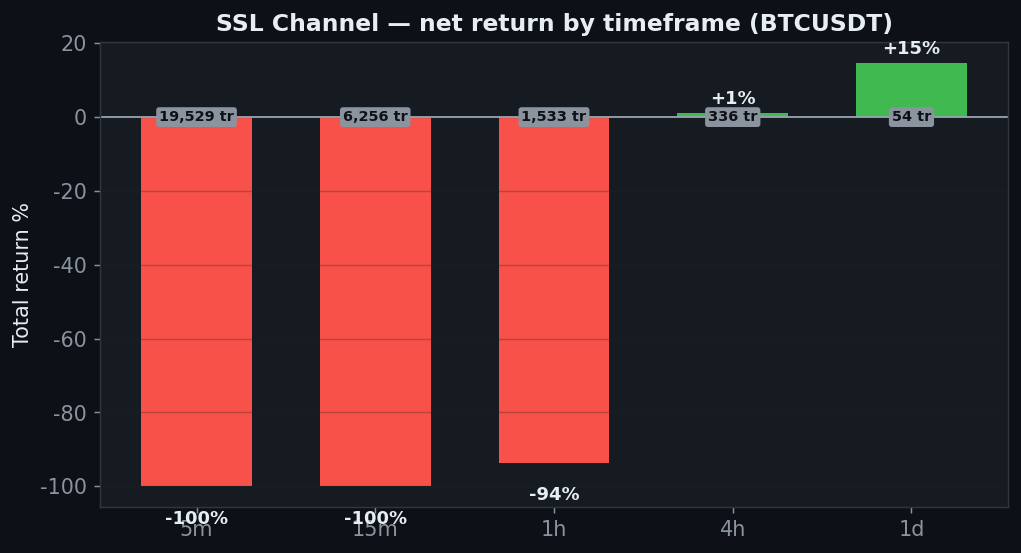
    5분 19,529 −66% −100%
    15분 6,256 −32% −100%
    30분 3,072 −45% −99%
    1시간 1,533 −60% −94%
    2시간 740 −33% −73%
    4시간 336 +51% +1%
    6시간 214 +121% +71%
    12시간 116 −12% −23%
    1일 54 +22% +15%

    The 4H nets a mere +1% (from +51% gross), and the daily +15%. Every lower timeframe is deeply negative. There’s a real signal buried here, but only the daily keeps any of it after costs.

    SSL Channel tf chart, StrategyVerdict 7-gate backtest

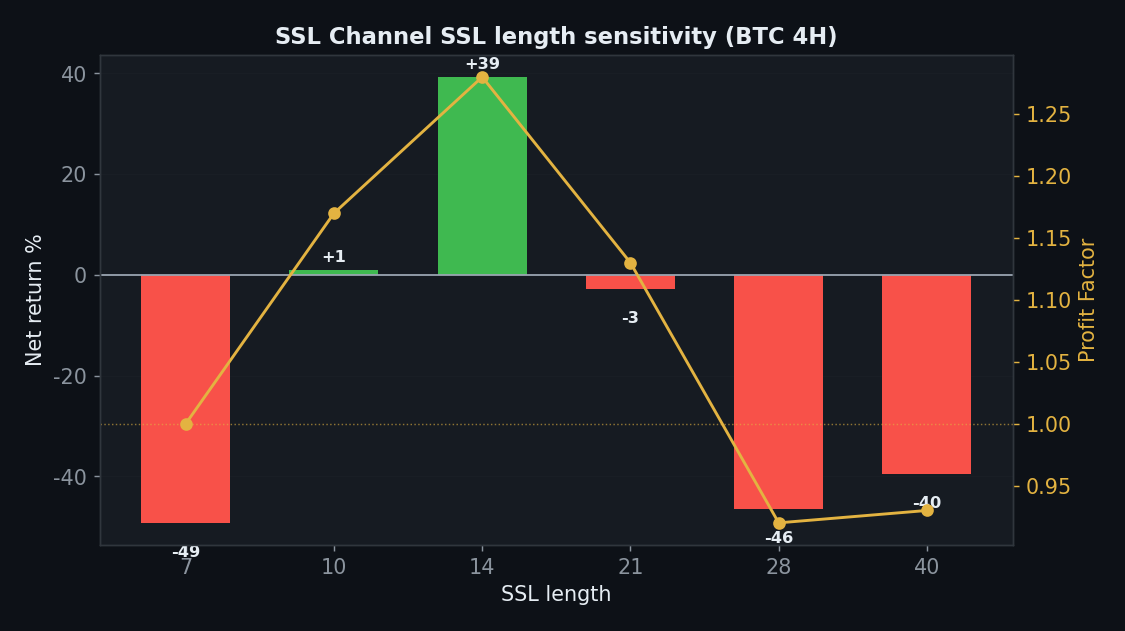
    Axis 2 — SSL length

    SSL length Net PF
    7 −49% 1.00
    10 +1% 1.17
    14 +39% 1.28
    21 −3% 1.13
    28 −46% 0.92
    40 −40% 0.93

    Length 14 is the sweet spot (+39%), 10 barely positive, and everything else negative. A narrow, fragile band of working settings around the default.

    SSL Channel sens_param chart, StrategyVerdict 7-gate backtest

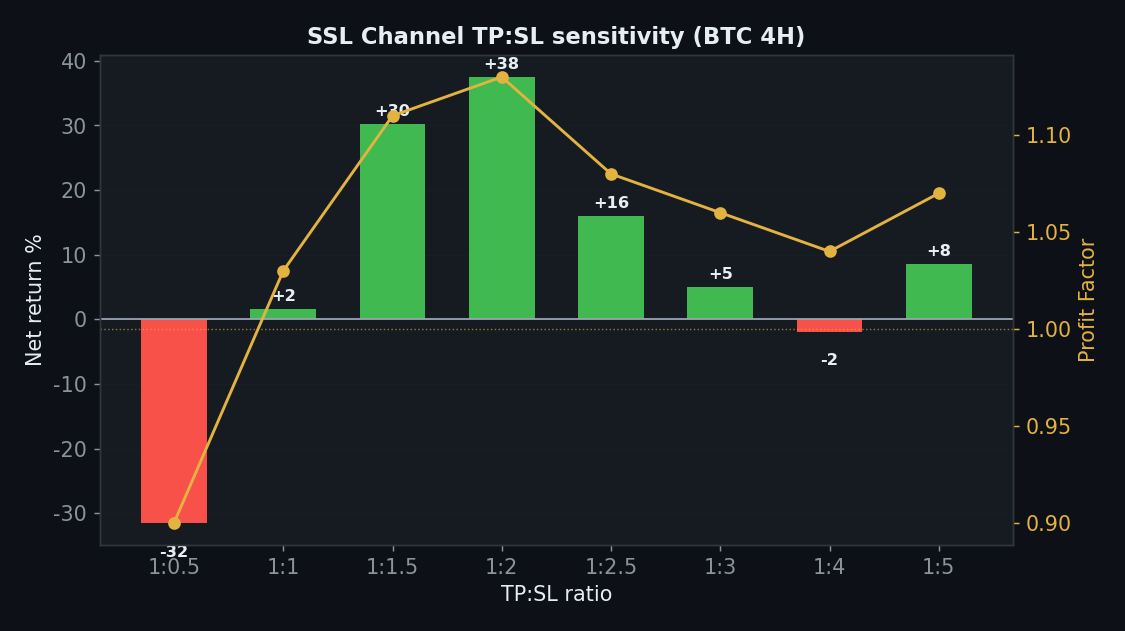
    Axis 3 — TP:SL

    TP:SL Net PF
    1:0.5 −32% 0.90
    1:1 +2% 1.03
    1:1.5 +30% 1.11
    1:2 +38% 1.13
    1:2.5 +16% 1.08
    1:3 +5% 1.06
    1:4 −2% 1.04
    1:5 +8% 1.07

    6 of 8 TP:SL ratios are positive — more evidence the underlying signal has merit. But a good exit can’t fix a strategy whose base version nets +1% after fees.

    SSL Channel sens_tpsl chart, StrategyVerdict 7-gate backtest

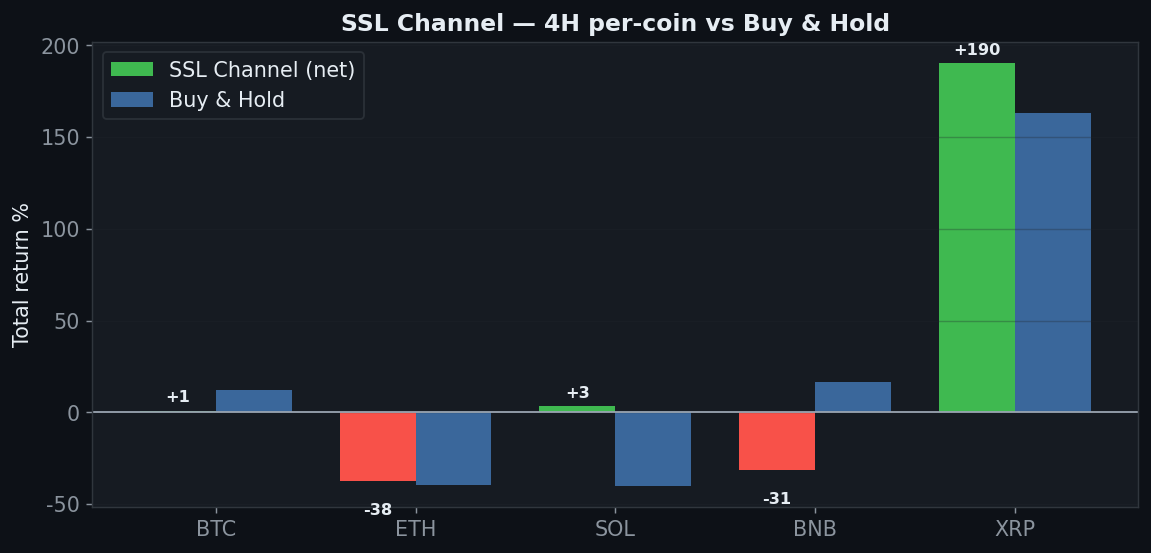
    Axis 4 — Five Coins

    Coin Strategy net Buy & Hold
    BTC +1% +12%
    ETH −38% −40%
    SOL +3% −40%
    BNB −31% +17%
    XRP +190% +163%

    3 of 5 positive, but driven almost entirely by XRP (+191%). BTC nets +1%, SOL +3%, while ETH and BNB lose. Strip out the one big trender and there’s nothing left.

    SSL Channel coins chart, StrategyVerdict 7-gate backtest

    Axis 5 — Yearly

    Year BTC 4H net
    2024 +47%
    2025 −48%
    2026 +32%

    2024 strong (+47%), 2025 −48%, 2026 +32%. Net positive over the sample but with a brutal chop year — the classic trend-follower profile, without enough edge to justify it after costs.

    Axis 6 — Friction

    SSL Channel friction chart, StrategyVerdict 7-gate backtest

    This is the whole story: +51% gross → +1% at the real 0.06% → −28% at 0.11%. The 336 trades convert a real edge into breakeven. SSL is a friction casualty.

    The Verdict: REJECT

    • Gate 0 — Indicator fidelitypass (standard SSL(10))
    • Gate 1 — Sanitypass
    • Gate 2 — Frictionfail — +51% gross collapses to +1% net; the edge is entirely eaten by churn
    • Gate 3 — Yearlyfail — +47 / −48 / +32, too dependent on the trending years
    • Gate 4 — Robustness (length)fail — only 10 and 14 positive
    • Gate 5 — Robustness (TP:SL)pass — 6 of 8 positive
    • Gate 6 — Multi-marketfail — 3 of 5, but driven by XRP alone
    • Gate 7 — vs Buy & Holdfail — 4H +1% loses to holding’s +12%

    SSL is the honest tragedy of the batch: a real +51% gross edge on BTC 4H, dragged to +1% net by 336 trades of churn — below buy & hold. Only the daily keeps any edge after fees, and the multi-coin result leans entirely on XRP. A signal with merit and a turnover problem it can’t out-earn. On real spot fees, reject.

    FAQ

    If the gross edge is real, isn’t it worth trading?
    Only if you can slash the turnover. As taught — flip on every band cross — the 336 trades convert +51% gross into +1% net. A confirmation filter or a higher timeframe (the daily kept +15%) is the only way it survives, and that’s a different, unproven system.

    Why does it beat on XRP but not BTC?
    XRP had one enormous clean trend the channel rode; BTC chopped more, so the crossings piled up. Profiting only where a giant trend happened to exist isn’t a repeatable edge.

    Can I replicate this?
    Yes — SSL(10) crossover, public Binance data, 0.06%/side, five coins, nine timeframes. Every table reproduces.

    See also the conditional passes Vortex and Ichimoku, and the rejects Keltner and Donchian.


    Disclaimer: educational research, not financial advice. Past performance does not guarantee future results. Never trade money you cannot afford to lose.
  • Hull Moving Average Strategy Backtest: Less Lag, More Whipsaw

    Hull Moving Average Strategy Backtest: Less Lag, More Whipsaw

    The Hull MA is sold as the moving average that ‘removes lag’ — it reacts to price almost instantly. The pitch is that a faster MA means earlier, better trades. We tested the standard HMA(25) slope-flip through the 7-Gate Protocol to see whether less lag actually helps. Verdict: reject.

    Methodology

    • Data: Binance spot, Jul 2024–Jul 2026 (2 years), BTC/ETH/SOL/BNB/XRP
    • Timeframes: 5m–1D (9 buckets, incl. resampled)
    • Execution: The Hull MA (HMA) is a weighted-MA construction that hugs price with minimal lag. Long when the HMA turns up, short when it turns down. Closed-bar, no look-ahead
    • Friction: 0.06%/side (real); 0-fee gross reported too. Benchmark: buy & hold
    • Six axes: timeframe, hma length, TP:SL, multi-coin, yearly, out-of-sample

    Gate 0 — Fidelity

    The Hull MA (HMA) is a weighted-MA construction that hugs price with minimal lag. Long when the HMA turns up, short when it turns down. Reproduced exactly (pass).

    Hull MA equity chart, StrategyVerdict 7-gate backtest

    How It Behaves

    Hull MA sig chart, StrategyVerdict 7-gate backtest

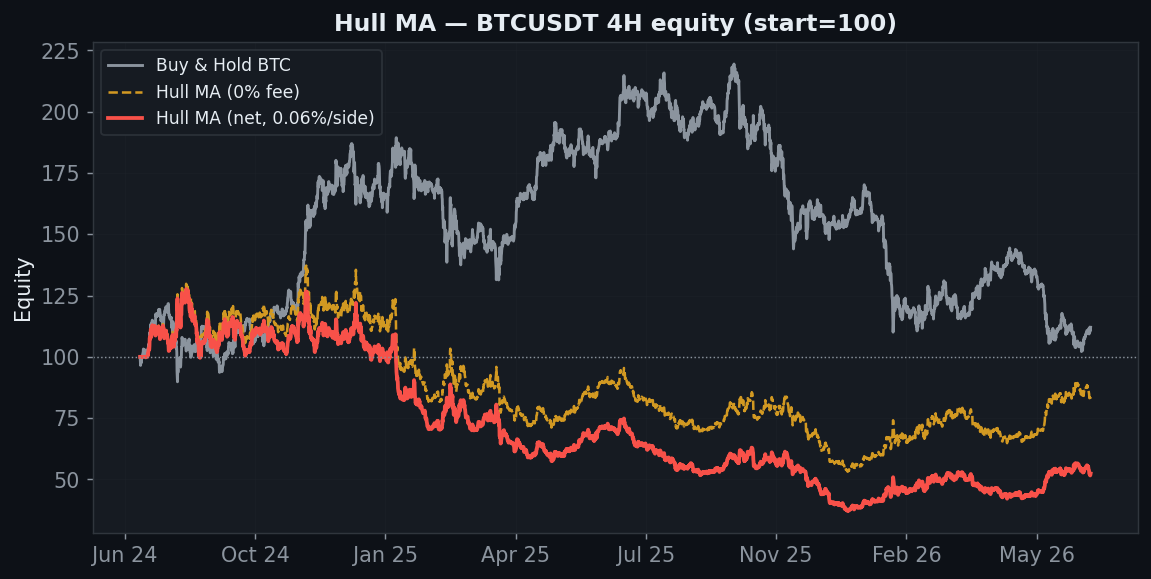
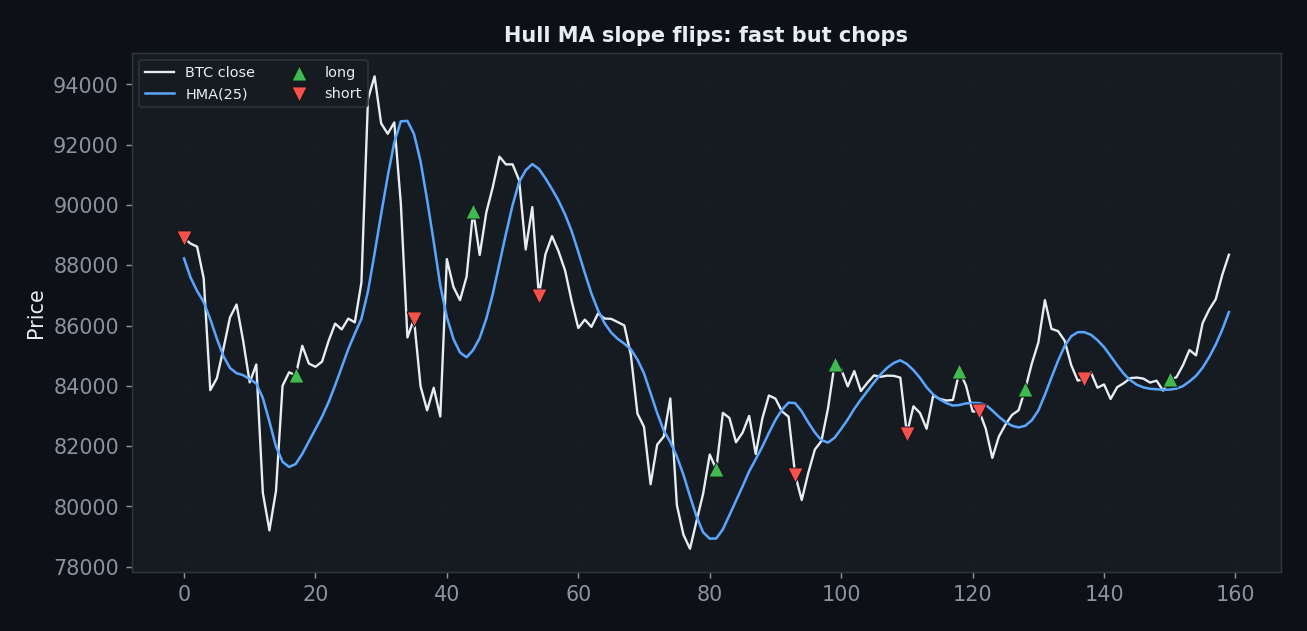
    Less lag cuts both ways. The HMA turns on every minor wiggle, so in anything but a strong trend it flips constantly — buying tops and selling bottoms of noise. The result is 388 trades on the 4H and a slow, steady bleed even before fees.

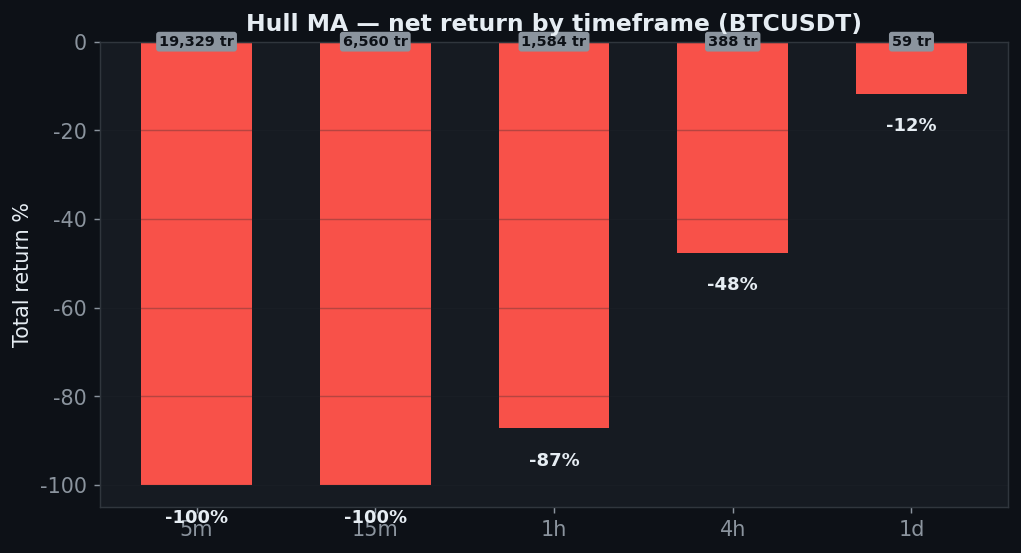
    Axis 1 — Timeframe

    Timeframe Trades Gross (0 fee) Net (real)
    5분 19,329 −36% −100%
    15분 6,560 −47% −100%
    30분 3,266 −56% −99%
    1시간 1,584 −14% −87%
    2시간 819 −12% −67%
    4시간 388 −16% −48%
    6시간 266 +20% −13%
    12시간 135 −30% −41%
    1일 59 −5% −12%

    Not a single timeframe is positive on BTC. The 4H loses 48% (and −17% even at zero fees), so this isn’t a fee problem — the raw signal loses. The lag-free MA is a whipsaw machine.

    Hull MA tf chart, StrategyVerdict 7-gate backtest

    Axis 2 — HMA length

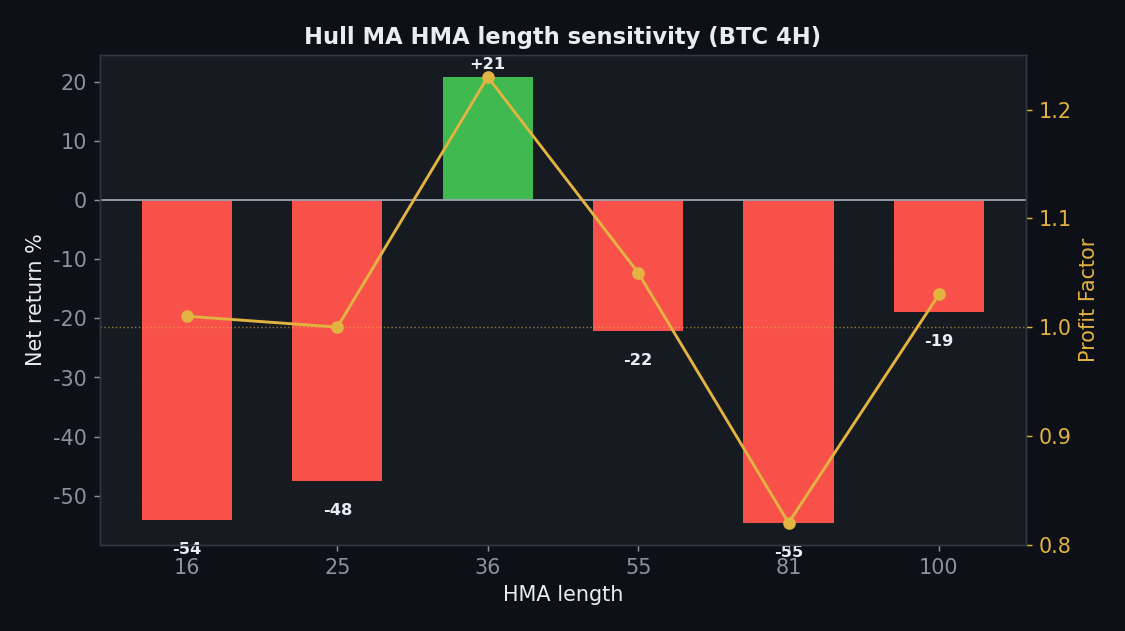
    HMA length Net PF
    16 −54% 1.01
    25 −48% 1.00
    36 +21% 1.23
    55 −22% 1.05
    81 −55% 0.82
    100 −19% 1.03

    Only one length (36) is positive out of six, and its neighbours (25, 55) both lose. That lone island is curve-fit noise, not a robust setting.

    Hull MA sens_param chart, StrategyVerdict 7-gate backtest

    Axis 3 — TP:SL

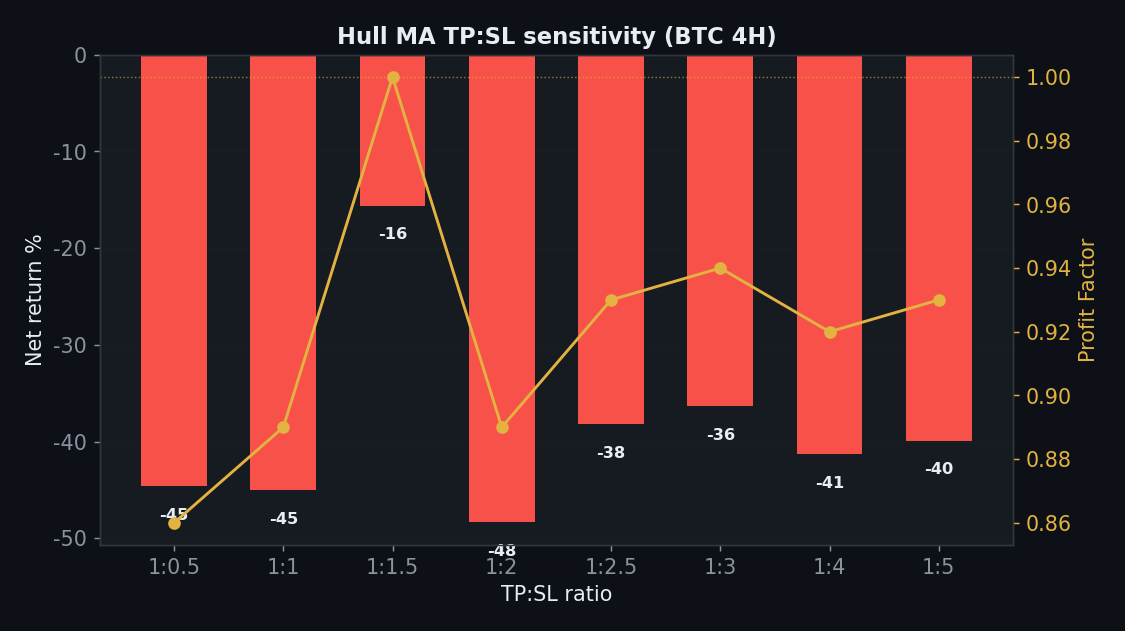
    TP:SL Net PF
    1:0.5 −45% 0.86
    1:1 −45% 0.89
    1:1.5 −16% 1.00
    1:2 −48% 0.89
    1:2.5 −38% 0.93
    1:3 −36% 0.94
    1:4 −41% 0.92
    1:5 −40% 0.93

    Damning: every one of the eight TP:SL ratios loses. There is no gross edge for any exit scheme to protect — the entries themselves are the problem.

    Hull MA sens_tpsl chart, StrategyVerdict 7-gate backtest

    Axis 4 — Five Coins

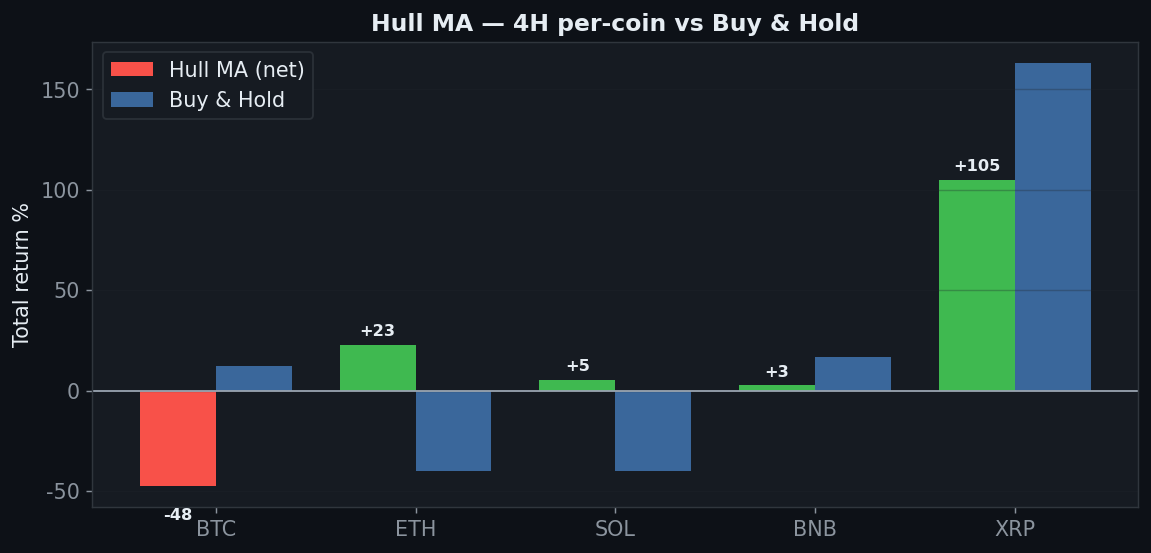
    Coin Strategy net Buy & Hold
    BTC −48% +12%
    ETH +23% −40%
    SOL +5% −40%
    BNB +3% +17%
    XRP +105% +163%

    A misleading 4 of 5 coins are ‘positive’, but BTC — the deepest, most liquid market — loses 48%, and the alt gains are small next to XRP’s missed +163% (HMA got +105%). The core market rejects it.

    Hull MA coins chart, StrategyVerdict 7-gate backtest

    Axis 5 — Yearly

    Year BTC 4H net
    2024 −1%
    2025 −62%
    2026 +39%

    2024 roughly flat (−1%), 2025 a disaster (−62%), 2026 a partial bounce (+39%). Wildly regime-dependent with a catastrophic drawdown year.

    Axis 6 — Friction

    Hull MA friction chart, StrategyVerdict 7-gate backtest

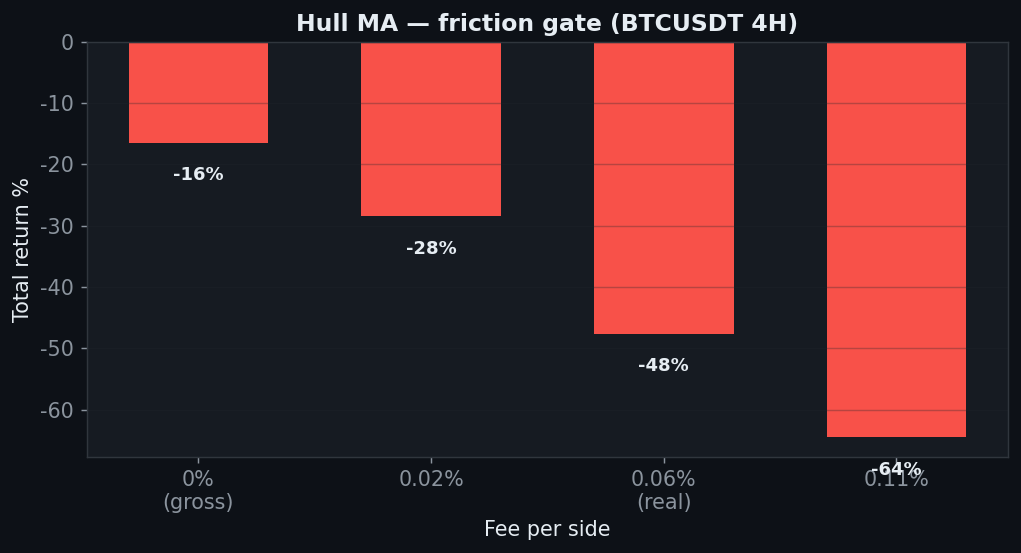
    Friction only twists the knife: −17% gross → −48% net → −65% at 0.11%. 388 trades of whipsaw guarantee costs pile up on top of a losing signal.

    The Verdict: REJECT

    • Gate 0 — Indicator fidelitypass (standard HMA(25))
    • Gate 1 — Sanitypass
    • Gate 2 — Frictionfail — −17% gross, −48% net on 4H
    • Gate 3 — Yearlyfail — −1 / −62 / +39
    • Gate 4 — Robustness (length)fail — only 1 of 6 lengths positive
    • Gate 5 — Robustness (TP:SL)fail — 0 of 8 positive
    • Gate 6 — Multi-marketfail — loses 48% on BTC, the core market
    • Gate 7 — vs Buy & Holdfail — negative on every timeframe

    The Hull MA delivers exactly what less lag buys you: more, earlier, worse trades. It loses on BTC at every timeframe — negative even before fees — every TP:SL ratio loses, and 2025 handed back 62%. Speed without confirmation is just whipsaw. As a standalone slope-flip, the lag-free MA is a reject.

    FAQ

    Isn’t the HMA better than a regular MA?
    It’s smoother and faster to the eye, yes. But ‘faster to react’ also means ‘faster to be fooled’ — in ranges it flips on noise. Our test shows the speed doesn’t translate into profit; if anything it worsens the whipsaw.

    What about using HMA as a trend filter, not an entry?
    As a higher-timeframe direction filter feeding a different entry it might help — that’s a separate system. The standalone slope-flip taught in most videos is what we measured, and it fails.

    Can I replicate this?
    Yes — HMA(25) slope-flip, public Binance data, 0.06%/side, five coins, nine timeframes. Every table reproduces.

    See also the rejects Keltner and Donchian, and the conditional passes Vortex and Ichimoku (daily).


    Disclaimer: educational research, not financial advice. Past performance does not guarantee future results. Never trade money you cannot afford to lose.
  • SuperTrend Strategy Backtest: the Famous Indicator Barely Beats Buy & Hold

    SuperTrend Strategy Backtest: the Famous Indicator Barely Beats Buy & Hold

    SuperTrend is the single most-marketed indicator on crypto YouTube — an ATR trailing stop that paints green in uptrends and red in downtrends, sold as a near-magic trend signal. Does the stop-flip actually make money? We ran the standard SuperTrend(10, 3) through the 7-Gate Protocol. Verdict: reject.

    Methodology

    • Data: Binance spot, Jul 2024–Jul 2026 (2 years), BTC/ETH/SOL/BNB/XRP
    • Timeframes: 5m–1D (9 buckets, incl. resampled)
    • Execution: A 10-period ATR trailing stop set a multiplier (default 3) from the mid-price. Close above the stop flips long; close below flips short. Closed-bar, no look-ahead
    • Friction: 0.06%/side (real); 0-fee gross reported too. Benchmark: buy & hold
    • Six axes: timeframe, atr multiplier, TP:SL, multi-coin, yearly, out-of-sample

    Gate 0 — Fidelity

    A 10-period ATR trailing stop set a multiplier (default 3) from the mid-price. Close above the stop flips long; close below flips short. Reproduced exactly (pass).

    SuperTrend equity chart, StrategyVerdict 7-gate backtest

    How It Behaves

    SuperTrend sig chart, StrategyVerdict 7-gate backtest

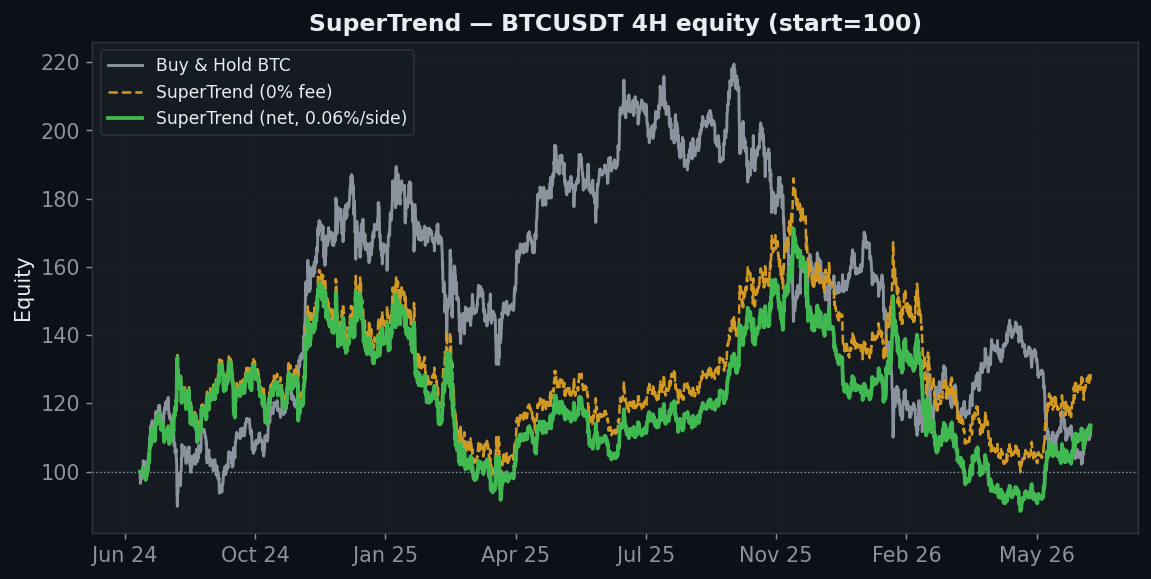
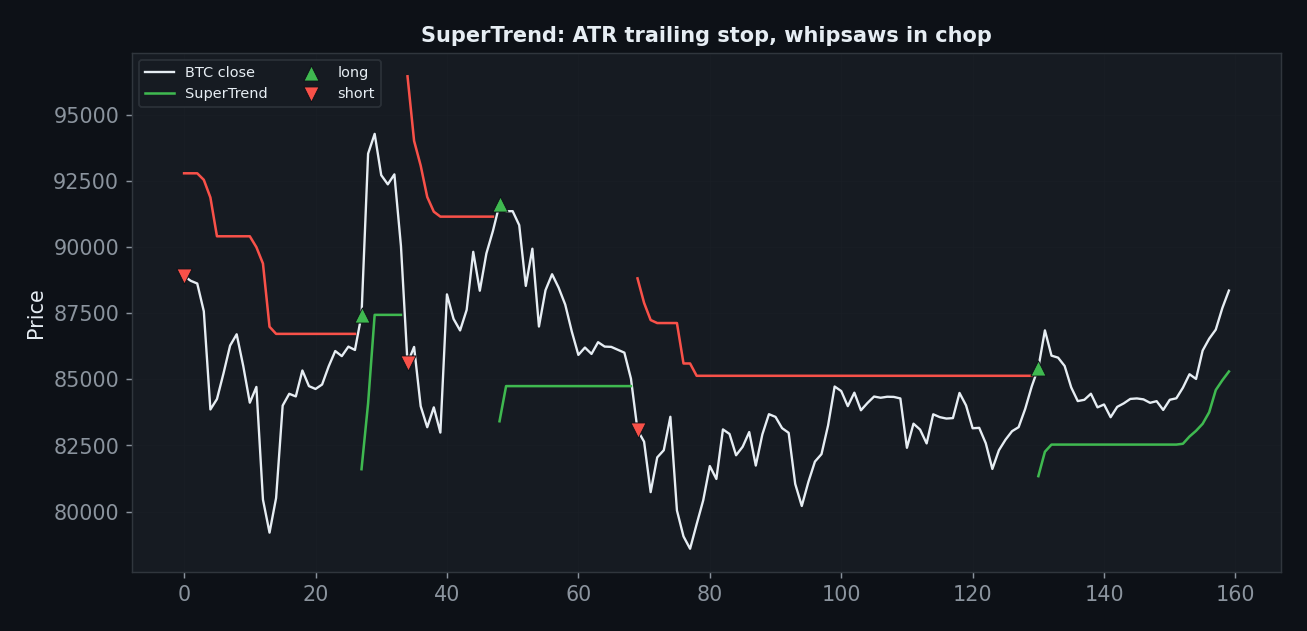
    SuperTrend is just an ATR trailing stop. In a clean trend it holds the position and looks brilliant; in a range it gets tagged repeatedly, flipping long and short around the same price. On the 4H it barely nets ahead of holding; on the daily it gets whipsawed for −52%.

    Axis 1 — Timeframe

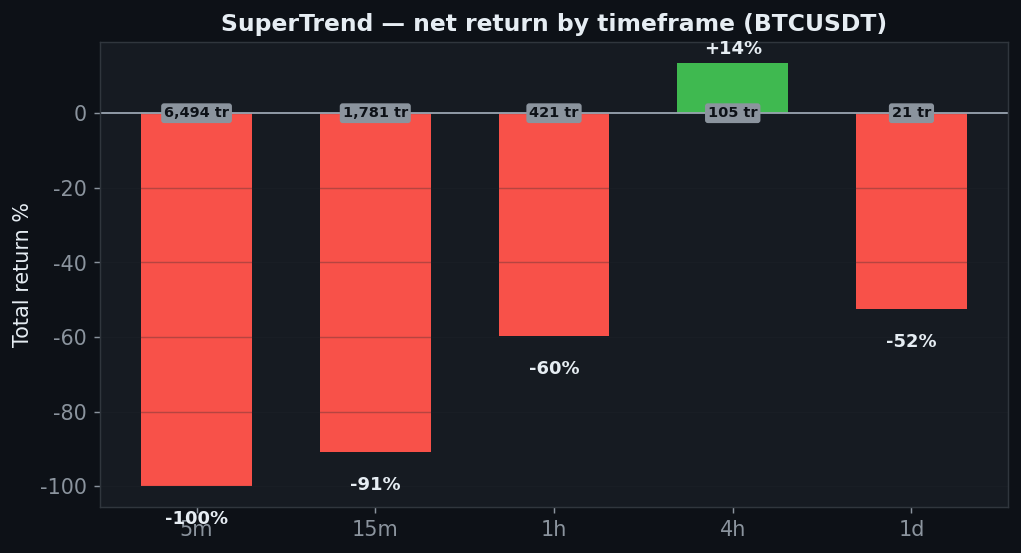
    Timeframe Trades Gross (0 fee) Net (real)
    5분 6,494 −60% −100%
    15분 1,781 −23% −91%
    30분 841 −15% −69%
    1시간 421 −33% −60%
    2시간 206 −19% −37%
    4시간 105 +29% +14%
    6시간 68 +11% +2%
    12시간 36 −18% −22%
    1일 21 −51% −52%

    Only the 4H is positive (+14%), and only by a hair over buy & hold. The daily — where a trend stop should shine — loses 52%. That inversion (worse on the higher timeframe) is a red flag that this is noise, not a trend edge.

    SuperTrend tf chart, StrategyVerdict 7-gate backtest

    Axis 2 — ATR multiplier

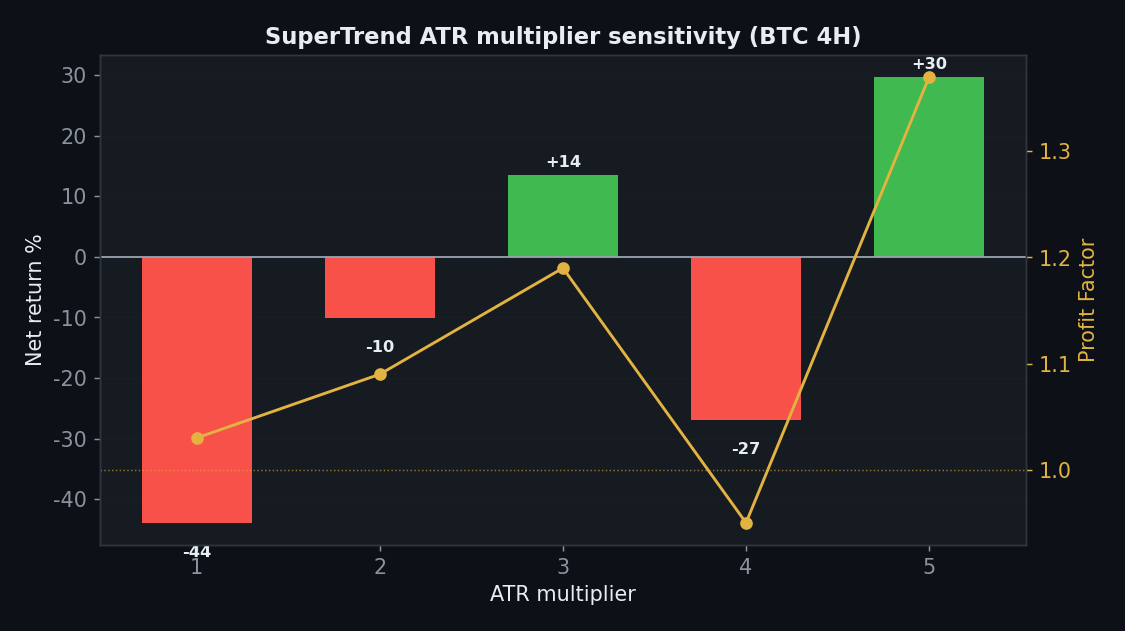
    ATR multiplier Net PF
    1x −44% 1.03
    2x −10% 1.09
    3x +14% 1.19
    4x −27% 0.95
    5x +30% 1.37

    The multiplier sweep is non-monotonic: 3 and 5 are positive but 1, 2 and 4 lose. A real edge shows a plateau; this zig-zag (a loss sitting between two wins) is the signature of curve-fit luck.

    SuperTrend sens_param chart, StrategyVerdict 7-gate backtest

    Axis 3 — TP:SL

    TP:SL Net PF
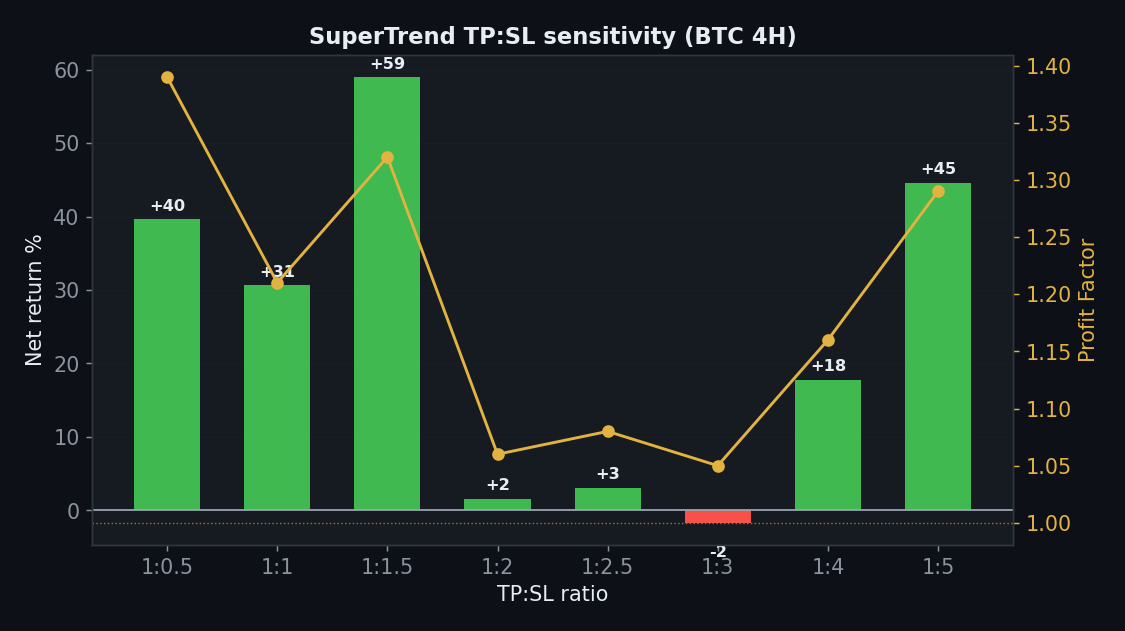
    1:0.5 +40% 1.39
    1:1 +31% 1.21
    1:1.5 +59% 1.32
    1:2 +2% 1.06
    1:2.5 +3% 1.08
    1:3 −2% 1.05
    1:4 +18% 1.16
    1:5 +45% 1.29

    The one bright spot: 7 of 8 take-profit ratios are positive. But bolting a good exit onto a base strategy that only ties buy & hold doesn’t create an edge — it just harvests mean-reversion the SuperTrend itself doesn’t capture.

    SuperTrend sens_tpsl chart, StrategyVerdict 7-gate backtest

    Axis 4 — Five Coins

    Coin Strategy net Buy & Hold
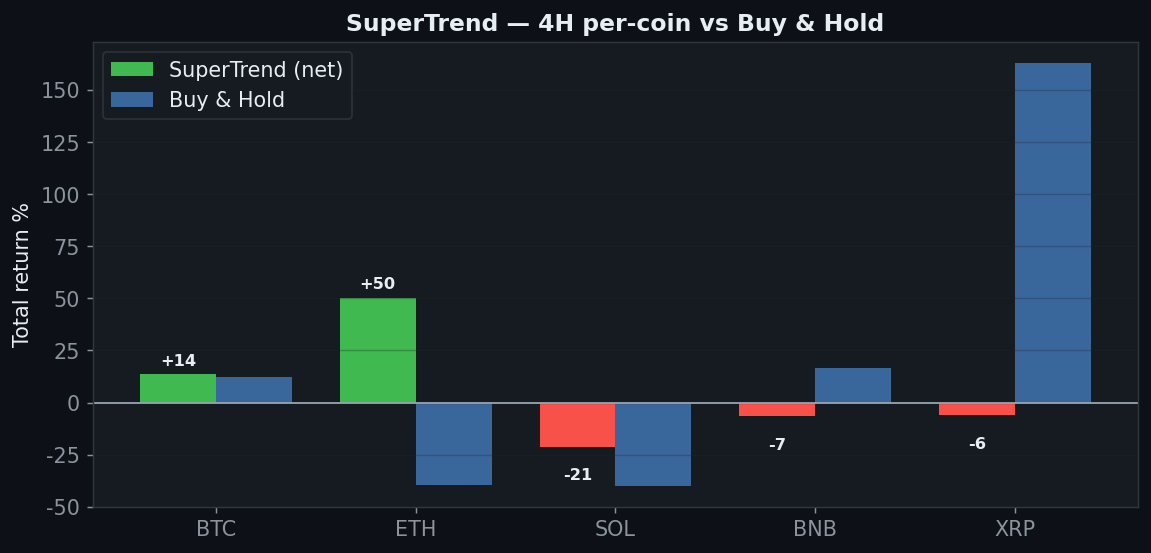
    BTC +14% +12%
    ETH +50% −40%
    SOL −21% −40%
    BNB −7% +17%
    XRP −6% +163%

    Two of five coins positive (BTC +14%, ETH +50%), but SOL, BNB and XRP all lose — and XRP, which tripled, was completely missed (−6% vs +163%).

    SuperTrend coins chart, StrategyVerdict 7-gate backtest

    Axis 5 — Yearly

    Year BTC 4H net
    2024 +37%
    2025 −8%
    2026 −10%

    2024 carried it (+37%); 2025 (−8%) and 2026 (−10%) both lost. The ‘edge’ is one good year fading into two losing ones.

    Axis 6 — Friction

    SuperTrend friction chart, StrategyVerdict 7-gate backtest

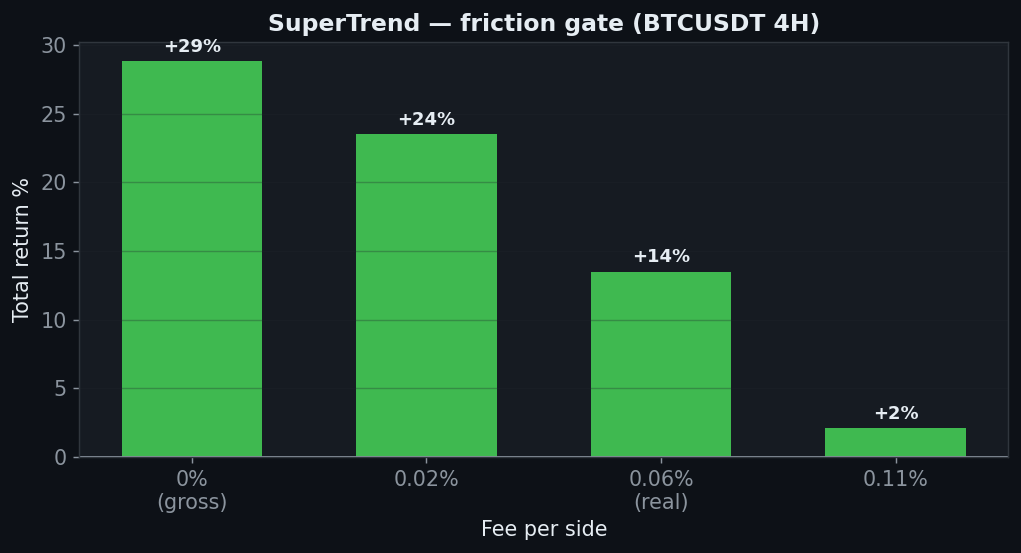
    Low turnover (105 trades) means friction is gentle: +29% gross → +14% net → +2% at 0.11%. Costs aren’t the problem here — the lack of a real edge is.

    The Verdict: REJECT

    • Gate 0 — Indicator fidelitypass (standard SuperTrend 10/3)
    • Gate 1 — Sanitypass
    • Gate 2 — Frictionpass on 4H (survives to +14% net) — but that edge is trivially thin
    • Gate 3 — Yearlyfail — +37 / −8 / −10, one good year then two losers
    • Gate 4 — Robustness (multiplier)fail — non-monotonic (3,5 win; 1,2,4 lose)
    • Gate 5 — Robustness (TP:SL)pass — 7 of 8 positive
    • Gate 6 — Multi-marketfail — 2 of 5 coins, missed XRP’s +163%
    • Gate 7 — vs Buy & Holdfail — 4H +14% vs +12% is a tie; 1D loses badly

    SuperTrend, the most-hyped indicator on crypto YouTube, ties buy & hold on the 4H (+14% vs +12%) and loses 52% on the daily. Its multiplier sweep zig-zags, it catches only 2 of 5 coins, and its one good year fades into two losing ones. The ATR trailing stop is a fine visual, but as a standalone long/short system it has no reliable edge. Reject.

    FAQ

    But it looks so accurate on the chart!
    In hindsight, on the trending sections. The red/green paint updates with price, so your eye sees only the parts where it was right. Measured forward across all regimes, the 4H merely ties holding and the daily loses.

    Isn’t SuperTrend better as a filter/trailing stop?
    Possibly — as an exit or a regime filter combined with another entry it may add value. That’s a different tool than the standalone flip we tested, and would need its own six-gate run.

    Can I replicate this?
    Yes — SuperTrend(10, 3), public Binance data, 0.06%/side, five coins, nine timeframes. Every table reproduces.

    See also the rejects Keltner, Donchian and Parabolic SAR, and the conditional Vortex.


    Disclaimer: educational research, not financial advice. Past performance does not guarantee future results. Never trade money you cannot afford to lose.
  • Vortex Indicator Strategy Backtest: the Crossover That Actually Has an Edge (Conditionally)

    Vortex Indicator Strategy Backtest: the Crossover That Actually Has an Edge (Conditionally)

    The Vortex Indicator (VI) is a trend tool built from two oscillating lines: VI+ measures upward movement and VI- measures downward movement, each normalized by true range. The strategy taught with it is a clean crossover: when VI+ crosses above VI-, go long; when VI- crosses above VI+, go short. Unlike most crossover indicators we’ve tested, this one has a real edge — but a narrow one. We ran the standard VI(14) crossover through the 7-Gate Protocol across six axes. Verdict: conditional.

    Methodology

    • Data: Binance spot, Jul 2024–Jul 2026 (2 years), BTC/ETH/SOL/BNB/XRP
    • Timeframes: 5m–1D (9 buckets, incl. resampled)
    • Execution: VI(14); position flips when VI+/VI- cross; closed-bar, no look-ahead
    • Friction: 0.06%/side (real); 0-fee gross reported too. Benchmark: buy & hold
    • Six axes: timeframe, period, TP:SL, multi-coin, yearly, out-of-sample

    Gate 0 — Fidelity

    Standard Vortex: VM+ = |High − prior Low|, VM- = |Low − prior High|, each summed over 14 bars and divided by the summed true range. Long when VI+ > VI-, short when VI- > VI+. Reproduced exactly (pass).

    The Exact Rules

    • Signal: VI+ crosses above VI- → long; VI- crosses above VI+ → short (stop-and-reverse)
    • Default: period 14
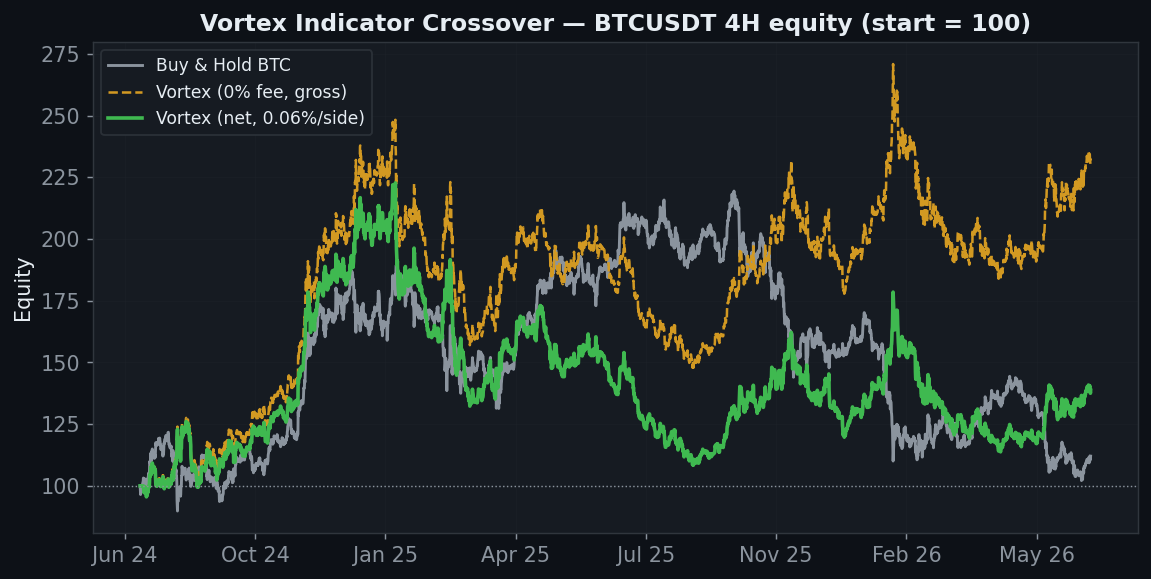
    Vortex crossover BTC 4H equity plus 39 net, gross plus 133, beats buy and hold plus 12

    Here’s what makes Vortex different from Keltner, Donchian, Aroon and the rest: on the BTC 4H, it ends at +39% net versus buy & hold’s +12%, and the 0-fee gross line reaches +133%. There is a genuine trend-following edge here — the crossover catches the big directional moves. The catch is where that edge lives.

    How It Works: Riding the Trend, Flipping in Chop

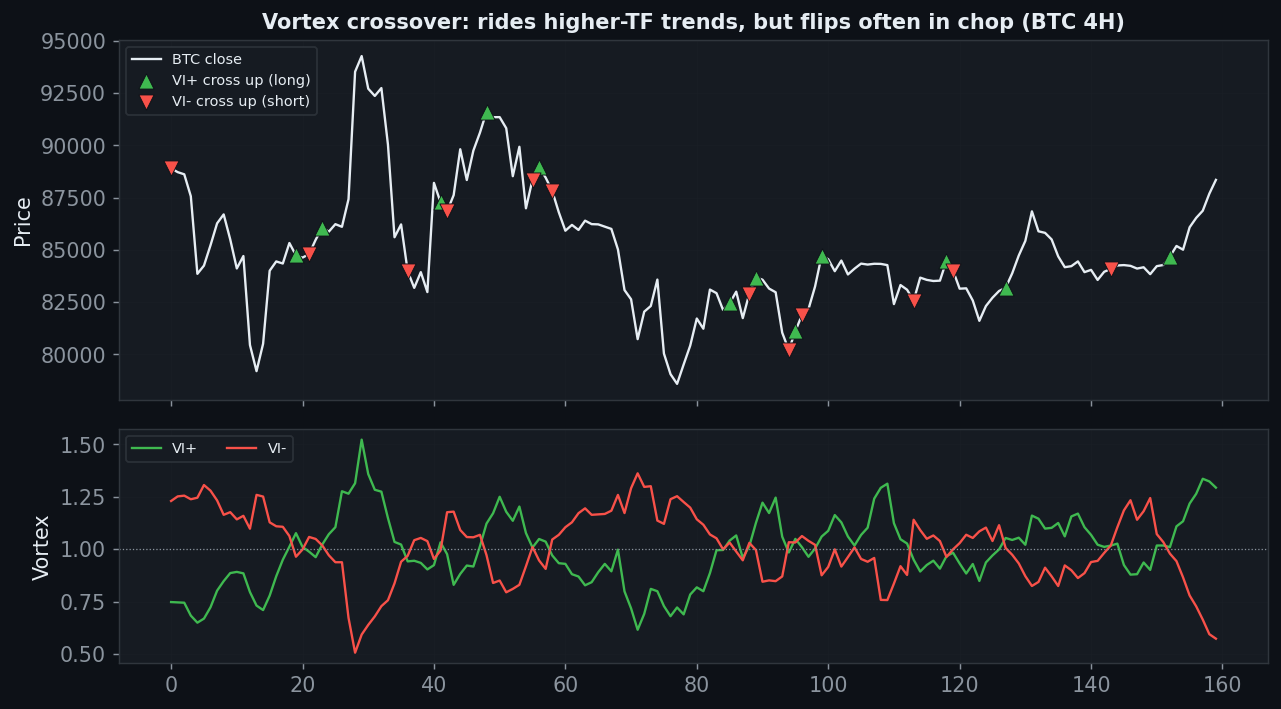
    Vortex VI plus and VI minus lines crossover on BTC 4H, rides trends flips in chop

    When BTC trends, VI+ and VI- separate cleanly and the position holds the move — that’s where the money is made. When price ranges, the two lines braid together and the strategy flips back and forth, bleeding fees. The whole verdict comes down to keeping the good regime and surviving the bad one.

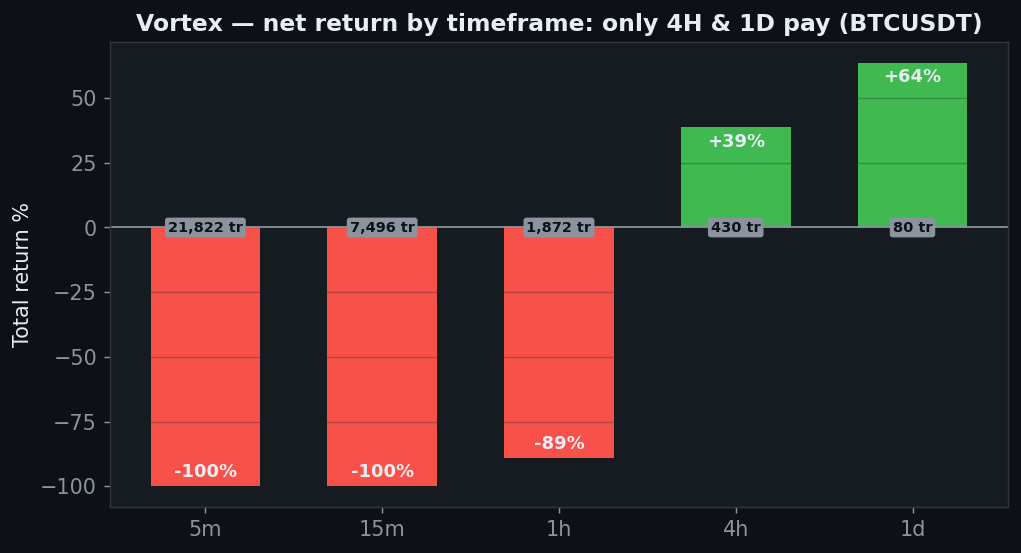
    Axis 1 — Timeframe (where the edge lives)

    Timeframe Trades Gross (0 fee) Net (real)
    5m 21,822 −27% −100%
    15m 7,496 −40% −100%
    30m 3,815 +81% −98%
    1h 1,872 +2% −89%
    2h 929 −42% −81%
    4h 430 +133% +39%
    6h 300 −11% −38%
    12h 134 +13% −4%
    1D 80 +80% +64%

    This is the crux. On 4H (+39%) and 1D (+64%) the strategy is genuinely profitable net of fees. But every timeframe below 4H is a disaster — the 5m loses everything (−100% across 21,822 trades). The edge is real but lives only on the higher timeframes, where trends persist and trade count (and fees) stay low.

    Vortex net return by timeframe, only 4H plus 39 and 1D plus 64 positive, lower timeframes minus 100

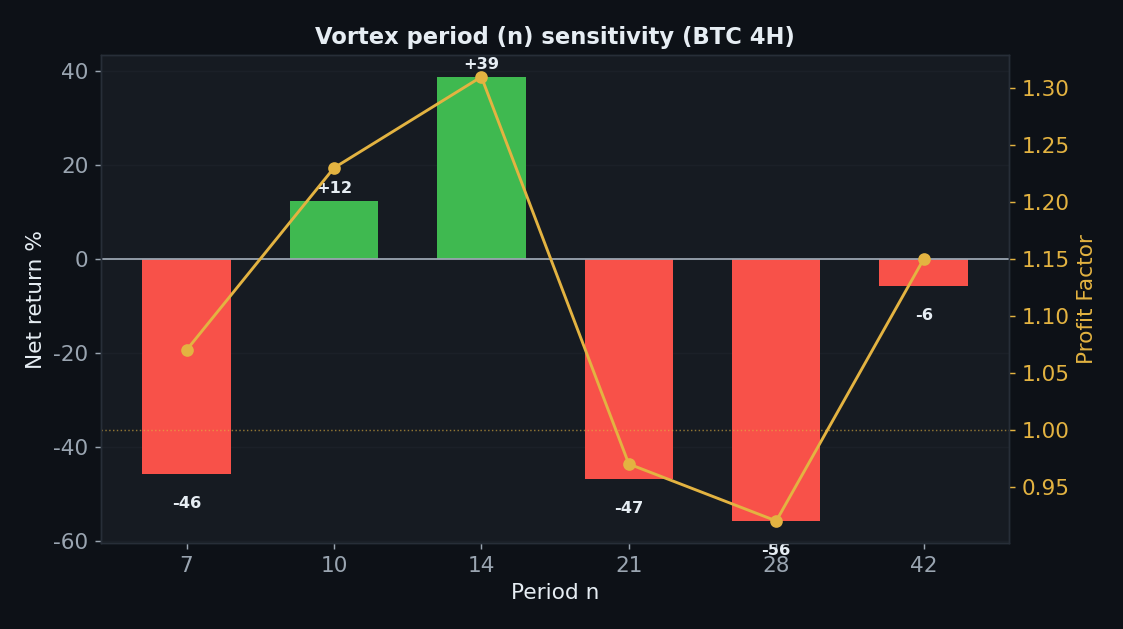
    Axis 2 — Period (the fragility)

    Period n Net PF
    7 −46% 1.07
    10 +12% 1.23
    14 (default) +39% 1.31
    21 −47% 0.97
    28 −56% 0.92
    42 −6% 1.15

    Here’s the weakness. The default 14 is the best (+39%), and 10 also works (+12%), so there’s a small plateau at the short end — but stretch the period to 21 or 28 and it collapses to −47% / −56%. The edge is sensitive to the period choice, which is a real robustness concern even though the popular default happens to sit in the good zone.

    Vortex period sensitivity, only 10 to 14 positive, 21 and 28 collapse

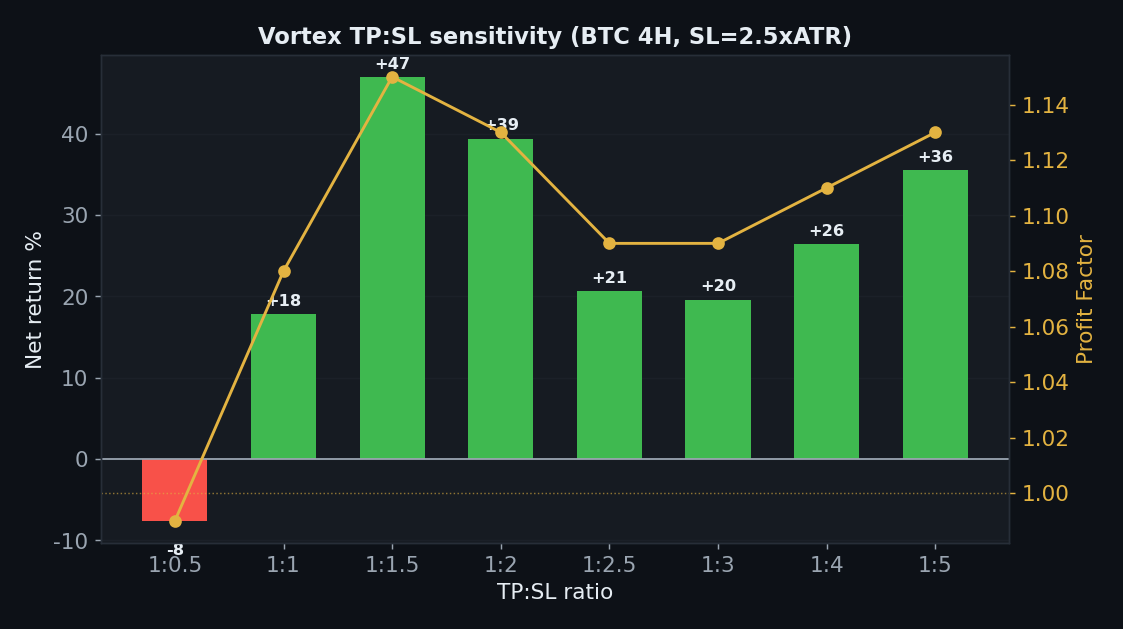
    Axis 3 — TP:SL (the strength)

    TP:SL Net PF
    1:0.5 −8% 0.99
    1:1 +18% 1.08
    1:1.5 +47% 1.15
    1:2 +39% 1.13
    1:2.5 +21% 1.09
    1:3 +20% 1.09
    1:4 +26% 1.11
    1:5 +36% 1.13

    This is where Vortex earns its conditional pass. Every take-profit ratio from 1:1 to 1:5 is positive (PF 1.08–1.15), peaking at 1:1.5 (+47%). A robust profit surface across exit settings is exactly what the rejects lacked — it says the edge isn’t an artifact of one lucky stop.

    Vortex TP:SL sensitivity every ratio 1:1 to 1:5 positive, robust

    Axis 4 — Five Coins

    Coin Vortex net Buy & Hold Note
    BTC +39% +12% beats hold
    ETH −18% −40% loses (still > hold)
    SOL −2% −40% ~flat
    BNB −34% +17% loses to hold
    XRP +393% +163% rode the big trend

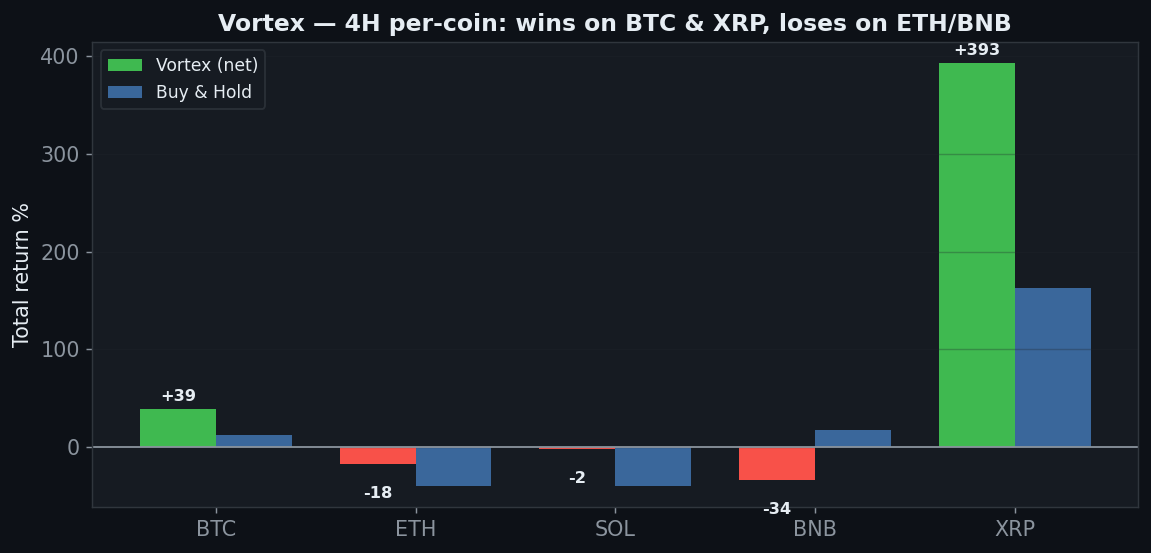
    Multi-market is where it stumbles. It beats hold on BTC (+39%) and XRP (+393%) — both strong trenders — and loses less than hold on ETH/SOL, but it’s outright negative on ETH and BNB. So call it 2 clear wins of 5. The edge is real but concentrated in the coins that actually trended.

    Vortex five coins 4H, BTC plus 39 and XRP plus 393 win, ETH and BNB lose

    Axis 5 — Yearly

    Year BTC 4H net
    2024 +102%
    2025 −39%
    2026 (to Jul) +13%

    2024 was huge (+102%), 2025 gave back −39% in the chop, and 2026 recovered (+13%). Unlike the rejects, the full sample stays clearly positive — but the −39% in 2025 shows the edge is regime-dependent, not all-weather.

    Axis 6 — Friction & the Churn Problem

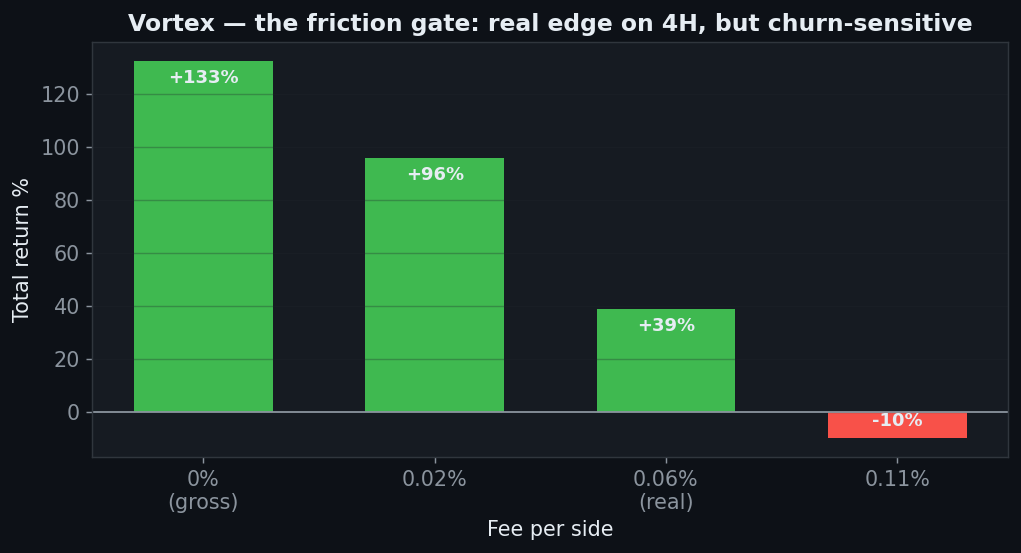
    Vortex friction gate gross plus 133 to plus 39 net at real fee, minus 10 at high fee

    Friction (BTC 4H): gross +133% → +96% at 0.02% → +39% at the real 0.06% → −10% at 0.11%. The edge survives realistic spot fees, but the 430 trades make it churn-sensitive — on a higher-fee venue it disappears. This is a low-fee, higher-timeframe strategy or nothing.

    The Verdict: CONDITIONAL

    • Gate 0 — Indicator fidelitypass (standard VI(14))
    • Gate 1 — Sanitypass (closed-bar crossover, no look-ahead)
    • Gate 2 — Frictionconditional — 4H gross +133% survives to +39% net, but every timeframe below 4H is destroyed and 0.11% fees kill it
    • Gate 3 — Yearly consistencyconditional — full sample clearly positive, but 2025 lost 39%
    • Gate 4 — Robustness (period)fail — only periods 10–14 work; 21+ collapse
    • Gate 5 — Robustness (TP:SL)pass — every ratio 1:1–1:5 positive
    • Gate 6 — Multi-marketfail — 2 of 5 coins clearly win (BTC, XRP)
    • Gate 7 — vs Buy & Holdpass — beats hold on 4H (+39% vs +12%), 1D (+64%), and XRP

    Vortex is the rare crossover with a real edge — but a fragile, conditional one. On the 4H and daily, in trending coins, at spot fees, with the period left near its default, it genuinely beats buy & hold and holds up across every take-profit setting. Take any of those props away — drop to a 5-minute chart, stretch the period to 21, trade it on ETH/BNB, or pay 0.11% — and the edge evaporates. It is not a set-and-forget, all-market system. As a higher-timeframe trend filter used with discipline, it passes; as the plug-and-play crossover it’s usually sold as, it doesn’t.

    FAQ

    So it actually works?
    On the 4H and daily, yes — net of realistic fees, on BTC and other trenders. That’s a genuine result and we’re not going to pretend otherwise. But “works on 4H/1D BTC at low fees with period 14” is a much narrower claim than “the Vortex crossover is profitable,” which is false on most timeframes and two of five coins.

    Why does it die on lower timeframes?
    Two reasons: intraday noise makes VI+/VI- braid constantly (whipsaw), and the trade count explodes (21,822 trades on 5m) so fees alone erase everything. Trend edges need persistence and low turnover; both live on the higher timeframes.

    Can I replicate this?
    Yes — VI(14) crossover, public Binance data, 0.06%/side, five coins, nine timeframes. Every table reproduces.

    See also the conditional passes Ichimoku (daily) and VWAP, and the rejects Keltner, Donchian, ADX/DMI.


    Disclaimer: educational research, not financial advice. Past performance does not guarantee future results. Never trade money you cannot afford to lose.
  • Keltner Channel Strategy Backtest: the Band Breakout That Only Pays on Clean Trends

    Keltner Channel Strategy Backtest: the Band Breakout That Only Pays on Clean Trends

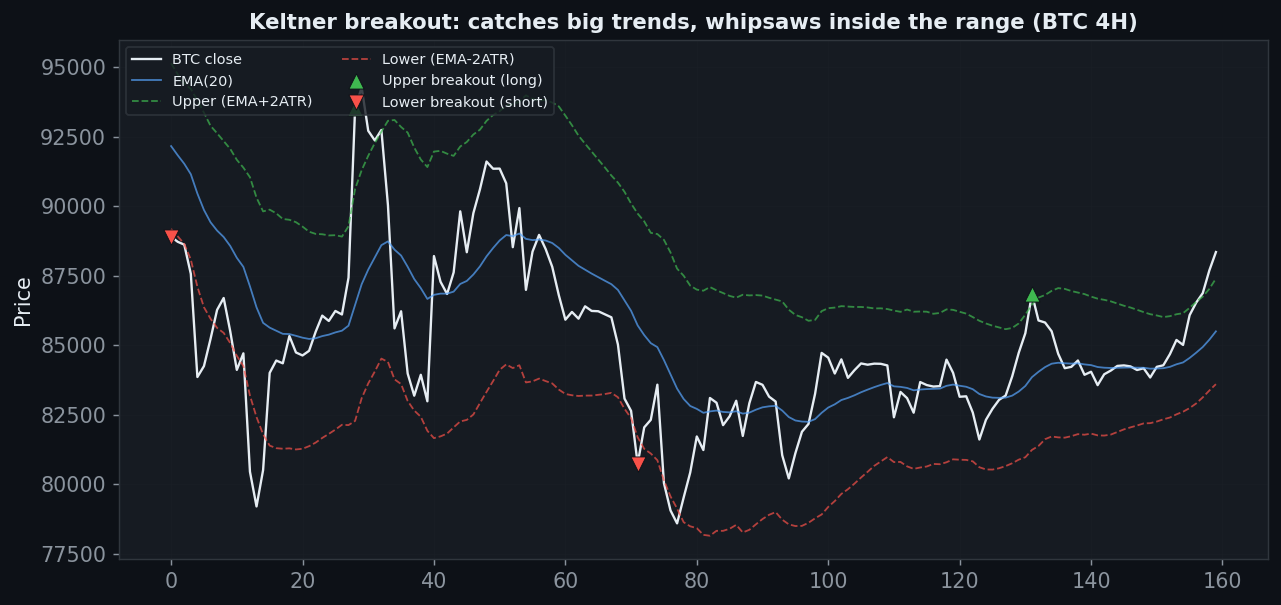
    The Keltner Channel wraps price in a volatility envelope: an EMA in the middle, with an upper and lower band set a multiple of the ATR away. The breakout rule taught with it is simple — close above the upper band, go long; close below the lower band, go short — on the logic that leaving the channel signals a real move. Bollinger’s cousin, essentially, but built on ATR. So does breaking the Keltner band make money on crypto? We ran the EMA(20) ± 2×ATR breakout through the 7-Gate Protocol across six axes. Verdict: reject.

    Methodology

    • Data: Binance spot, Jul 2024–Jul 2026 (2 years), BTC/ETH/SOL/BNB/XRP
    • Timeframes: 5m–1D (9 buckets, incl. resampled)
    • Execution: EMA(20), bands at ±2×ATR; close beyond a band flips the position; closed-bar, no look-ahead
    • Friction: 0.06%/side (real); 0-fee gross reported too. Benchmark: buy & hold
    • Six axes: timeframe, band multiplier, TP:SL, multi-coin, yearly, out-of-sample

    Gate 0 — Fidelity

    Standard Keltner: a 20-period EMA of close, with upper/lower bands at the EMA ± 2×ATR(20). Long on a close above the upper band, short on a close below the lower. Reproduced exactly (pass).

    The Exact Rules

    • Signal: close > upper band → long; close < lower band → short (stop-and-reverse, hold inside the channel)
    • Default: EMA 20, multiplier 2.0
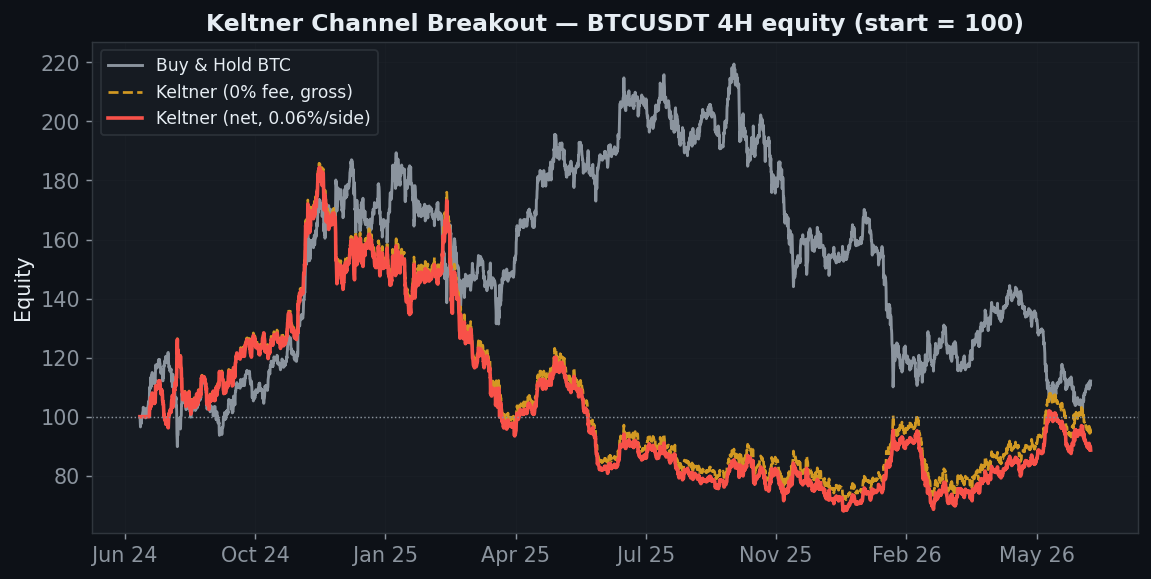
    Keltner channel breakout BTC 4H equity minus 11 net, gross minus 6, no edge, buy and hold plus 12

    BTC 4H ends at −11% against buy & hold’s +12%. The gross (0-fee) line is −6% — barely any edge before costs. As with every breakout on this site, the problem is what happens when the market isn’t trending.

    Why It Bleeds: Chop Inside the Band

    Keltner channel EMA and 2 ATR bands on BTC 4H, breakouts whipsaw inside the range, catch big trends

    The Keltner breakout has the same Achilles’ heel as Donchian: when price ranges, it repeatedly pokes just past a band, fires a trade, and slips back inside — a whipsaw. It only earns when a market makes a big, clean, sustained move that rides along a band. The 4H curve on BTC, which chopped as much as it trended, is the result: a slow bleed.

    Axis 1 — Timeframe (gross vs net)

    Timeframe Trades Gross (0 fee) Net (real)
    5m 3,005 −39% −98%
    15m 873 −51% −83%
    30m 454 −33% −60%
    1h 202 +25% −2%
    2h 110 −21% −31%
    4h 51 −6% −11%
    6h 36 −31% −34%
    12h 20 +79% +76%
    1D 6 −10% −11%

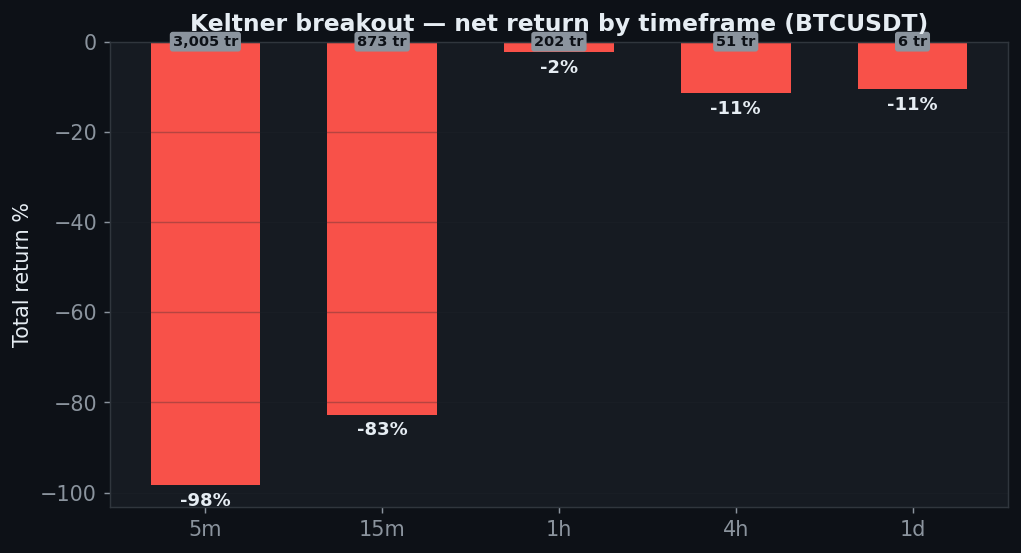
    The five main timeframes are net-negative. There’s a bright spot on the 12-hour (+76%), but it rests on just 20 trades — a small-sample curiosity, not a system. The 5-minute vaporises at −98%.

    Keltner net return by timeframe five main negative, 5 minute minus 98

    Axis 2 — Band Multiplier (parameter)

    ATR multiplier Net PF
    1.0 −6% 1.09
    1.5 +4% 1.15
    2.0 (default) −11% 1.12
    2.5 −15% 1.09
    3.0 −40% 0.81
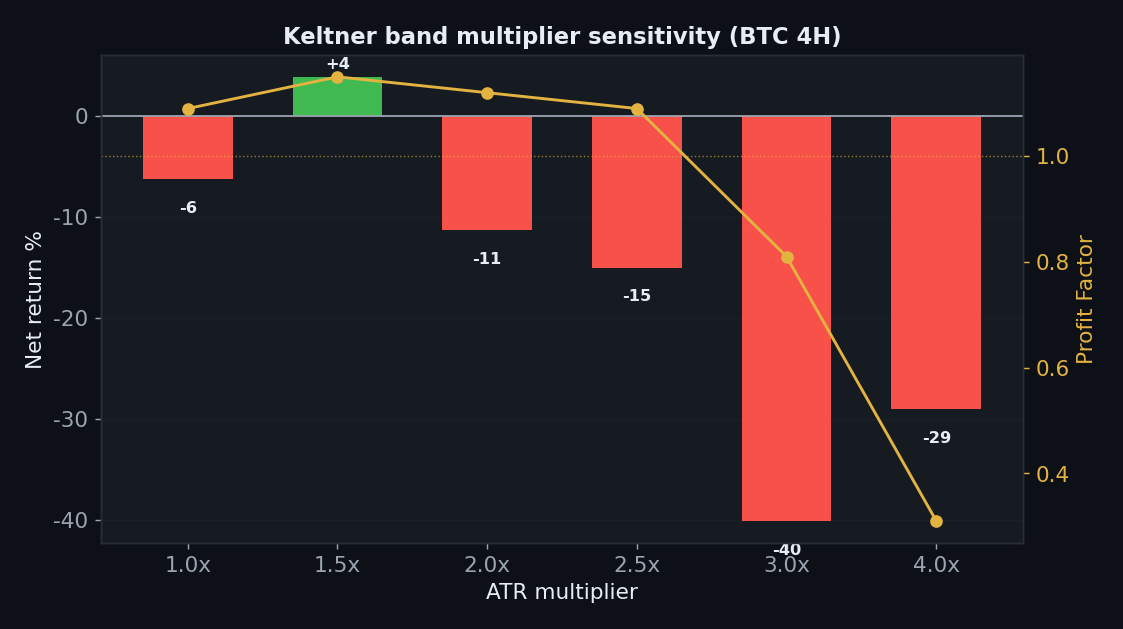
    4.0 −29% 0.31

    Only the 1.5× band scrapes a positive +4%; the default 2.0× loses, and wider bands (3×, 4×) lose badly. The edge, such as it is, lives at one narrow setting — not the plateau a robust strategy shows.

    Keltner band multiplier sensitivity, only 1.5x positive, default 2x and wider lose

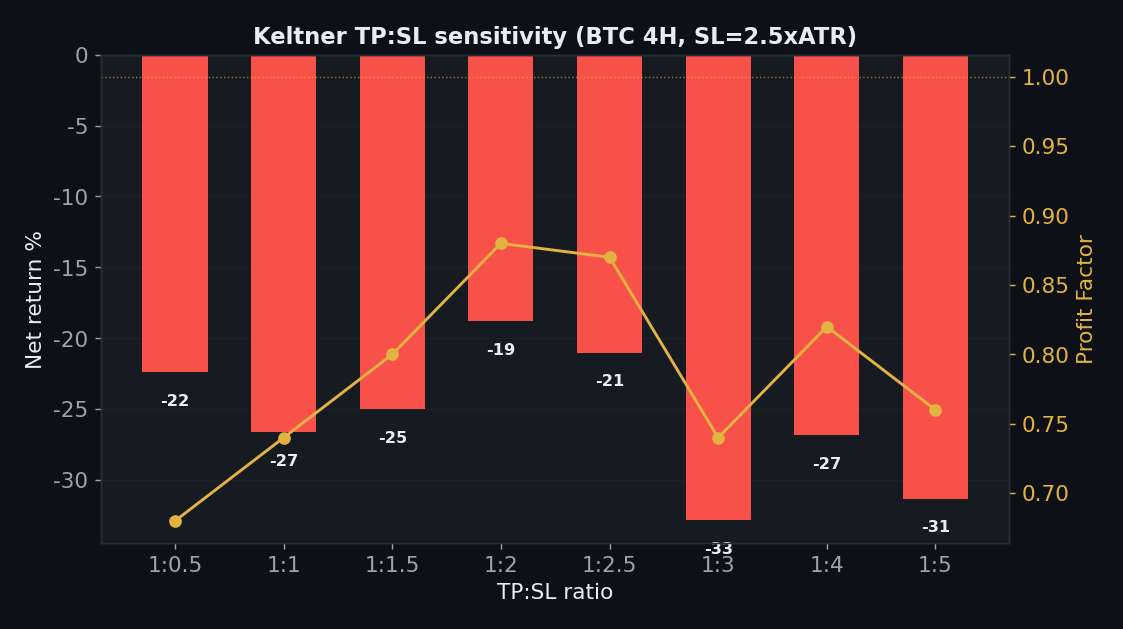
    Axis 3 — TP:SL

    TP:SL Net PF
    1:0.5 −22% 0.68
    1:1 −27% 0.74
    1:1.5 −25% 0.80
    1:2 −19% 0.88
    1:2.5 −21% 0.87
    1:3 −33% 0.74
    1:4 −27% 0.82
    1:5 −31% 0.76

    No take-profit setting rescues it — every ratio loses 19–33% with a profit factor below 0.9. There’s no gross edge for a stop/target scheme to protect.

    Keltner TP:SL sensitivity every ratio loses 19 to 33 percent

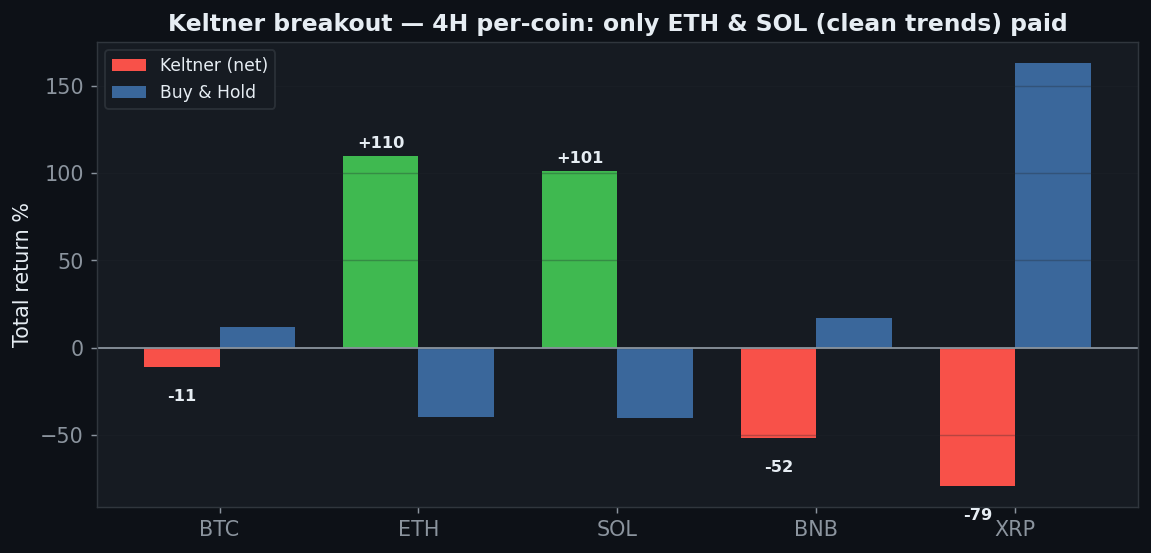
    Axis 4 — Five Coins

    Coin Keltner net Buy & Hold Note
    BTC −11% +12% chopped
    ETH +110% −40% shorted the downtrend
    SOL +101% −40% shorted the downtrend
    BNB −52% +17% chopped
    XRP −79% +163% whipsawed

    This row is revealing. Keltner made +110% on ETH and +101% on SOL — both coins that fell ~40% over the period. It profited by shorting their clean downtrends. But on the choppier BTC and BNB it lost, and on XRP — which trended up hard — it was whipsawed to −79%. So it isn’t “2 of 5 coins work”; it’s “breakouts pay only where a big clean trend exists,” which you can’t know in advance.

    Keltner five coins 4H, ETH plus 110 SOL plus 101 from shorting downtrends, BTC BNB XRP lose

    Axis 5 — Yearly

    Year BTC 4H net
    2024 +60%
    2025 −57%
    2026 (to Jul) +30%

    2024 (+60%) and 2026 (+30%) look strong, but 2025’s −57% wipes them out on the full sample. Extreme regime dependence — great in trending years, destroyed in the choppy one.

    Axis 6 — Friction & Out-of-Sample

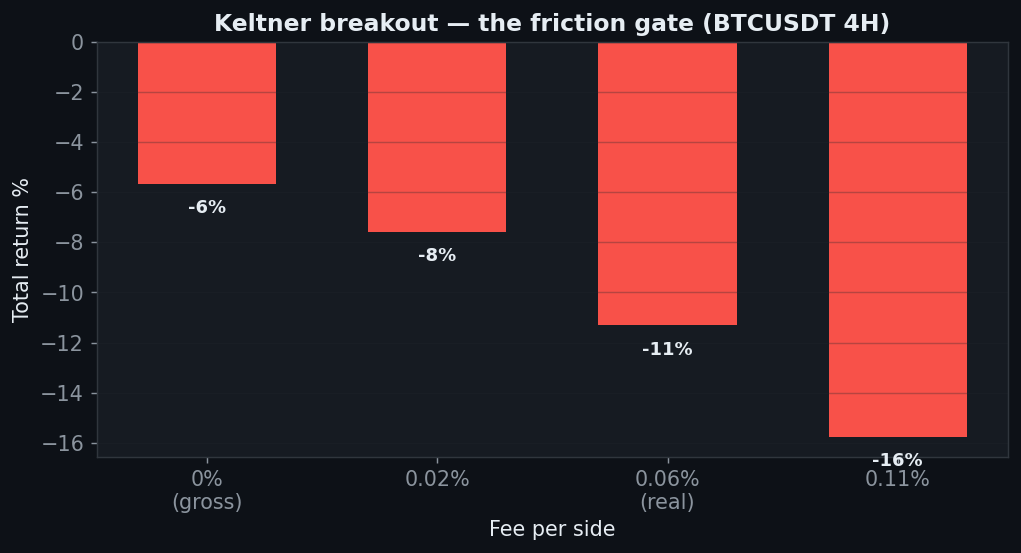
    Keltner friction gate minus 6 gross to minus 11 net BTC 4H

    Friction (BTC 4H): −6% gross → −11% net. Out-of-sample, 2 of 5 coins stay positive — the same clean-trend coins — while the majors don’t. There’s no edge that generalizes across markets and regimes.

    The Verdict: REJECT

    • Gate 0 — Indicator fidelitypass (EMA(20) ± 2×ATR Keltner Channel)
    • Gate 1 — Sanitypass (signal on the closed bar, no look-ahead)
    • Gate 2 — Frictionfail (−6% at zero fees on 4H, −11% net; 5m → −98%)
    • Gate 3 — Yearly consistencyfail (2024 +60 / 2025 −57 / 2026 +30 — 2025 wipes out the total)
    • Gate 4 — Out-of-samplefail (2 of 5 coins positive, the clean-trend ones)
    • Gate 5 — Robustnessfail (only the 1.5× band positive; every TP:SL loses)
    • Gate 6 — Multi-marketfail (2 of 5; profits only where a big clean trend existed, e.g. shorting ETH/SOL)
    • Gate 7 — vs Buy & Holdfail (0 of 5 timeframes beat holding)

    Keltner is another breakout with no trend to break into. Leaving the volatility band is only a good signal when a clean, sustained move follows — which is why it printed +110% shorting ETH’s downtrend and lost on choppy BTC. On the majors, price pokes past the band and slips back, over and over, for a slow bleed. Its edge lives at one band width and one kind of market, evaporates in 2025, and doesn’t beat holding on any timeframe. As the taught band-breakout rule, Keltner is a reject.

    FAQ

    Keltner is meant for pullbacks/mean-reversion, not breakouts.
    The band breakout is the most commonly taught Keltner trade, so that’s what we measured. A pullback (fade back to the EMA) is a different, opposite rule and would need its own six-gate test.

    It made +110% on ETH though.
    By shorting a coin that fell 40% — a single clean downtrend. It lost on BTC, BNB and XRP. Profiting only where a big clean trend happened to exist is trend-luck, and the yearly (−57% in 2025) and out-of-sample gates confirm it doesn’t generalize.

    Can I replicate this?
    Yes — Keltner EMA(20) ± 2×ATR breakout, public Binance data, 0.06%/side, five coins, nine timeframes. Every table reproduces.

    See also: Donchian / Turtle, Bollinger reversion, Triple SuperTrend, UT Bot, and the conditional passes VWAP and Ichimoku (daily).


    Disclaimer: educational research, not financial advice. Past performance does not guarantee future results. Never trade money you cannot afford to lose.
  • Aroon Strategy Backtest: the Backtest That Looked Like a Winner (and Why It Lied)

    Aroon Strategy Backtest: the Backtest That Looked Like a Winner (and Why It Lied)

    After a long run of clean failures, Aroon looks like the exception. Tushar Chande’s 1995 trend indicator — Aroon Up and Aroon Down, measuring how recently price made a new high or low — traded as a simple crossover (long when Up is above Down, short when Down is above Up) produces a genuinely tempting backtest: +18.5% on BTC 4H net of fees, +29% on the daily, beating buy & hold on 3 of 5 coins. It passes the friction gate that kills most strategies. So is this finally a winner? We ran it through all six axes. Verdict: reject — and it’s the most important case on the site, because it shows exactly how a good-looking backtest lies.

    Methodology

    • Data: Binance spot, Jul 2024–Jul 2026 (2 years), BTC/ETH/SOL/BNB/XRP
    • Timeframes: 5m–1D (9 buckets, incl. resampled)
    • Execution: Aroon(14) on the closed bar, no look-ahead; long when Aroon Up > Aroon Down, short when Down > Up
    • Friction: 0.06%/side (real); 0-fee gross reported too. Benchmark: buy & hold
    • Six axes: timeframe, period, TP:SL, multi-coin, yearly, out-of-sample

    Gate 0 — Fidelity

    Standard Aroon(14): Aroon Up = 100 × (periods since the 14-bar high subtracted from 14) / 14, and the mirror for Down. Long on the Up/Down crossover, short on the reverse. Reproduced exactly (pass).

    The Part That Looks Great

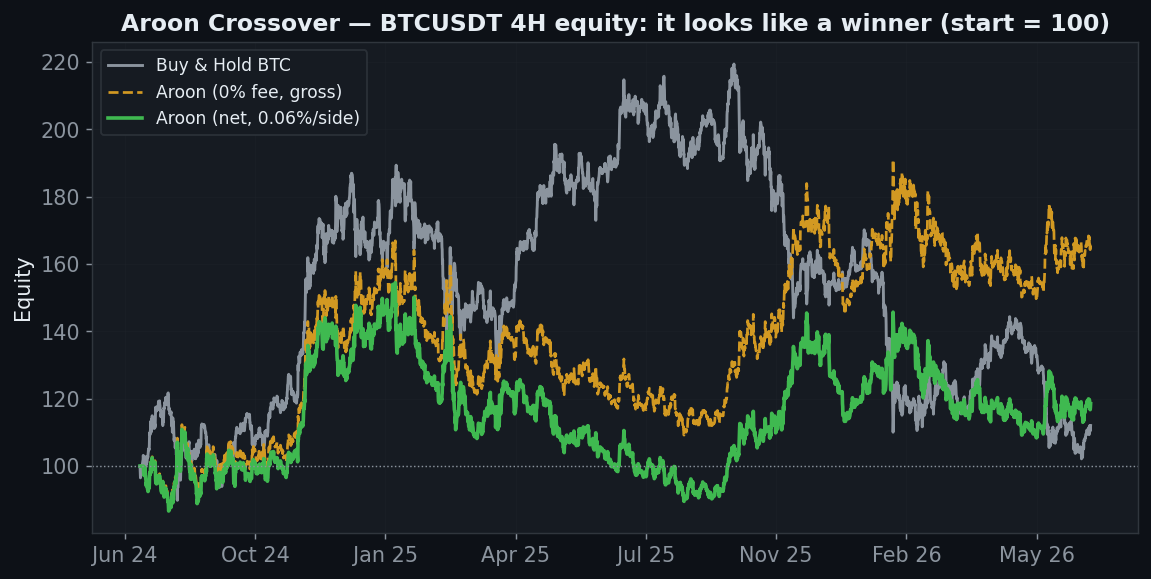
    Aroon crossover BTC 4H equity climbs, plus 18.5 net, looks like a winner, beats buy and hold

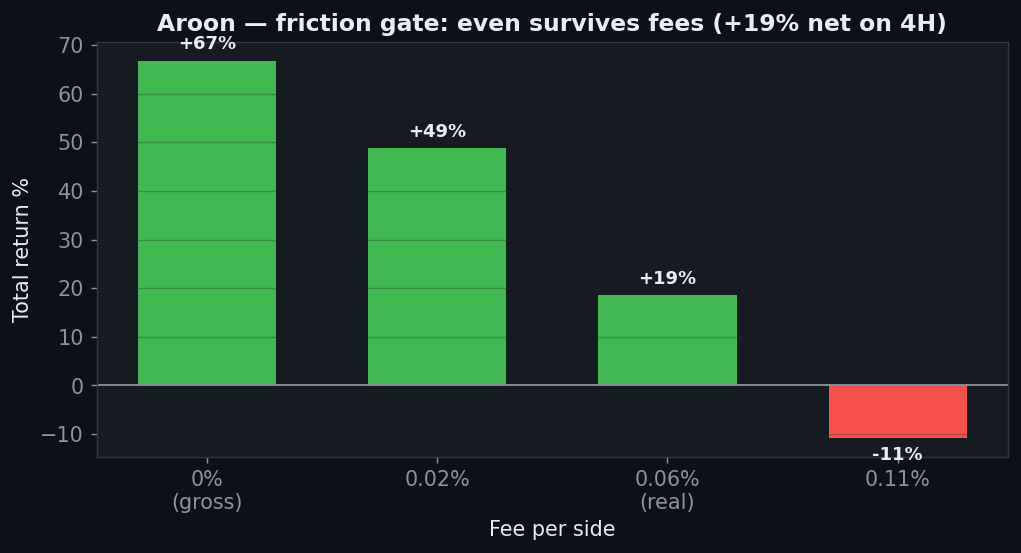
    Unlike almost everything else on this site, the BTC 4H equity curve climbs. Net of real fees it ends +18.5%, ahead of buy & hold’s +12%. And the friction gate — the graveyard of momentum strategies — is passed comfortably: +67% gross, +19% net. On the higher timeframes it looks like a real trend-following edge.

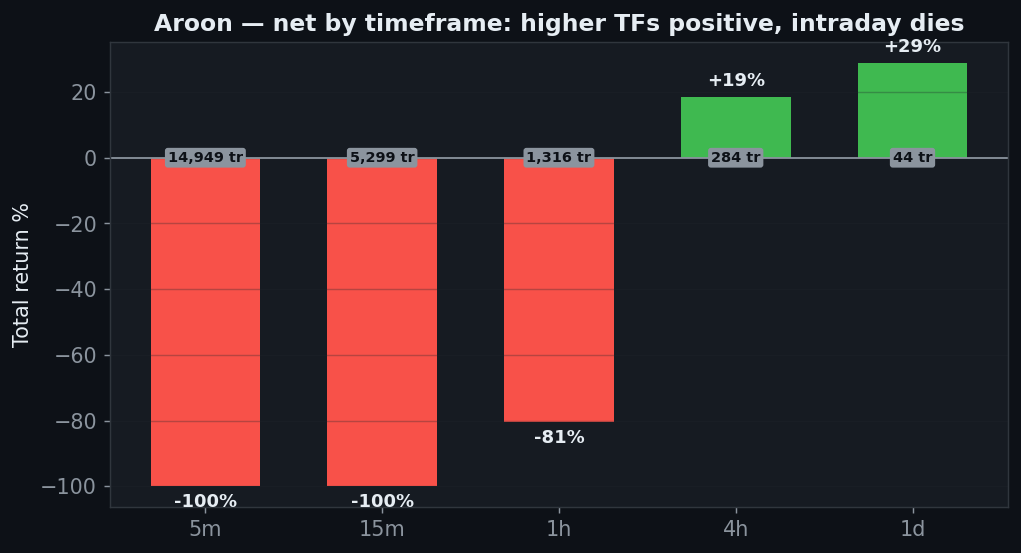
    Aroon net by timeframe, higher timeframes 4h 12h daily positive, intraday negative
    Timeframe Gross (0 fee) Net (real)
    5m −62% −100%
    15m −65% −100%
    30m −45% −98%
    1h −6% −81%
    2h −10% −57%
    4h +67% +19%
    6h −38% −51%
    12h +63% +45%
    1D +36% +29%

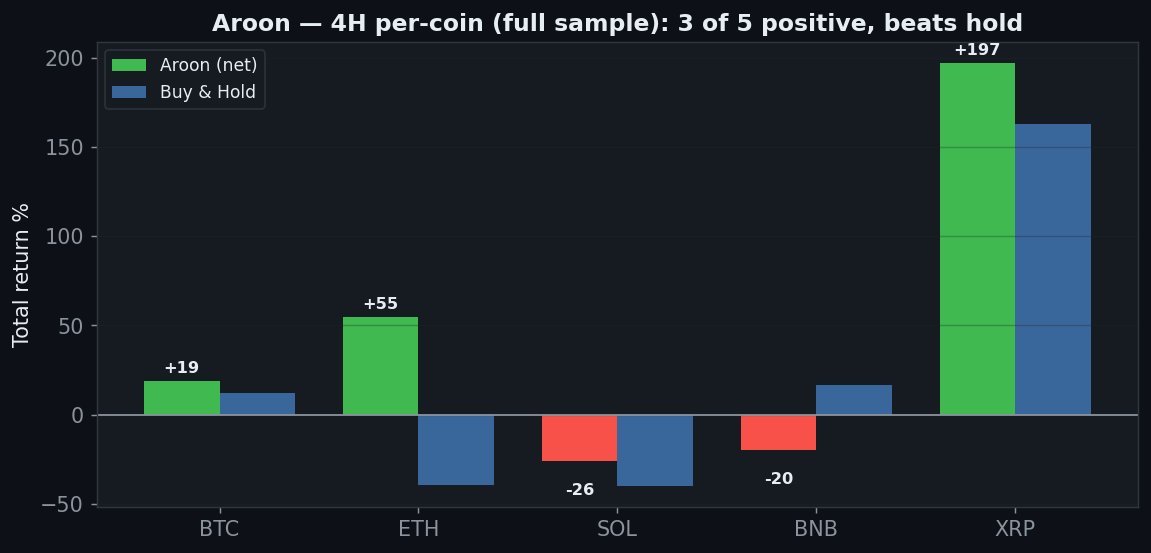
    The daily is +29%, the 12-hour +45%. On 4H, three of five coins are net-positive (BTC +18%, ETH +55%, XRP +197%). If we stopped here, we’d call it a conditional pass. But two gates exist precisely to stop us from stopping here.

    Aroon five coins 4H full sample 3 of 5 positive, BTC ETH XRP, beats buy and hold
    Aroon friction gate passes, plus 67 gross plus 19 net on BTC 4H

    Kill Shot #1 — The Edge Exists at Exactly One Setting

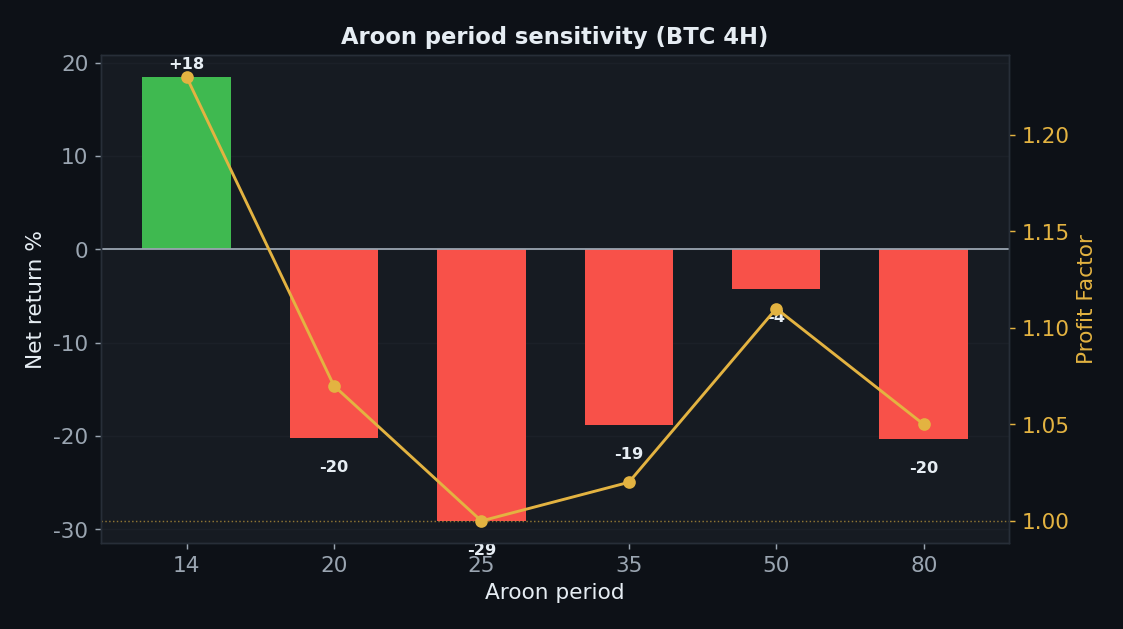
    Aroon period Net PF
    14 (default) +18.5% 1.23
    20 −20% 1.07
    25 −29% 1.00
    35 −19% 1.02
    50 −4% 1.11
    80 −20% 1.05

    Here is the first crack. That +18.5% is the Aroon period 14. Change it to 20, 25, 35, 50 or 80 and every single one loses. A real edge degrades gracefully as you nudge the parameter — you get a plateau of similar results. An over-fit edge is a lonely spike on one value with losses all around it, which is exactly what this is. The strategy didn’t find a market truth; it found the one number that happened to fit the last two years.

    Aroon period sensitivity, only period 14 positive plus 18, all other periods lose, overfit spike

    Kill Shot #2 — It Collapses Out-of-Sample

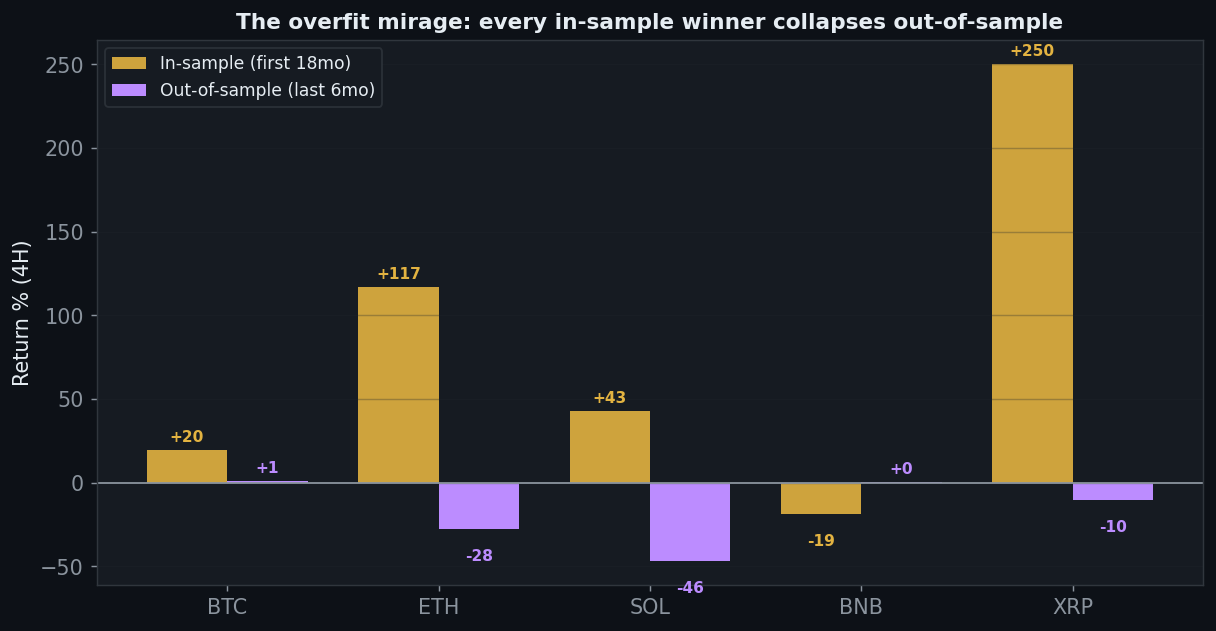
    Aroon overfit mirage, in-sample winners collapse out-of-sample, ETH plus 117 to minus 28, XRP plus 250 to minus 11

    The decisive test. Train on the first 18 months, then look at the last 6 months the strategy never “saw”:

    Coin In-sample (18mo) Out-of-sample (6mo)
    BTC +20% +1%
    ETH +117% −28%
    SOL +43% −47%
    BNB −19% +1%
    XRP +250% −11%

    Every in-sample winner collapses. ETH goes from +117% to −28%. SOL from +43% to −47%. XRP from +250% to −11%. Only BTC and BNB scrape a fraction of a percent positive out-of-sample. The gorgeous full-sample numbers were the strategy memorising 2024–25, not discovering anything that carries into the future. This is the single clearest picture of overfitting we’ve produced.

    The Other Axes

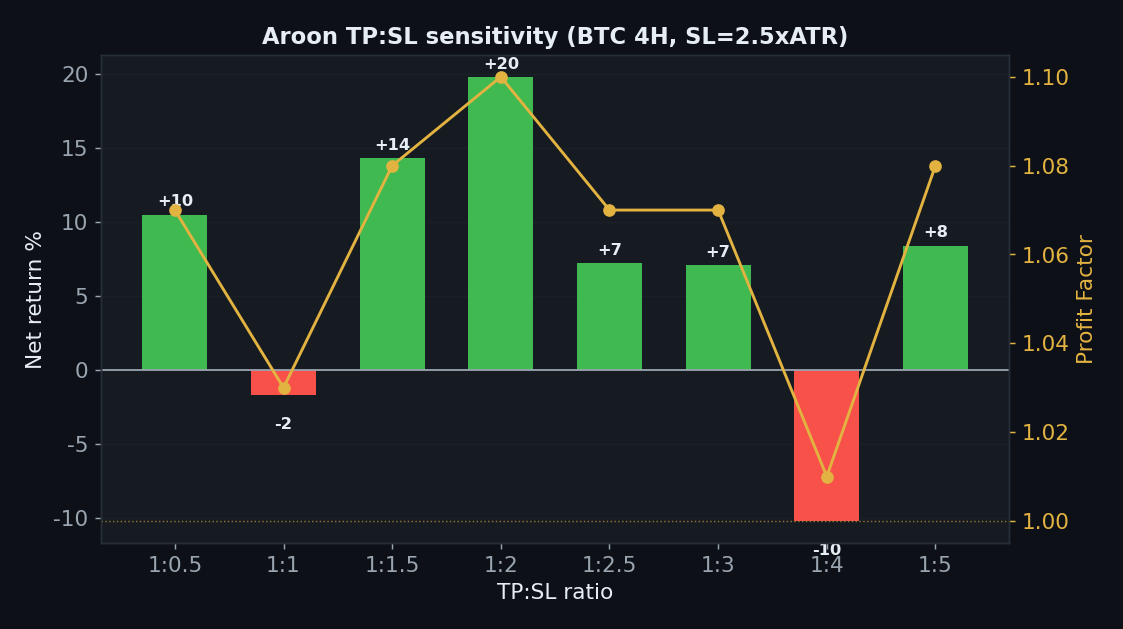
    TP:SL Net PF
    1:0.5 +11% 1.07
    1:1 −2% 1.03
    1:1.5 +14% 1.08
    1:2 +20% 1.10
    1:2.5 +7% 1.07
    1:3 +7% 1.07
    1:4 −10% 1.01
    1:5 +8% 1.08
    Aroon TP:SL sensitivity mostly mildly positive

    TP:SL variants are mostly mildly positive (a point in its favour), and the yearly split is 2 of 3 positive (2024 +35%, 2026 +3%, 2025 −15%). Those are the crumbs that make an over-fit strategy so seductive — it isn’t random, it genuinely rode 2024’s trends. But “rode the specific past” and “has an edge going forward” are different claims, and the out-of-sample gate is the referee.

    Year BTC 4H net
    2024 +35%
    2025 −15%
    2026 (to Jul) +3%

    The Verdict: REJECT

    • Gate 0 — Indicator fidelitypass (standard Aroon(14) crossover)
    • Gate 1 — Sanitypass (signal on the closed bar, no look-ahead)
    • Gate 2 — Frictionpass (+67% gross, +19% net on 4H — a rare pass)
    • Gate 3 — Yearly consistencypartial (2024 +35 / 2025 −15 / 2026 +3)
    • Gate 4 — Out-of-samplefail (in-sample winners collapse: ETH +117→−28, XRP +250→−11)
    • Gate 5 — Robustnessfail (profitable at period 14 only; every other period loses — curve-fit)
    • Gate 6 — Multi-marketpartial (full sample) / fail (out-of-sample) (3/5 in-sample, collapses out)
    • Gate 7 — vs Buy & Holdpartial (beats on 4H in-sample; not out-of-sample)

    Aroon is the backtest that lied — and the most useful one to study. It passes friction, beats buy & hold on three coins, and posts a +18.5% 4H curve, which is why it’s so easy to fall for. But its edge lives at exactly one parameter value (period 14) and evaporates the moment you test it on unseen data, where every in-sample winner turns negative. A strategy that only works at one setting and can’t repeat out-of-sample hasn’t found an edge; it has memorised the past. That’s the definition of over-fitting, and it’s why out-of-sample and parameter robustness — not the headline return — decide a verdict here.

    FAQ

    But it beat buy & hold — how is that a reject?
    On the full sample and at one parameter, yes. The reject is because that result doesn’t survive the two tests that estimate future performance: change the period and it loses; test on unseen data and it loses. Beating hold on data you fit to is not evidence of a forward edge.

    Couldn’t you just trade it on the daily/12H where it’s strongest?
    The out-of-sample collapse is measured on the same higher-timeframe logic; the in-sample daily/4H strength is exactly what fails to repeat. Cherry-picking the best in-sample window is how overfitting is done, not how it’s fixed.

    Can I replicate this?
    Yes — Aroon(14) crossover, public Binance data, 0.06%/side, five coins, nine timeframes, an 18/6-month out-of-sample split. Every table reproduces.

    See also: Williams %R, ADX / DMI, Donchian / Turtle, Triple SuperTrend, and the conditional passes VWAP and Ichimoku (daily).


    Disclaimer: educational research, not financial advice. Past performance does not guarantee future results. Never trade money you cannot afford to lose.
  • Heikin Ashi Strategy Backtest: the Smooth Candles That Whipsaw Underneath

    Heikin Ashi Strategy Backtest: the Smooth Candles That Whipsaw Underneath

    Open any “trade like a pro” video and you’ll meet Heikin Ashi — the modified candles that look magically smooth, painting long runs of clean green in an uptrend and clean red in a down. The pitch writes itself: the smoothing “filters out the noise” so you can hold the trend and ignore the chop. The simplest rule taught is the colour flip: go long when the Heikin Ashi candle turns green, short when it turns red. So do those beautiful smooth candles actually make money? We ran the colour flip through the 7-Gate Protocol across six axes. Verdict: reject — and the reason is hiding in plain sight, inside the very smoothness people love.

    Methodology

    • Data: Binance spot, Jul 2024–Jul 2026 (2 years), BTC/ETH/SOL/BNB/XRP
    • Timeframes: 5m–1D (9 buckets, incl. resampled)
    • Execution: Heikin Ashi from standard OHLC; colour read on the closed bar, no look-ahead
    • Friction: 0.06%/side (real); 0-fee gross reported too. Benchmark: buy & hold
    • Six axes: timeframe, smoothing, TP:SL, multi-coin, yearly, out-of-sample

    Gate 0 — Fidelity

    Standard Heikin Ashi: HA close = (O+H+L+C)/4; HA open = (prior HA open + prior HA close)/2; the candle is green when HA close ≥ HA open. Long on green, short on red. Reproduced exactly (pass).

    The Exact Rules

    • Signal: HA candle turns green → long; turns red → short (stop-and-reverse)
    • Default: raw Heikin Ashi, no extra smoothing
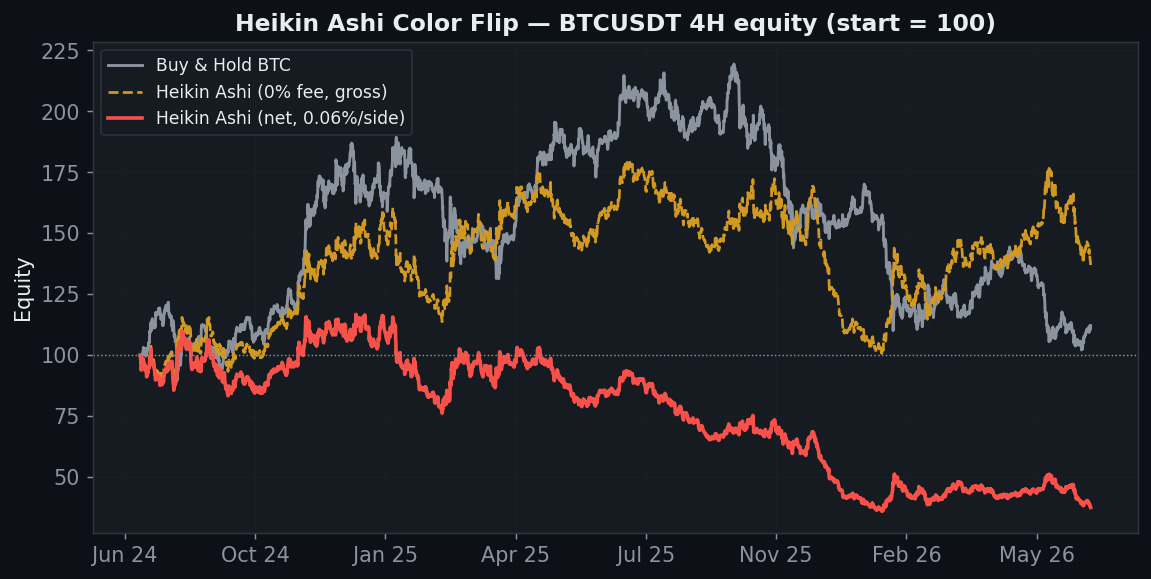
    Heikin Ashi BTC 4H equity minus 62 percent net but plus 37 gross, buy and hold plus 12, fees destroy the edge

    BTC 4H ends at −63% versus buy & hold’s +12%. But notice something unusual: the gross (0-fee) line finishes at +37%. Unlike most rejects on this site, Heikin Ashi does have a real gross edge — the smoothing genuinely captures some direction. So why does it lose 63% net? One word.

    Why It Bleeds: the Smooth-Candle Illusion

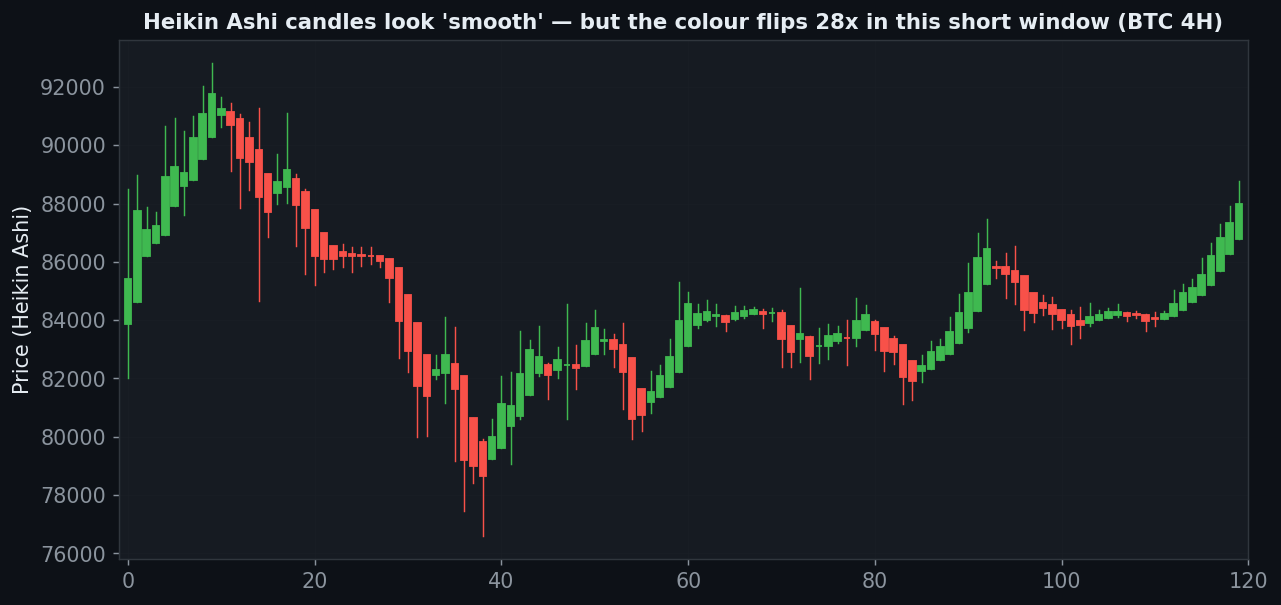
    Heikin Ashi candlesticks look smooth but colour flips 28 times in a short window, whipsaw illusion

    These are real Heikin Ashi candles. They look smooth — long clean runs of one colour — which is exactly what makes traders feel confident. But count the colour changes: in this short 120-bar window the candle flips colour 28 times. Zoom out and the raw colour-flip trades 1,079 times on 4H and 51,928 times on the 5-minute. The smoothing that makes the chart look calm is a visual sedative; underneath, the signal whipsaws relentlessly. A +37% gross edge spread across 1,079 round-trips cannot survive 0.06% a side.

    Axis 1 — Timeframe (gross vs net)

    Timeframe Trades Gross (0 fee) Net (real)
    5m 51,928 −89% −100%
    15m 17,484 −60% −100%
    30m 8,796 +5% −100%
    1h 4,454 −63% −100%
    2h 2,176 −30% −95%
    4h 1,079 +37% −63%
    6h 685 −5% −58%
    12h 330 +31% −12%
    1D 180 −7% −25%

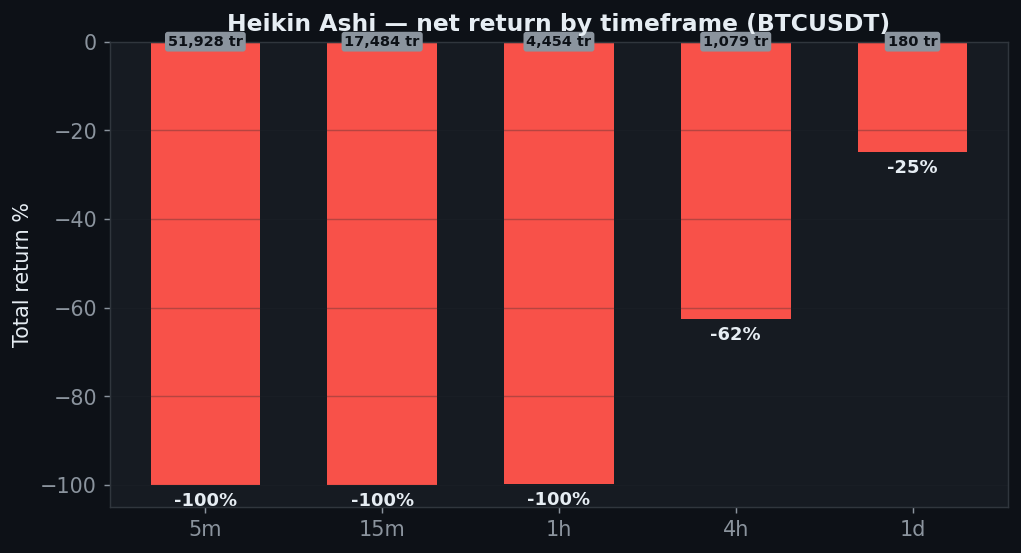
    Zero net-positive timeframes. Several buckets are gross-positive (4h +37%, 12h +31%, 30m +5%) — the edge is real — but the trade counts (51,928 on 5m) mean fees bury every one. The 12H is the least-bad at −12%; the daily is −25%.

    Heikin Ashi net return by timeframe all negative, minus 100 on fast timeframes, 51928 trades on 5 minute

    Axis 2 — Smoothing (the popular “fix”)

    Retail knows the raw flip is choppy, so the favourite variant is “Smoothed Heikin Ashi” — EMA the price before building the candles. Does more smoothing help? We swept the EMA length on BTC 4H.

    Smoothing (EMA) Trades Net PF
    1 (raw HA) 1,079 −63% 1.08
    2 853 −51% 1.09
    5 563 −52% 1.03
    10 388 −30% 1.08
    15 324 −24% 1.07
    20 278 +4% 1.18
    30 236 −13% 1.10

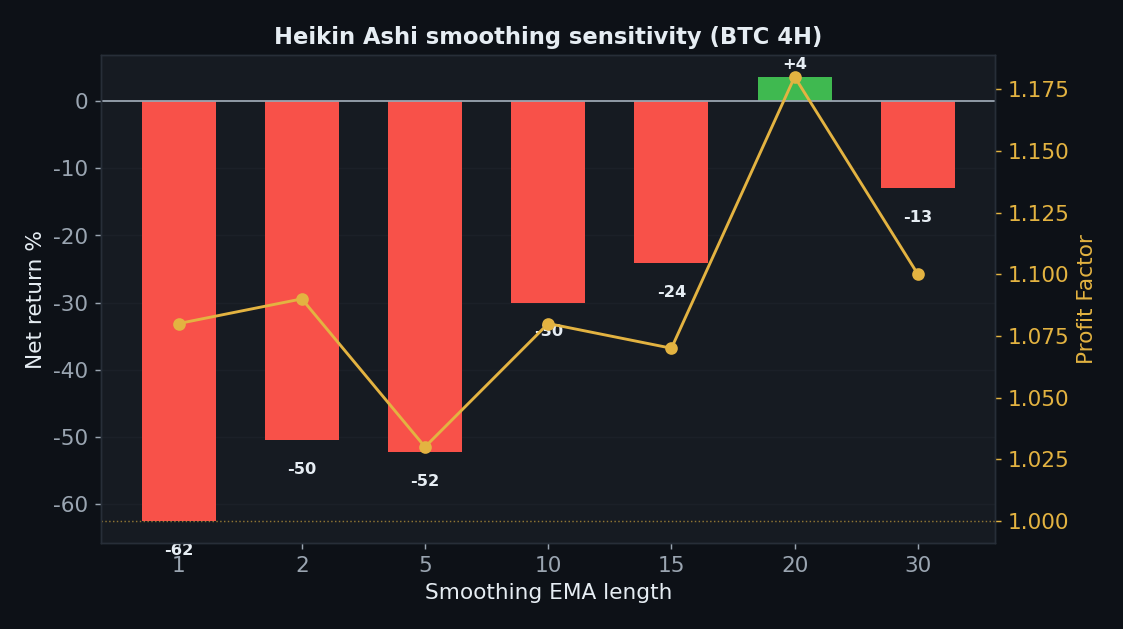
    Smoothing does exactly what you’d expect: it cuts the trade count (1,079 → 236) and steadily reduces the loss. At EMA-20 it finally scrapes +4% — but that’s it. The “fix” turns a 63% loss into a rounding error, not a strategy, and even that razor-thin result is one coin, one timeframe, and (as the yearly table shows) would have been destroyed in 2025. The raw colour flip that most people actually trade loses badly at every setting.

    Heikin Ashi smoothing sensitivity, raw loses 63, EMA 20 smoothing scrapes plus 4 percent marginal

    Axis 3 — TP:SL

    TP:SL Net PF
    1:0.5 −76% 0.80
    1:1 −65% 0.88
    1:1.5 −64% 0.89
    1:2 −61% 0.90
    1:2.5 −64% 0.89
    1:3 −63% 0.89
    1:4 −62% 0.90
    1:5 −65% 0.89

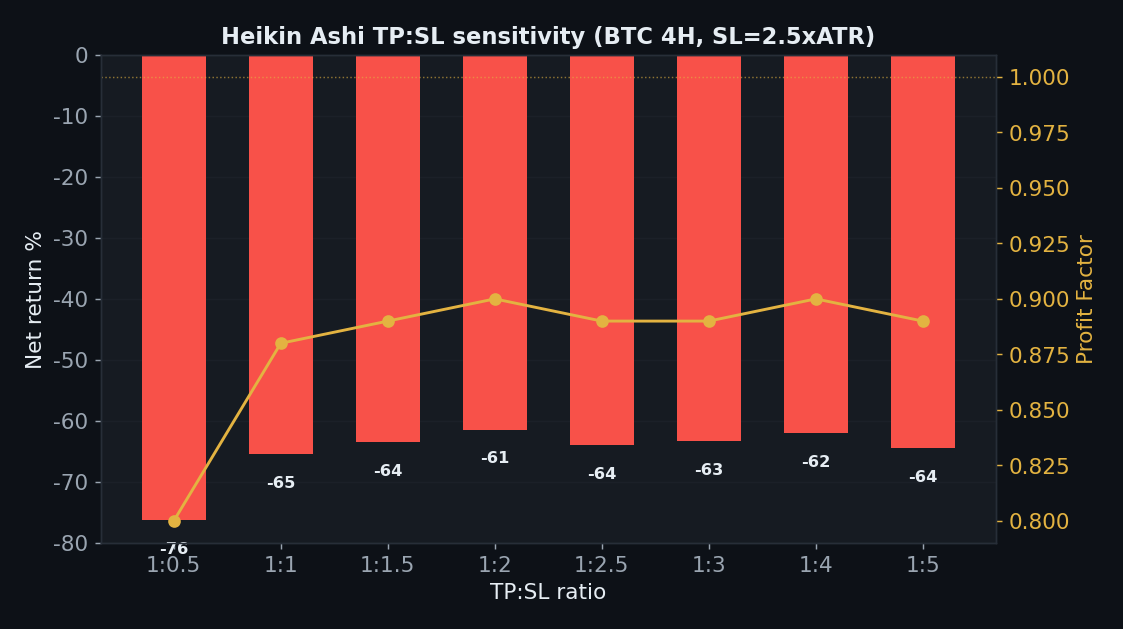
    No take-profit setting rescues it — every ratio from 1:0.5 to 1:5 loses 61–76%. A 34% win rate that flips a thousand times can’t be saved by where you place the target.

    Heikin Ashi TP:SL sensitivity all negative 61 to 76 percent, no take-profit rescues it

    Axis 4 — Five Coins

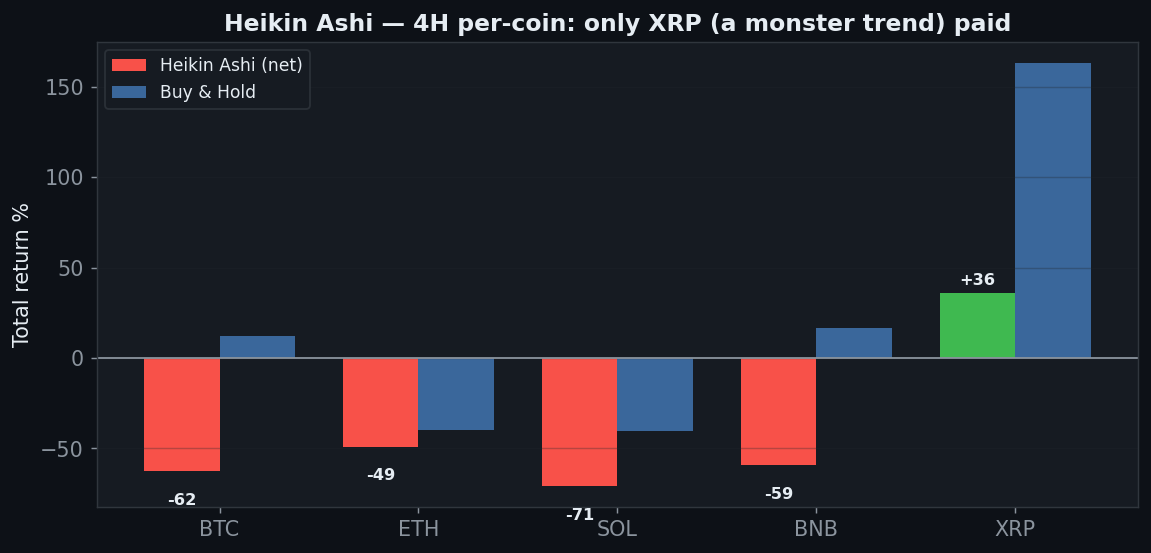
    Coin HA net Buy & Hold Excess
    BTC −63% +12% −75pp
    ETH −49% −40% −9pp
    SOL −71% −40% −31pp
    BNB −59% +17% −76pp
    XRP +36% +163% −127pp

    Only XRP (1 of 5) is net-positive, and even it (+36%) badly trails its own buy & hold (+163%). BTC −63%, SOL −71%. The one green coin is, again, the biggest trender — trend-luck, not edge.

    Heikin Ashi five coins 4H, only XRP positive plus 36, BTC minus 63 SOL minus 71

    Axis 5 — Yearly

    Year BTC 4H net
    2024 +5%
    2025 −60%
    2026 (to Jul) −10%

    Only 2024 is (barely) positive; 2025’s −60% is catastrophic and 2026 is also red. Two of three years lose. A smoothed, lagging colour flip in a choppy, mean-reverting market is a fee-paying machine.

    Axis 6 — Friction & Out-of-Sample

    Heikin Ashi friction gate plus 37 gross to minus 62 net, second most fee sensitive after Stochastic

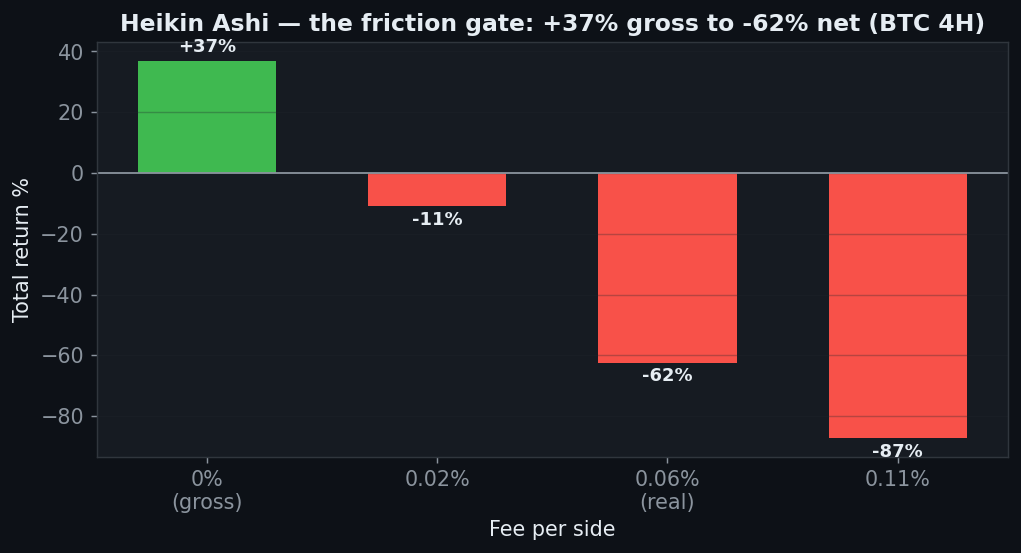
    The friction gate is the whole story: +37% at zero fees → −11% at 0.02% → −62% at 0.06% → −87% at 0.11%. This is the second-most fee-sensitive strategy on the site, behind only the Stochastic crossover — the same over-trading disease. Out-of-sample, 3 of 5 coins are positive over the final six months, but the full sample is a 63% wipeout; that green patch is a window artifact, not evidence of edge.

    The Verdict: REJECT

    • Gate 0 — Indicator fidelitypass (standard Heikin Ashi construction)
    • Gate 1 — Sanitypass (colour read on the closed bar, no look-ahead)
    • Gate 2 — Frictionfail (+37% gross → −62% net on 4H; 5m → −100% over 51,928 trades)
    • Gate 3 — Yearly consistencyfail (2024 +5 / 2025 −60 / 2026 −10 — two of three years lose)
    • Gate 4 — Out-of-samplefail (3/5 over 6 months, but the full sample is a 63% wipeout)
    • Gate 5 — Robustnessfail (raw flip loses at every setting; smoothing to EMA-20 scrapes +4%, marginal and single-coin)
    • Gate 6 — Multi-marketfail (1 of 5 coins; only XRP, a monster trender)
    • Gate 7 — vs Buy & Holdfail (0 of 5 timeframes beat holding)

    Heikin Ashi’s smoothness is a feeling, not an edge. The candles look calm and trend-like, which is precisely why traders trust them — but the colour underneath flips a thousand-plus times, and a genuine +37% gross edge is shredded into a 62% net loss by fees. Smoothing the candles further just trims the bleeding toward zero without ever producing a real system, and 2025 buried even that. The lesson is a recurring one: a signal that looks clean on the chart can still be an over-trading machine once you price in the toll of acting on it.

    FAQ

    You should use Smoothed Heikin Ashi, not raw.
    We tested that — sweeping the EMA length. It helps (fewer trades), and at EMA-20 it reaches +4% on BTC 4H, but that’s a marginal, single-coin, single-timeframe result that still fails the yearly gate. It’s a smaller loss, not an edge.

    Heikin Ashi is for reading trends, not a mechanical signal.
    Agreed, and that’s the honest takeaway: as a visual context it can be useful; as a mechanical colour-flip entry it over-trades and loses. We test the rule people actually trade.

    Can I replicate this?
    Yes — standard Heikin Ashi from Binance OHLC, colour-flip entries, 0.06%/side, five coins, nine timeframes. Every table reproduces.

    See also: Stochastic (the other over-trading autopsy), ADX / DMI, Donchian / Turtle, Triple SuperTrend, and the conditional passes VWAP and Ichimoku (daily).


    Disclaimer: educational research, not financial advice. Past performance does not guarantee future results. Never trade money you cannot afford to lose.
  • ADX / DMI Crossover Strategy Backtest: the Trend Gauge That Enters the Trend Too Late

    ADX / DMI Crossover Strategy Backtest: the Trend Gauge That Enters the Trend Too Late

    Welles Wilder gave technical analysis some of its most enduring tools in his 1978 book — RSI, ATR, Parabolic SAR, and the Directional Movement system: +DI, −DI, and ADX. The idea is elegant. The +DI measures upward directional pressure, the −DI downward, and the ADX measures how strong the trend is regardless of direction. The rule taught to millions is the crossover: when +DI crosses above −DI, go long; when −DI crosses above +DI, go short. So does one of the most respected trend systems in history make money on crypto? We ran it through the 7-Gate Protocol across six robustness axes. Verdict: reject — with one honest twist that points back to how ADX was actually meant to be used.

    Methodology

    • Data: Binance spot, Jul 2024–Jul 2026 (2 years), BTC/ETH/SOL/BNB/XRP
    • Timeframes: 5m–1D (9 buckets, incl. resampled)
    • Execution: on the bar close, no look-ahead; Wilder-smoothed +DI/−DI/ADX, period 14
    • Friction: 0.06%/side (real); 0-fee gross reported too. Benchmark: buy & hold
    • Six axes: timeframe, ADX-filter threshold, TP:SL, multi-coin, yearly, out-of-sample

    Gate 0 — Fidelity

    Standard Wilder DMI(14): +DI and −DI from smoothed directional movement over the true range, ADX from the smoothed DX. Signal on the closed bar, no look-ahead. Reproduced faithfully (pass).

    The Exact Rules

    • Signal: +DI crosses above −DI → long; −DI crosses above +DI → short (stop-and-reverse)
    • Default: period 14, no ADX filter (the raw taught crossover)
    ADX DMI crossover BTC 4H equity minus 47 percent net, gross minus 22 percent, buy and hold plus 12

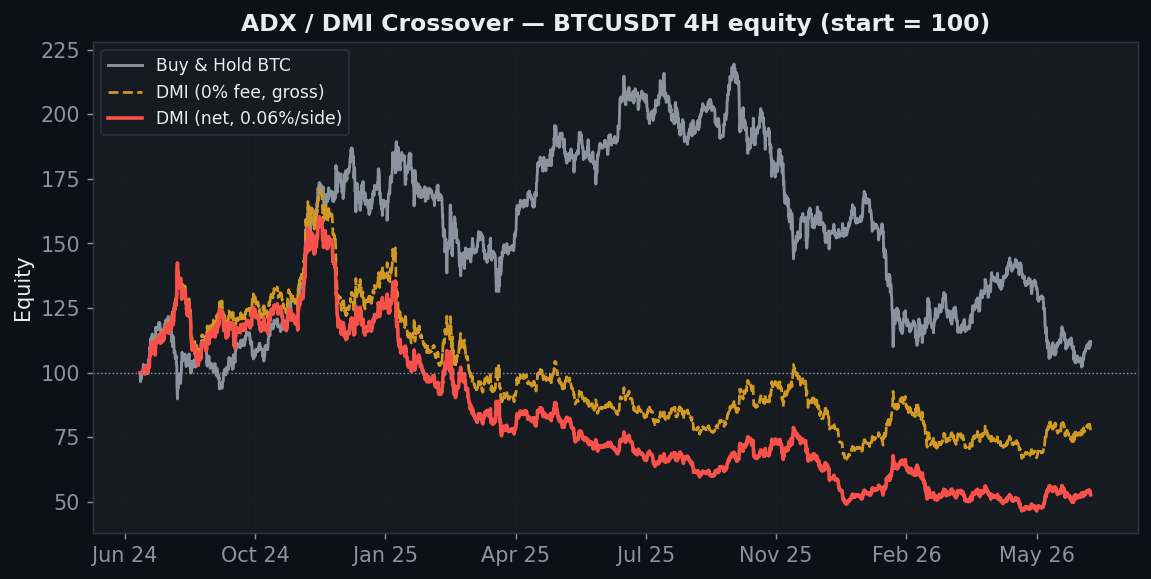
    BTC 4H ends at −47% against buy & hold’s +12%. And the gross (0-fee) line finishes at −22% — deeply negative before a single cent of fees. This is the recurring death sentence on this site: no gross edge to erode. But the DI crossover fails for a specific, diagnosable reason.

    Why It Bleeds: a 29% Win Rate

    DMI plus DI minus DI ADX panel, crossovers fire late, 29 percent win rate, whipsaw in range

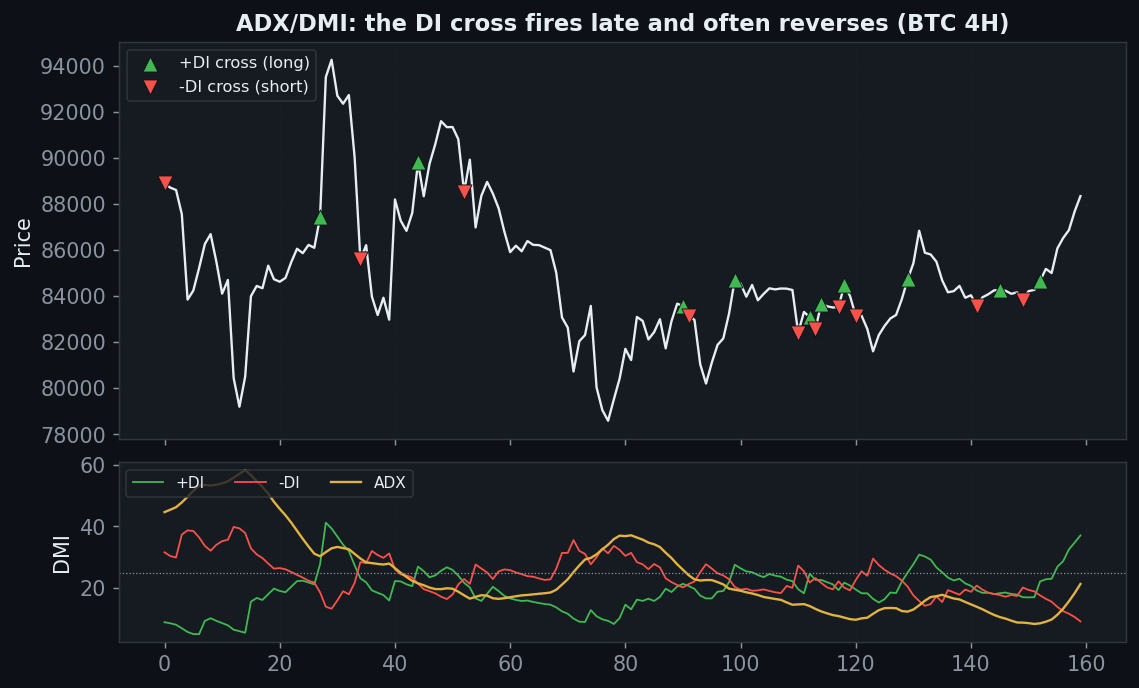
    Look at the bottom panel. The +DI and −DI lines cross after a move is already underway — directional movement has to accumulate before the lines swap order. So the entry is chronically late, and in choppy conditions the lines cross back and forth constantly. The result is a win rate of just 29% on 4H: the system is wrong roughly seven times out of ten, entering the direction of a move only once it’s half over and reversing right before it resumes. ADX (gold) tells you the trend is strong — but the crossover tells you the direction far too slowly.

    Axis 1 — Timeframe (gross vs net)

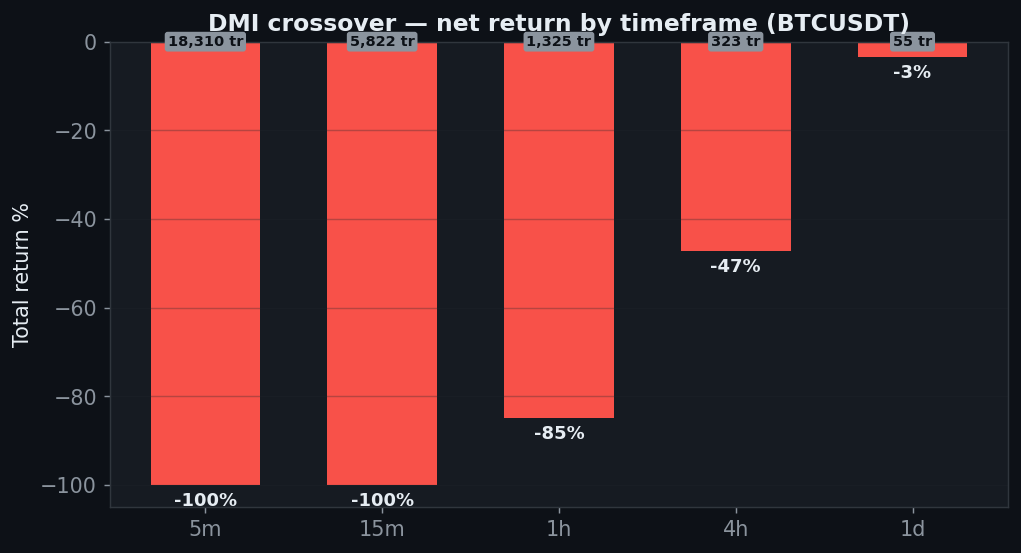
    Timeframe Trades Gross (0 fee) Net (real)
    5m 18,310 −41% −100%
    15m 5,822 −10% −100%
    30m 2,799 +25% −96%
    1h 1,325 −25% −85%
    2h 620 +20% −43%
    4h 323 −22% −47%
    6h 225 −22% −40%
    12h 111 −9% −20%
    1D 55 +3% −4%

    Zero net-positive timeframes. A few buckets are gross-positive (30m +25%, 2h +20%, 1D +3%) — there’s a faint directional signal — but the trade counts are brutal (18,310 on 5m) and fees bury every one of them. The daily is the least-bad at −4%, still behind holding.

    DMI net return by timeframe all negative, minus 100 on 5 minute, minus 4 on daily

    Axis 2 — The ADX Filter (the honest twist)

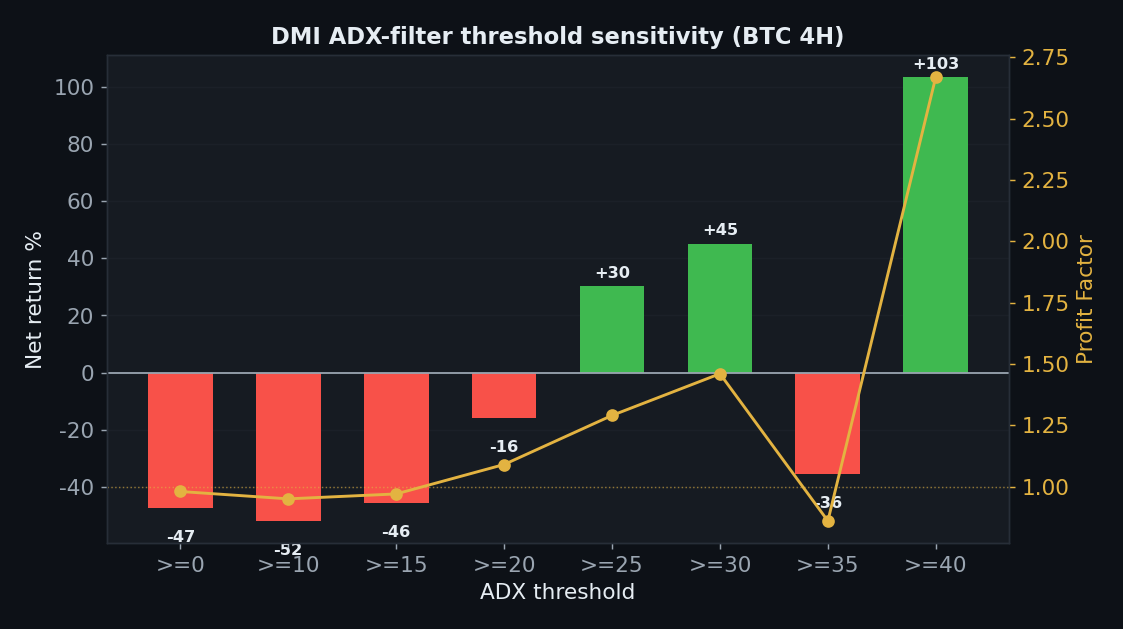
    Here is where DMI differs from a plain oscillator. ADX was designed as a filter — “only trade when the trend is strong.” So we swept the minimum-ADX threshold on BTC 4H.

    ADX filter Trades Net PF
    ≥0 (raw cross) 323 −47% 0.98
    ≥10 319 −52% 0.95
    ≥15 261 −46% 0.97
    ≥20 195 −16% 1.09
    ≥25 115 +30% 1.29
    ≥30 64 +45% 1.46
    ≥35 44 −36% 0.86
    ≥40 23 +103% 2.67

    This is the one genuinely interesting result on this site. The raw crossover (ADX≥0) loses 47%, but requiring ADX≥25–30 flips it positive (+30% to +45%) on a still-reasonable 64–115 trades — consistent with the theory that DI crosses only pay inside strong trends. But do not over-read it. The surface is unstable (ADX≥35 drops back to −36%), and the eye-catching ADX≥40 (+103%) rests on just 23 trades — classic over-fit. The filter’s proper use shows a flicker of merit, but the crossover that’s actually taught — unfiltered — has no edge, and even the filtered version is fragile and would still face the yearly problem below.

    DMI ADX filter threshold sensitivity, raw cross loses, ADX 25 to 30 turns positive, 40 is 23-trade overfit

    Axis 3 — TP:SL

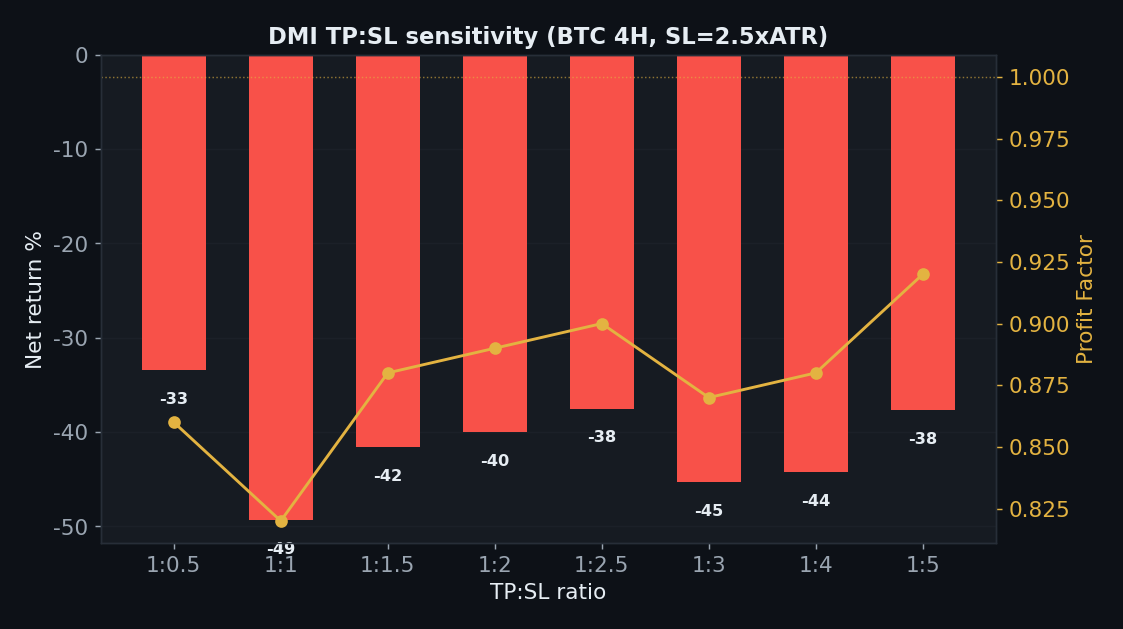
    Fixing the stop at 2.5×ATR and sweeping the take-profit ratio on BTC 4H:

    TP:SL Net PF
    1:0.5 −33% 0.86
    1:1 −49% 0.82
    1:1.5 −42% 0.88
    1:2 −40% 0.89
    1:2.5 −38% 0.90
    1:3 −45% 0.87
    1:4 −44% 0.88
    1:5 −38% 0.92

    Unlike some strategies, there is no take-profit setting that rescues the DI crossover — every ratio from 1:0.5 to 1:5 loses (−33% to −49%). A signal that’s wrong 71% of the time can’t be fixed by adjusting where you take profit.

    DMI TP:SL sensitivity all negative, no take-profit ratio rescues a 29 percent win rate

    Axis 4 — Five Coins

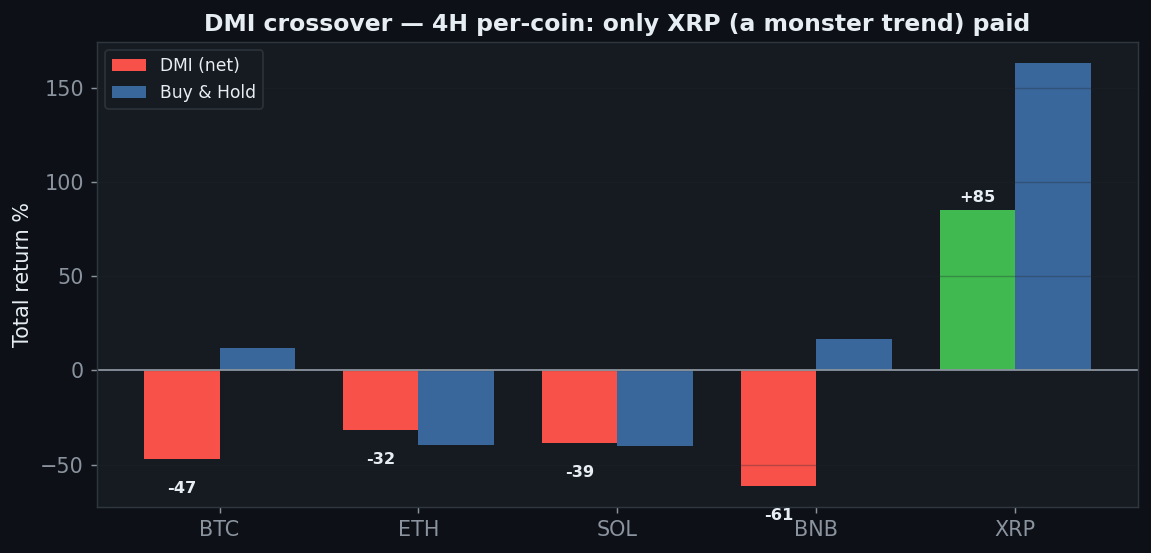
    Coin DMI net Buy & Hold Excess
    BTC −47% +12% −59pp
    ETH −32% −40% +8pp
    SOL −39% −40% +2pp
    BNB −62% +17% −79pp
    XRP +85% +163% −78pp

    Only XRP (1 of 5) is net-positive, and even it (+85%) badly trails its own buy & hold (+163%). BTC loses 47%, BNB 62%. The one green coin is the one that trended hardest — trend-luck, not edge.

    DMI five coins 4H, only XRP positive plus 85, BTC minus 47 BNB minus 62

    Axis 5 — Yearly

    Year BTC 4H net
    2024 +16%
    2025 −58%
    2026 (to Jul) +7%

    2024 and 2026 are positive, but 2025’s −58% is catastrophic and sinks everything. This is even more regime-dependent than most: a laggy crossover in a choppy, mean-reverting year gets destroyed.

    Axis 6 — Friction & Out-of-Sample

    DMI friction gate minus 22 percent gross to minus 47 percent net BTC 4H

    Friction (BTC 4H): −22% gross → −47% net at 0.06%. The out-of-sample split looks green — 4 of 5 coins positive out-of-sample — but don’t be fooled: the full-sample is a 47% wipeout, and a less-bad final six months after that is a window artifact, not evidence of edge. We report it rather than lean on it.

    The Verdict: REJECT

    • Gate 0 — Indicator fidelitypass (standard Wilder DMI(14): +DI/−DI/ADX)
    • Gate 1 — Sanitypass (signal on the closed bar, no look-ahead)
    • Gate 2 — Frictionfail (−22% at zero fees on 4H, −47% net; 5m → −100%)
    • Gate 3 — Yearly consistencyfail (2024 +16 / 2025 −58 / 2026 +7 — 2025 is catastrophic)
    • Gate 4 — Out-of-samplefail (window artifact) (4/5 looks green but the full sample is a −47% wipeout)
    • Gate 5 — Robustnessfail (raw crossover loses; the ADX≥25–30 filter helps but is unstable, and ≥40 is 23-trade over-fit)
    • Gate 6 — Multi-marketfail (1 of 5 coins; only XRP, a monster trender)
    • Gate 7 — vs Buy & Holdfail (0 of 5 timeframes beat holding; net-positive on one coin)

    ADX measures trend strength; the DI crossover measures direction — too late. By the time +DI and −DI swap places a move is half-spent, and a 29% win rate is the arithmetic of always arriving after the party. The one honest bright spot is that ADX used as a filter (≥25–30) nudges the crossover positive — which is exactly how Wilder intended ADX to be used, and an argument against trading the naked cross at all. But that edge is unstable, single-regime, and evaporated in 2025. As the taught crossover, DMI is a reject.

    FAQ

    You’re supposed to use ADX as a filter, not trade the raw cross.
    Agreed — and that’s the point. The raw crossover is what’s taught to beginners, so we tested it; it loses. Filtering to ADX≥25–30 does help, but our sweep shows that edge is fragile (it breaks by ≥35) and the standout ≥40 result is 23 trades of noise. A real ADX-filtered system would still have to clear the yearly and multi-coin gates, where it stumbles.
    Why is the win rate so low?
    Directional movement has to build before the DI lines cross, so entries lag; in ranges the lines cross repeatedly. Being right on direction but late means small wins and frequent stop-and-reverse losses — 29% winners.

    Can I replicate this?
    Yes — Wilder DMI(14), +DI/−DI crossover, public Binance data, 0.06%/side, five coins, nine timeframes. Every table reproduces.

    See also: Donchian / Turtle Breakout, Triple SuperTrend, UT Bot, Parabolic SAR, and the conditional passes VWAP and Ichimoku (daily).


    Disclaimer: educational research, not financial advice. Past performance does not guarantee future results. Never trade money you cannot afford to lose.