Category: Backtests

  • Golden Cross Strategy: Does It Beat Buy & Hold? 9 Years, 5 Coins, 5 Timeframes

    Golden Cross Strategy: Does It Beat Buy & Hold? 9 Years, 5 Coins, 5 Timeframes

    The golden cross — a short moving average crossing above a long one — is the most famous signal retail traders know. YouTube sells it by the million views: “buy the golden cross, ride the trend.” So does it actually beat simply holding?

    We ran it through the full 7-Gate Protocol: 9 years of daily data, 5 liquid coins, 5 timeframes down to 5-minute bars, a parameter sweep, and a 2,000-path Monte Carlo. It failed — and not narrowly. Here is the complete autopsy.

    The Exact Rules

    • Signal: fast MA crosses above slow MA (default 50/200) → go long; death cross → flat (cash)
    • Position: spot, long-only, no leverage
    • Execution: signal on the daily close, enter the next bar — no look-ahead
    • Costs: 0.11% per side (fees + slippage), applied on every entry and exit
    • Data: Binance daily, Aug 2017 – Jul 2026 (plus intraday for the timeframe test)
    • Benchmark: buy & hold over the identical window

    The Baseline: BTC, 50/200
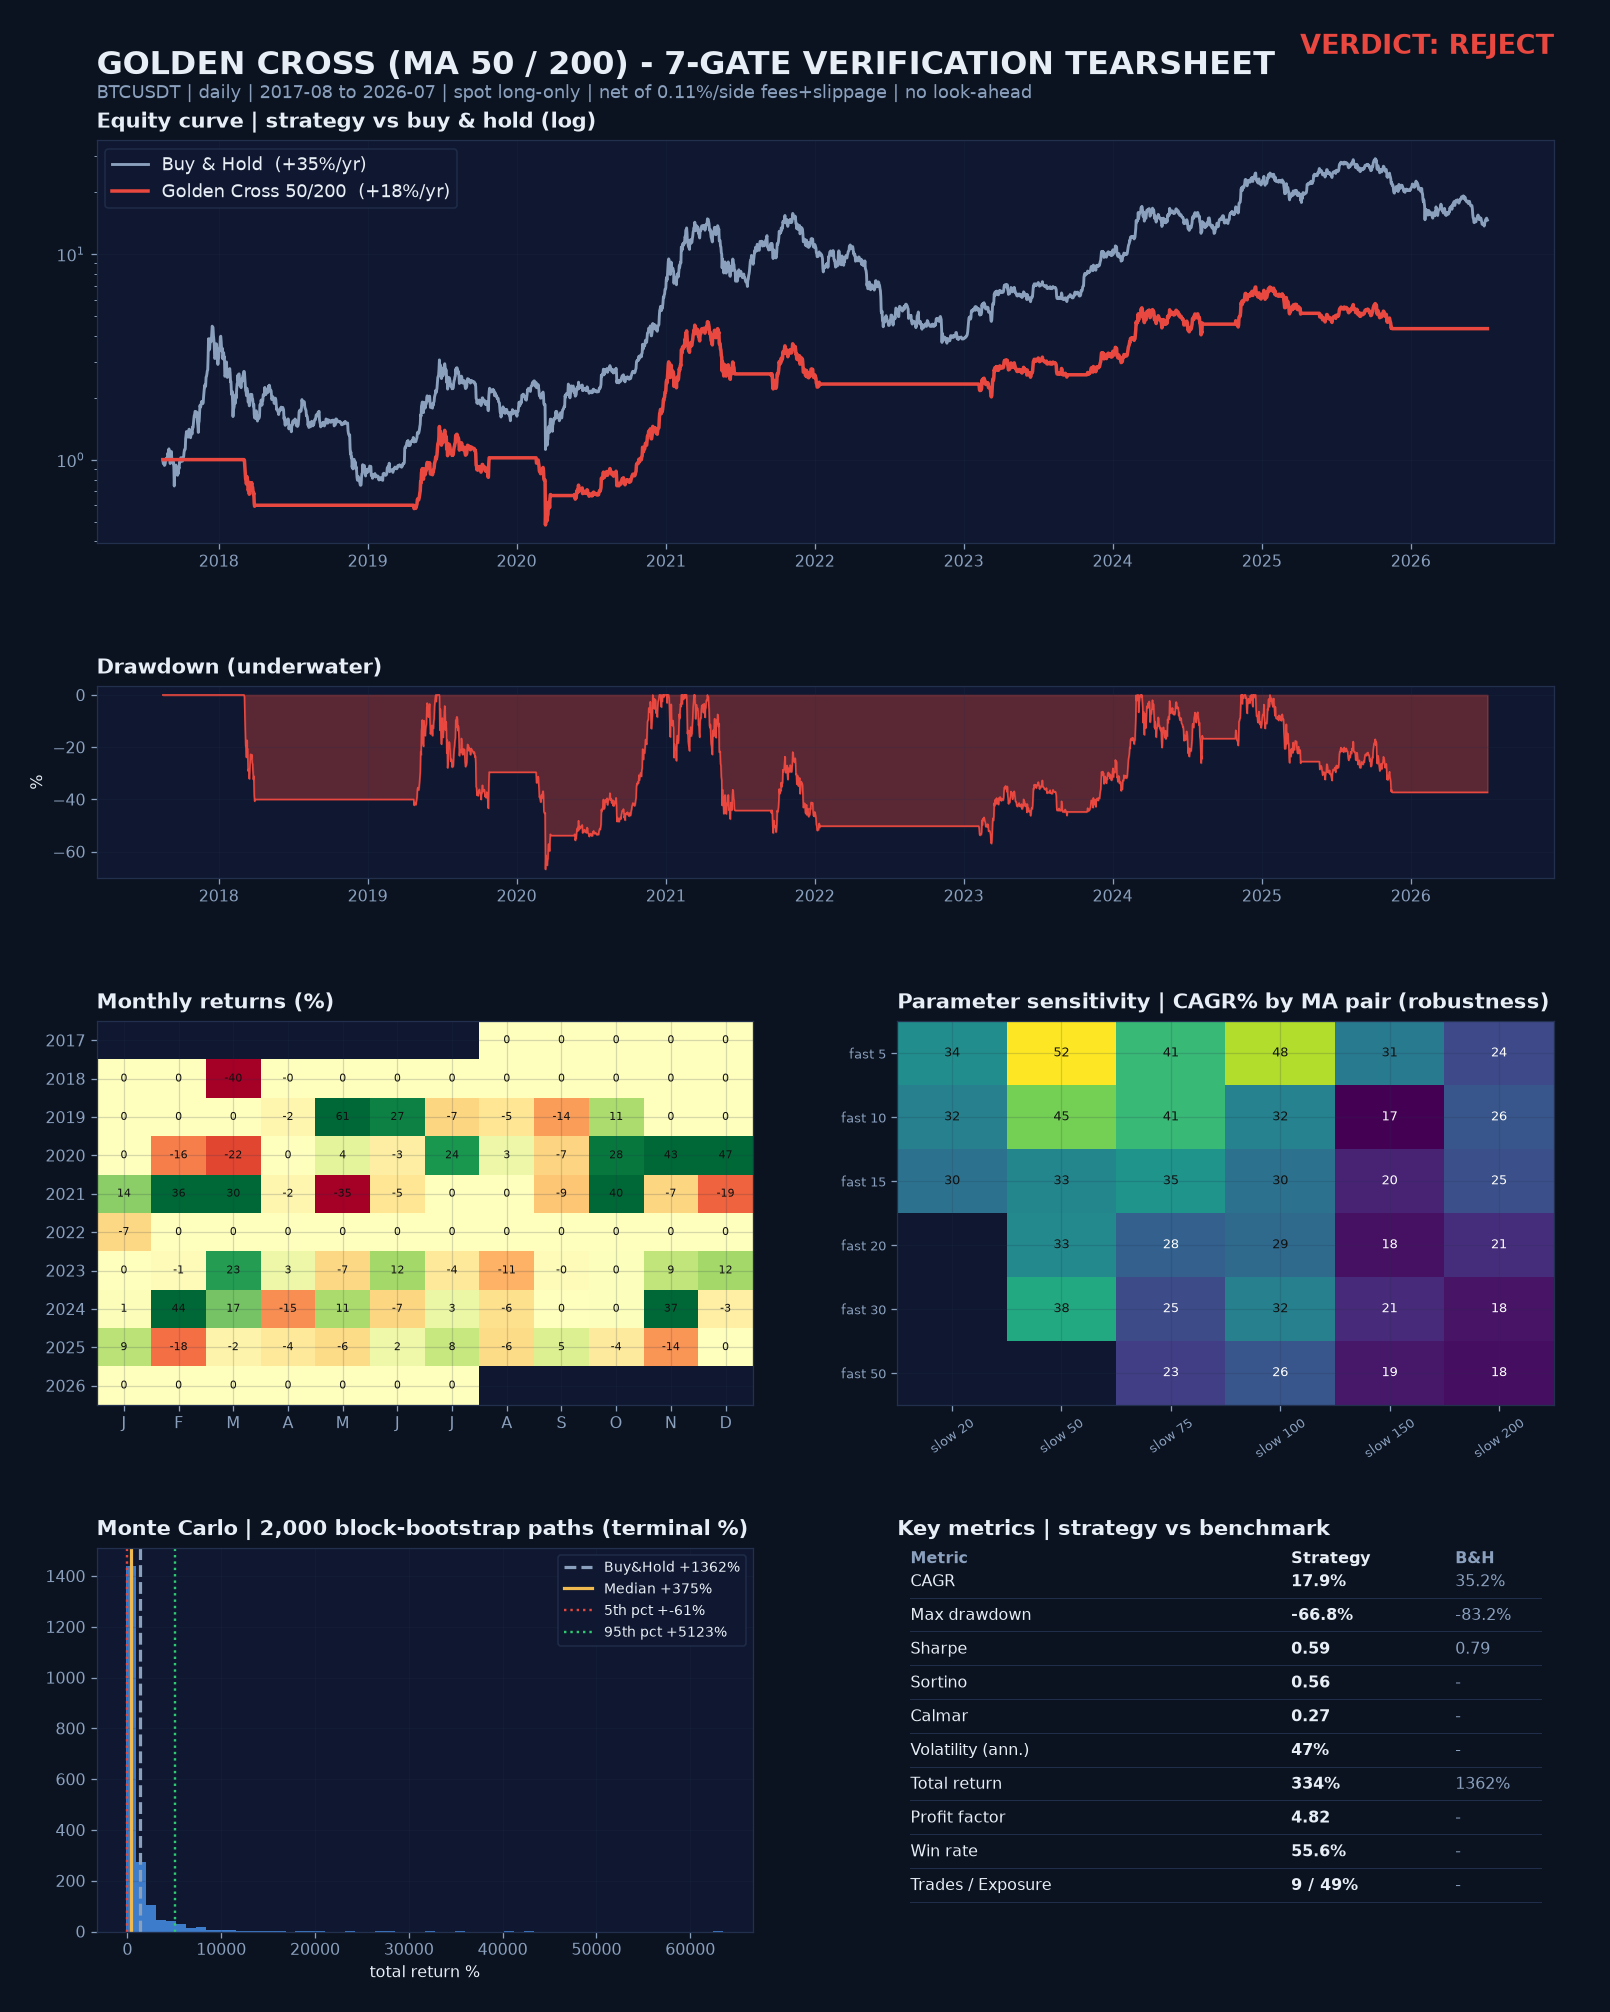
    Golden cross 50/200 seven-gate verification tearsheet, BTC 2017-2026, verdict reject

    +334% total return sounds great — until you see buy & hold did +1,362% over the same window. Sharpe 0.59 vs 0.79. Calmar 0.27. The strategy’s only real contribution is a smaller drawdown (−66.8% vs −83.2%). It doesn’t make you more; it loses you less. That is a risk tool, not a profit engine — and it is the opposite of what the golden-cross evangelists promise.

    Gate 03 — Yearly & Monthly
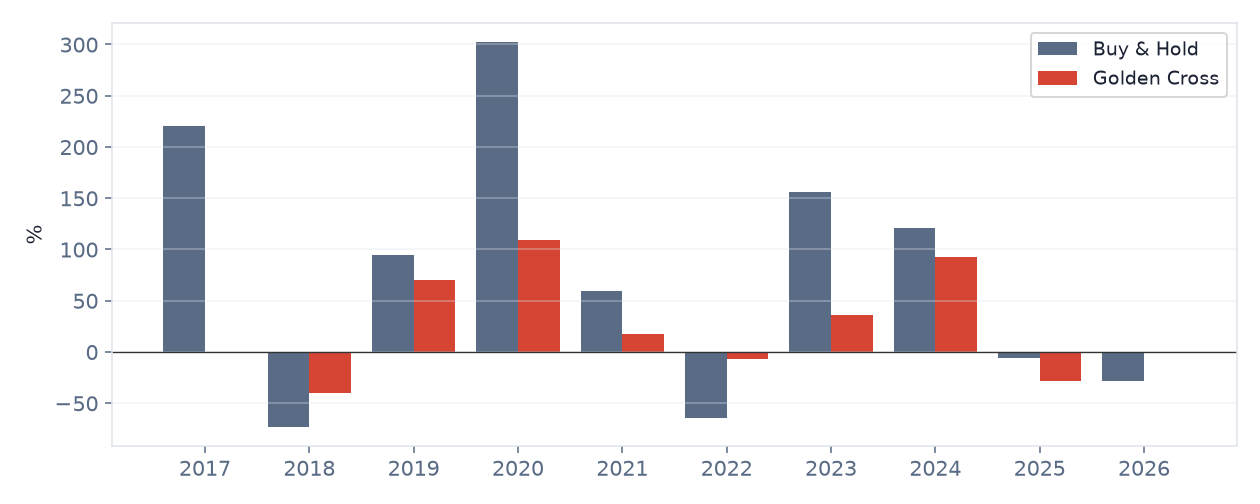
    Golden cross vs buy and hold yearly returns, BTC

    The pattern is unmistakable: the golden cross only wins in crash years — 2018 (−40% vs −73%), 2022 (−7% vs −64%). In every bull year it lags badly (2020: +109% vs +302%; 2021: +18% vs +60%). It is a drawdown filter wearing a profit strategy’s clothes.
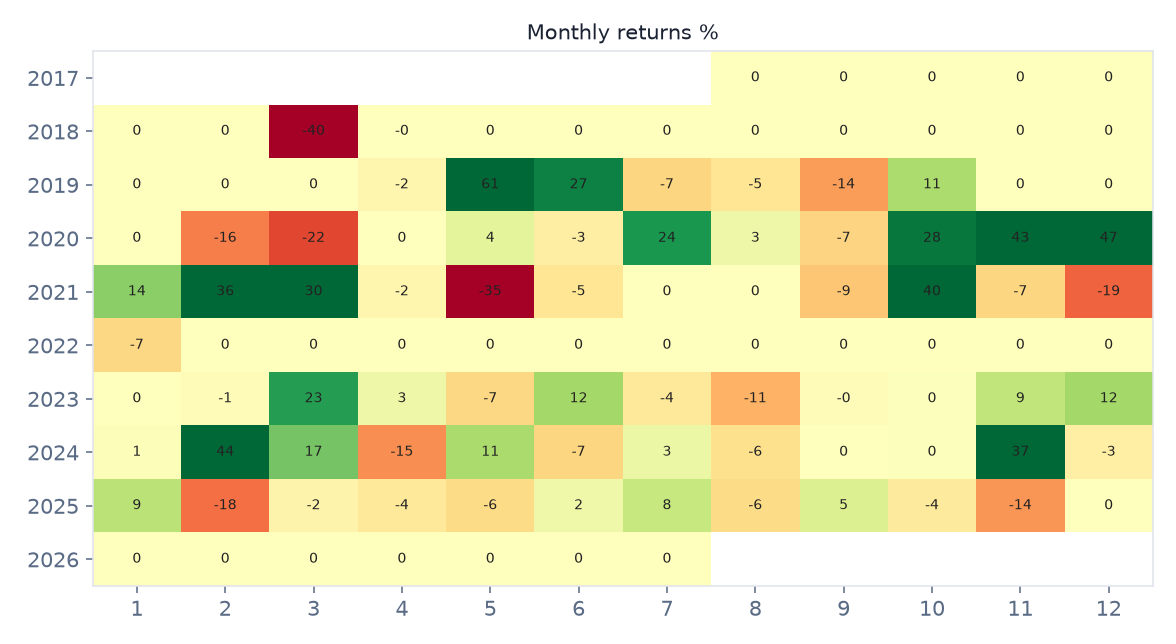
    Golden cross monthly returns heatmap by year

    Monthly, there is no seasonality — long flat stretches (cash) punctuated by the occasional green month. You don’t get paid on a schedule; you get paid only when a big trend shows up.

    Gate 04 — Out-of-Sample

    Split the history in half. First half (2017–2022, an explosive bull): golden cross +133% vs buy & hold +759% — a rout. Second half (2022–2026, chop and decline): +86% (−37% DD) vs +69% (−67% DD) — here it wins, mostly on drawdown. The edge is regime-dependent, not stable.

    Gate 05 — Parameter Robustness (the killer)
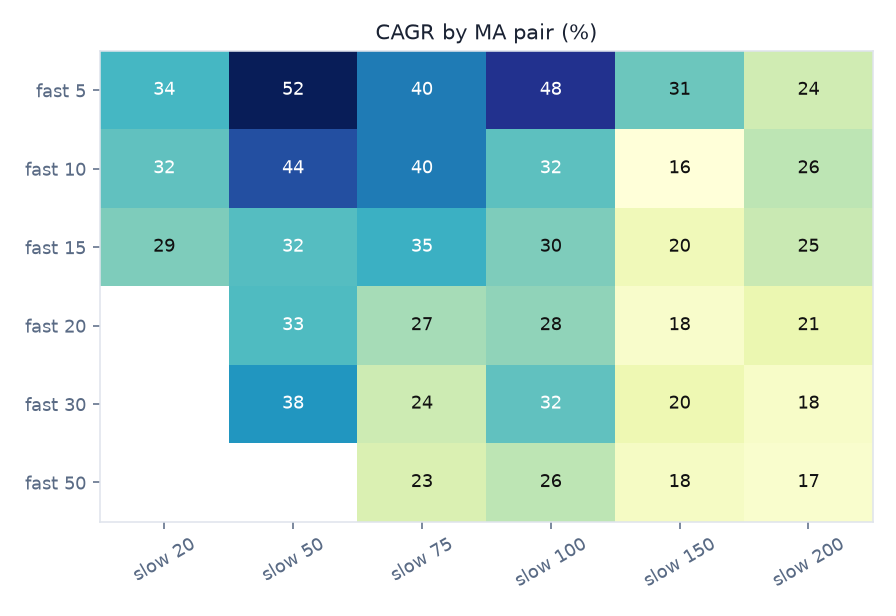
    Golden cross CAGR by moving average pair, parameter robustness heatmap

    “Golden cross” means 50/200 to almost everyone. But CAGR swings wildly with the MA pair: the best combination reaches ~52% CAGR while the famous 50/200 sits near the bottom at ~18%. On ETH the gap is extreme — a 10/30 cross returns ~59% CAGR versus ~15% for 50/200. Most of the “performance” is simply which moving average you happened to pick. That is not an edge; that is luck, and the crowd picked one of the worst cells.

    Gate 06a — Every Timeframe (the scalper’s grave)
    Golden cross across timeframes, gross vs net after fees, friction destroys low timeframes

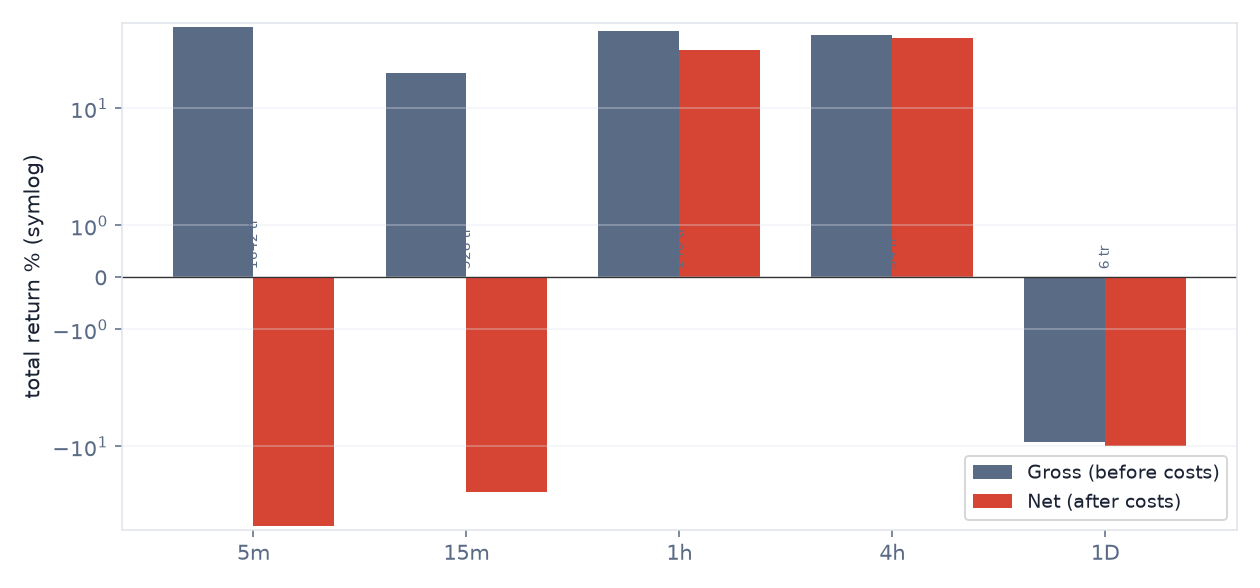
    Does it work intraday, the way the “golden cross scalping” videos claim? We ran the identical 50/200 cross on 5m, 15m, 1h, 4h and daily. The result is brutal: on 5-minute bars it is +74% gross but −71% net once you pay for 1,642 trades. 15m: +24% → −31%. The lower the timeframe, the faster friction eats it alive. 4H is the least-bad (+56% net) yet still loses to buy & hold (+74%) over the same window. Golden-cross scalping is dead on arrival — the fees alone bury it.

    Gate 06b — Five Liquid Coins
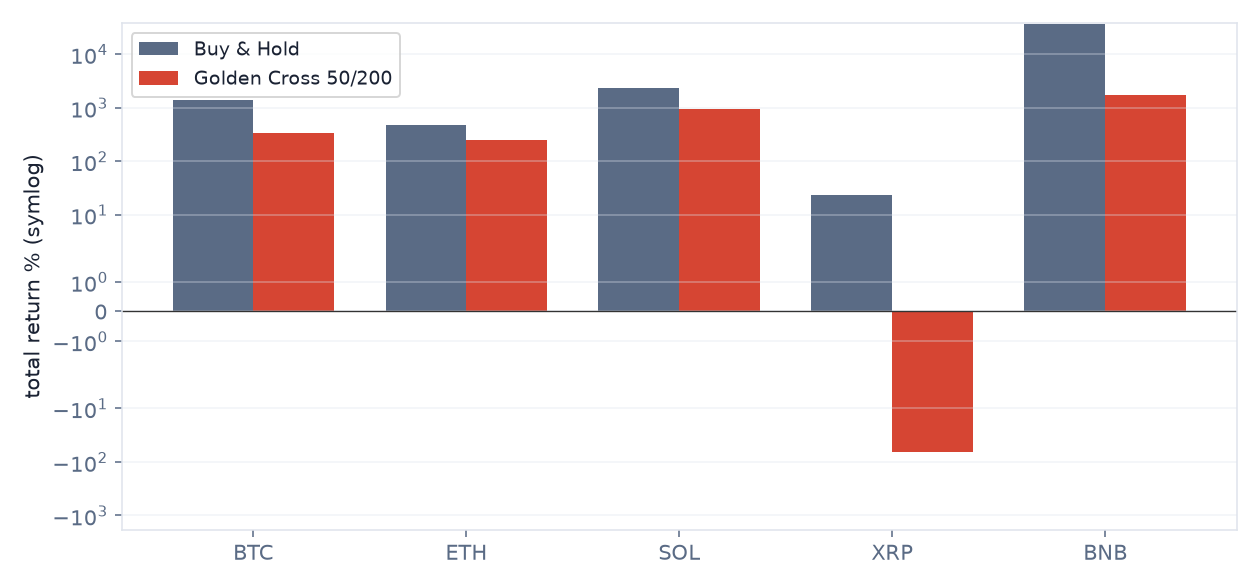
    Golden cross vs buy and hold on five liquid coins BTC ETH SOL XRP BNB
    Symbol Golden Cross Buy & Hold Strategy Max DD Verdict
    BTC +334% +1,362% −66.8% loses to holding
    ETH +245% +481% −79.4% loses to holding
    SOL +922% +2,272% −78.4% loses to holding
    XRP −65% +23% −91.4% loses money
    BNB +1,740% +36,044% −77.3% loses to holding

    Five of the most liquid coins in crypto. The golden cross loses to buy & hold on every single one. On XRP it doesn’t merely underperform — it loses money (−65% while holding made +23%), whipsawed to death by a coin that mostly went sideways. Note BNB: even against a 361× monster, the golden cross returned “only” +1,740% — underperforming by a factor of twenty. The stronger the trend, the more it leaves on the table.

    Gate 07 — Monte Carlo
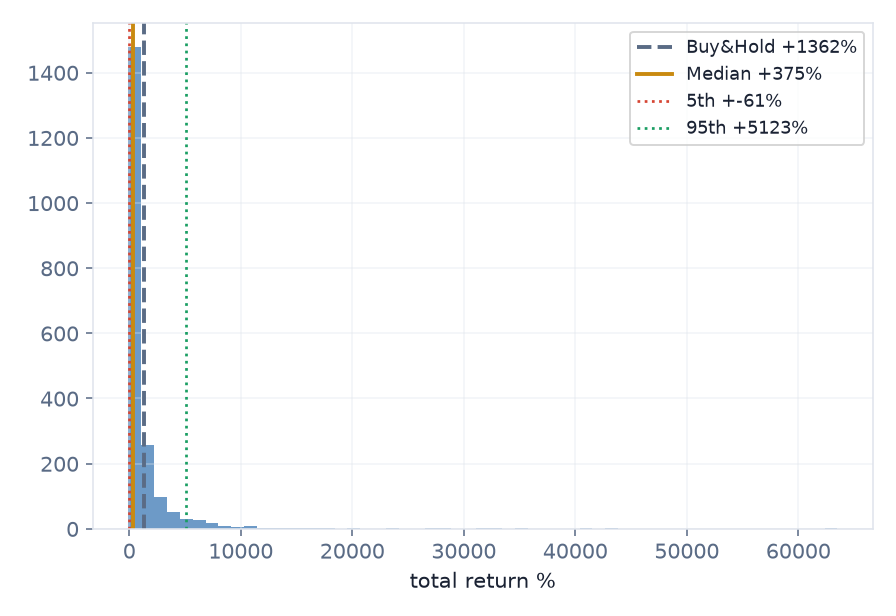
    Golden cross Monte Carlo 2000 bootstrap paths terminal return distribution

    2,000 block-bootstrap paths of the daily returns. The median outcome is +375% — close to the actual +334%, and still far below buy & hold’s +1,362%. The 5th–95th percentile band is enormous (−61% to +5,123%), confirming heavy path-dependence. Translation: even luck doesn’t rescue it.

    Take-profit to stop-loss — and why it cannot help

    Could a fixed target beat holding to the death cross? We swept a fixed stop (3×ATR) and target on the daily 50/200 crosses, 2017–2026.

    TP : SL Trades Win rate Profit factor Net return
    1 : 0.5 8 62.5% 0.75 −12%
    1 : 1 8 50.0% 1.01 −5%
    1 : 1.5 8 50.0% 1.52 +16%
    1 : 2 8 50.0% 2.03 +40%
    1 : 2.5 8 50.0% 2.55 +69%
    1 : 3 8 50.0% 3.06 +101%

    Two problems leap out. First, the sample: a 50/200 golden cross fires just 8 times in nine years, so every figure here rests on eight trades — statistically meaningless, however tidy the rising profit factor looks. Second, even the best fixed target (+101% at 1:3) is far below simply holding to the death cross (+334%), and further still below buy-and-hold (+1362%). A take-profit on a trend-following cross only caps the rare winners that justify it. TP:SL cannot rescue a signal already beaten by doing nothing.

    The Verdict: REJECT

    Adding up the gates:

    • Gate 0 — Indicator fidelitypass (standard 50/200 simple-moving-average cross)
    • Gate 1 — Sanitypass (signal on the closed bar, entry next bar, no look-ahead)
    • Gate 2 — Frictionfail intraday (5m/15m flip to losses purely on fees)
    • Gate 3 — Yearly consistencyfail (wins only in crash years, lags every bull)
    • Gate 4 — Out-of-samplepartial (regime-dependent)
    • Gate 5 — Robustnessfail (result hinges on the MA pair; 50/200 is near-worst)
    • Gate 6 — Multi-marketfail (loses to holding on all 5 coins)
    • Gate 7 — vs Buy & Holdfail (behind on total return and Sharpe)

    “Buy the golden cross and profit” is, on the data, false. Its only value is drawdown reduction — and even that depends on a moving-average pair you got lucky with. As a standalone profit strategy it is a myth. As a defensive trend filter bolted onto a real system, maybe. Nothing more.

    That distinction is the whole point of this site. One YouTube title says “The golden cross made 922% on Solana!” Another says “I tested the golden cross and lost money!” Both are technically true (SOL and XRP, right here). Neither is the truth.

    FAQ

    Then why does everyone still use it?
    Because in crash years it looks like genius, and almost nobody backtests the bull years it quietly lags. Availability bias does the rest.

    Isn’t a smaller drawdown worth it?
    Only if you value risk reduction over returns and accept the parameter fragility. A plain “exit below the 200-day” achieves similar defense with far less overfitting risk.

    Does it work on stocks or forex?
    Different assets, different result. This test is crypto spot, daily and intraday. We only publish what we measured.

    Can I replicate this?
    Yes — the rules above are complete, the data is public Binance OHLCV, fees 0.11%/side. Every number in this article falls out of those inputs.

    See also: the RSI 30/70 strategy (died at gate 2) and the VWAP trend-pullback strategy (the first to earn a conditional pass).


    Disclaimer: This is educational research, not financial advice. Past performance does not guarantee future results. Never trade money you cannot afford to lose.
  • VWAP Strategy Backtest: 5 Coins, 16 Parameter Sets, Full Out-of-Sample Test

    VWAP Strategy Backtest: 5 Coins, 16 Parameter Sets, Full Out-of-Sample Test

    Last time, the RSI 30/70 strategy died at gate 2 — fees ate it alive before we even got to the interesting questions. This strategy is different. It’s the first one to make it deep into the 7-Gate Protocol: five symbols, sixteen parameter sets, and a full out-of-sample split.

    It survived more gates than anything we’ve tested. It still didn’t survive all of them. Here’s the complete autopsy — including exactly where it works and where it dies.

    The Exact Rules

    • Timeframe: 4H candles
    • Trend filter: EMA(100) — longs only above it, shorts only below it
    • Entry: price pulls back and touches the daily VWAP, then closes back in the trend direction
    • Stop loss: fixed at entry ± 2.0 × ATR(14) — never trailed
    • Exit: close crossing back through the EMA(100) (trend over), or the stop
    • Fees: 0.06% per side, intrabar stop fills
    • Data: 2 years (July 2024 – July 2026), Binance public data

    One counterintuitive detail from our earlier testing: a trailing stop destroys this strategy (PF 0.76). Pullback entries get shaken out by noise. The fixed stop is not a preference — it’s the difference between profit and ruin.

    The Baseline: BTC, 4H

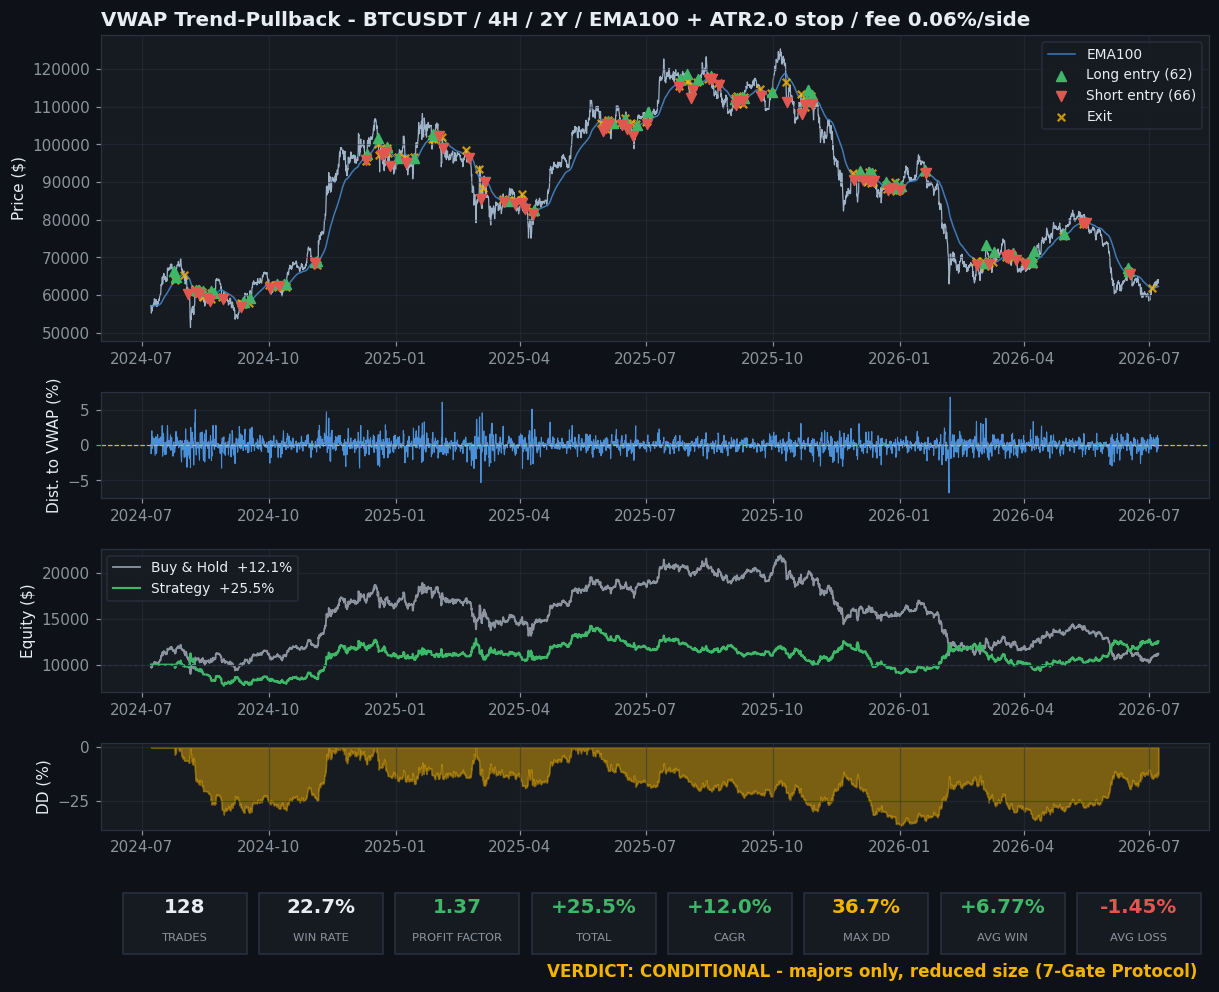
    VWAP trend pullback strategy backtest tear sheet BTCUSDT 4H with trade markers

    Look at that win rate: 22.7%. Three losses out of four trades — and it still made +25.5%, double Buy & Hold. This is the exact mirror image of the RSI lesson: average win +6.77%, average loss −1.45%. Win rate is a vanity metric. Payoff asymmetry is the business model.

    Gate 03 — Monthly Consistency

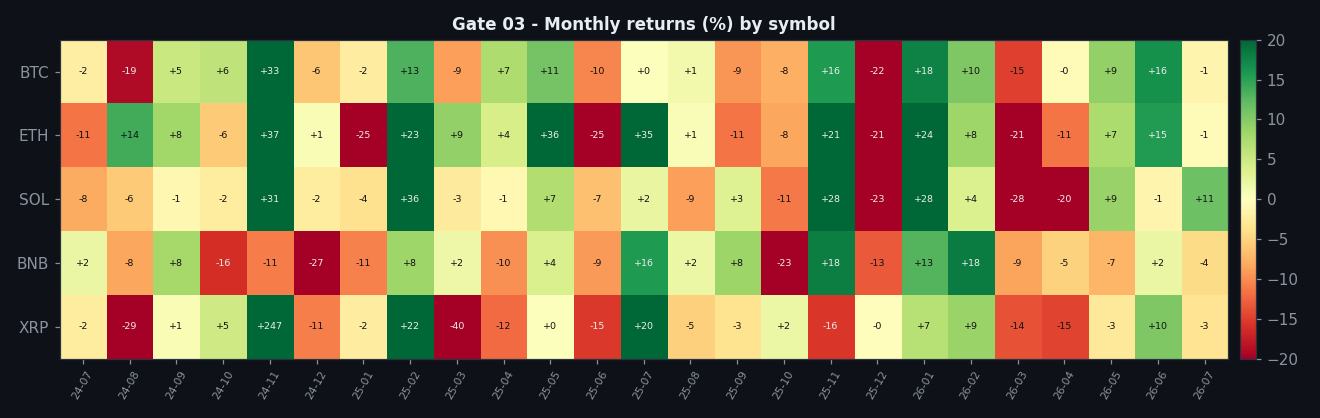
    VWAP strategy monthly returns heatmap by symbol

    Not pretty, not terrible. Long flat-to-red stretches punctuated by big green months — the classic trend-following profile. You don’t get paid monthly; you get paid when trends happen.

    Gate 04 — Out-of-Sample

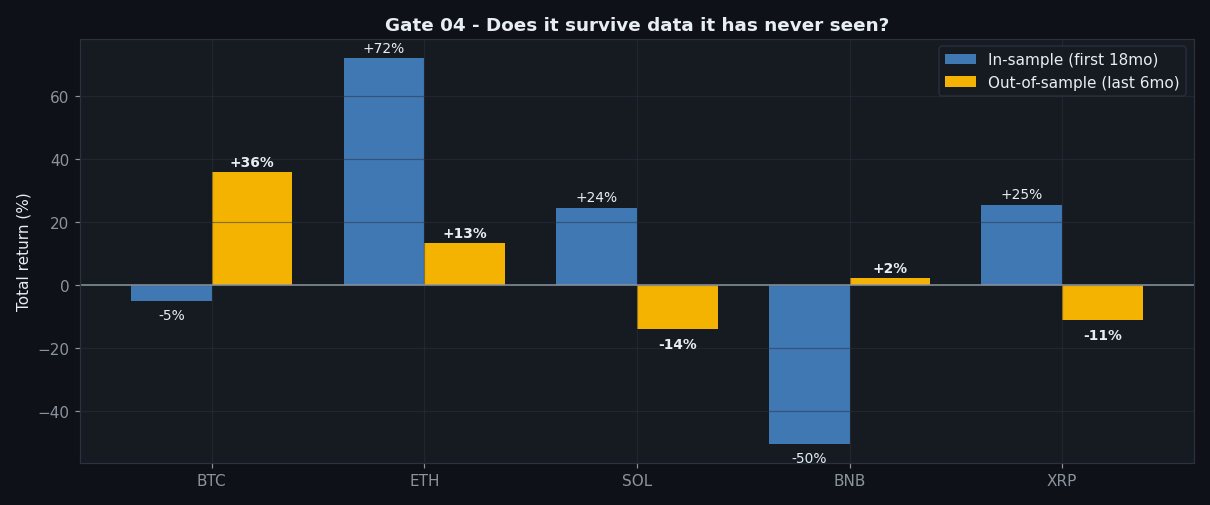
    VWAP strategy in-sample vs out-of-sample returns by symbol

    We split the data: first 18 months in-sample, last 6 months untouched. 3 of 5 symbols stayed positive out-of-sample. BTC actually got better (PF 2.46 out-of-sample). SOL and XRP flipped negative. Partial pass — the edge doesn’t evaporate on unseen data, but it’s not universal either.

    Gate 05 — Parameter Robustness

    VWAP strategy parameter sweep heatmap EMA ATR robustness

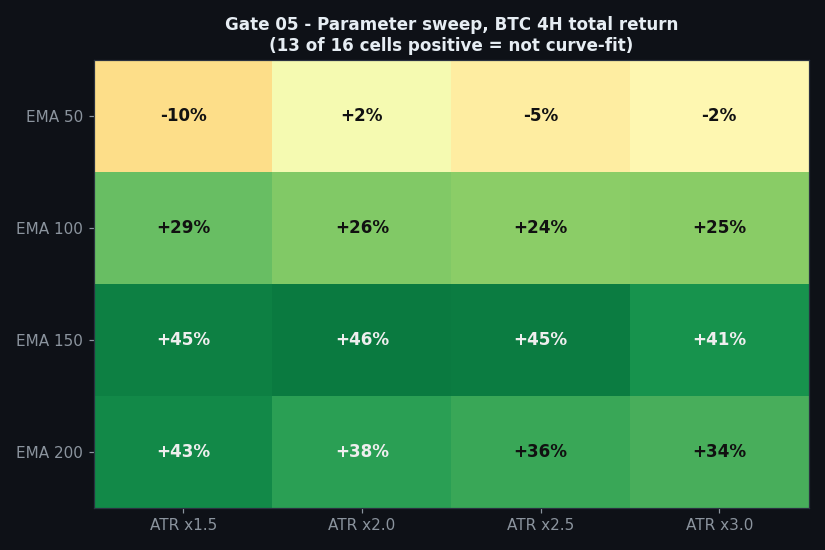
    Sixteen combinations of EMA length (50–200) and ATR stop multiple (1.5–3.0): 13 of 16 positive. This is what a real edge looks like — it degrades gracefully when you wiggle the knobs. A curve-fit strategy shows one green cell in a sea of red.

    Gate 06 — Five Symbols, Same Rules

    VWAP strategy tested on five crypto symbols vs buy and hold
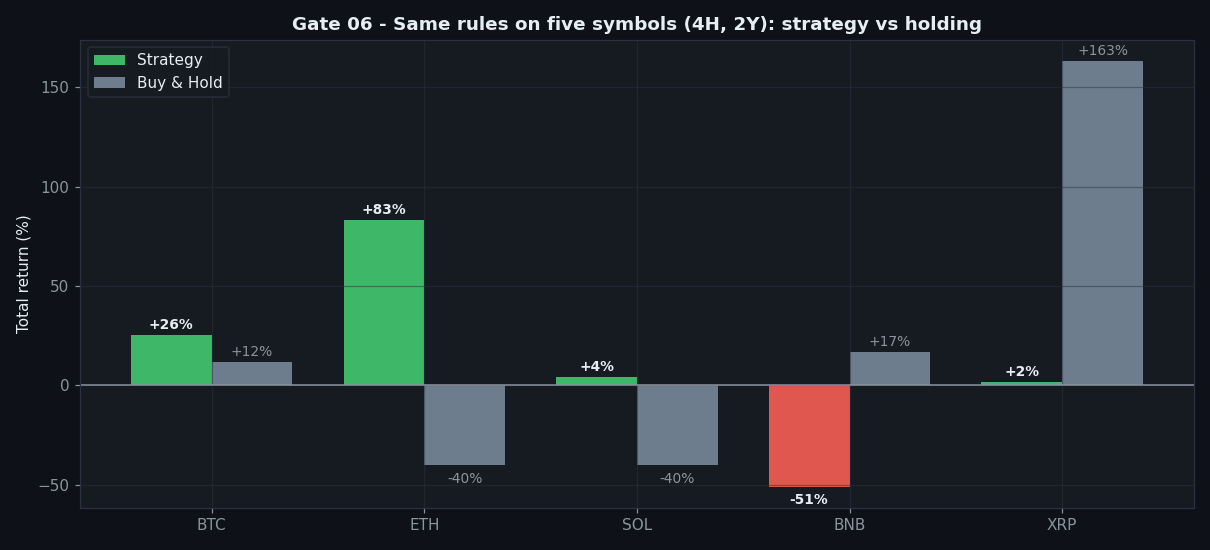
    Symbol Trades PF Total return Max DD Buy & Hold Verdict
    BTC 128 1.37 +25.5% 36.7% +12.1% beats holding
    ETH 128 1.51 +83.3% 41.8% −39.8% crushes holding
    SOL 133 1.15 +4.2% 51.1% −40.2% beats holding
    BNB 165 0.80 −50.8% 60.6% +16.8% fails
    XRP 148 1.68 +1.5% 75.9% +163.2% loses to holding

    This is why gate 06 exists. Test on BTC alone and you’d call it a winner. Test on BNB and you’d call it garbage. Both would be wrong: the edge is real on majors and absent elsewhere. Anyone selling you a strategy that “works on everything” hasn’t run this test.

    Every timeframe (why 4-hour is the whole story)

    A conditional pass comes with a condition, and for VWAP pullback it is the timeframe. The identical rules, run from 5-minute to daily:

    Timeframe Trades Win rate Profit factor Net return
    5-minute 9,124 11.7% 0.22 −100%
    15-minute 3,097 15.1% 0.37 −100%
    30-minute 1,442 18.4% 0.54 −93%
    1-hour 709 20.3% 0.71 −68%
    4-hour (baseline) 159 22.6% 1.20 +21%
    1-day 30 20.0% 0.73 −28%

    Every intraday interval loses — a total wipe on 5-minute — and the edge appears only on the 4-hour. Push to daily and the sample thins and it slips back to −28%. This is not a strategy you can run anywhere; it is a 4-hour phenomenon, which is precisely why the verdict is conditional.

    Take-profit to stop-loss (4-hour)

    Swapping the exit for a fixed stop (2×ATR) and a swept target:

    TP : SL Trades Win rate Profit factor Net return
    1 : 0.5 102 69.6% 0.93 −8%
    1 : 1 77 57.1% 1.15 +13%
    1 : 1.5 72 50.0% 1.29 +31%
    1 : 2 61 41.0% 1.16 +14%
    1 : 2.5 55 38.2% 1.29 +27%
    1 : 3 53 32.1% 1.11 +5%

    Unlike the rejects on this site, VWAP’s edge survives the exit sweep: for every reward-to-risk from 1:1 to 1:3 the profit factor holds above 1.0, peaking at 1.29. That resilience across exits is what separates a conditional pass from a rejection — though a very tight 1:0.5 target still tips it slightly negative.

    The Verdict: CONDITIONAL

    Adding up the gates:

    • Gate 0 — Indicator fidelitypass (standard daily VWAP with an EMA trend filter and ATR stop)
    • Gate 1 — Sanitypass (signals on closed bars, no look-ahead)
    • Gate 2 — Frictionpass (still profitable after 0.06%/side — the gate where RSI died)
    • Gate 3 — Yearly consistencypartial (trend-dependent, with long flat stretches)
    • Gate 4 — Out-of-samplepartial (3 of 5 positive)
    • Gate 5 — Robustnesspass (13 of 16 sweep cells positive)
    • Gate 6 — Multi-marketpartial (works on majors; BNB fatal)
    • Gate 7 — vs Buy & Holdpartial (beats it on 3 of 5 coins)

    Our verdict stamp says CONDITIONAL, and now the conditions are precise:

    Majors only (BTC/ETH). Reduced position size — the 37–42% drawdowns are real. As a portfolio component, not a standalone system. Traded outside those conditions, expect the BNB outcome.

    That nuance is the whole point of this site. A YouTube title would say “this VWAP strategy made 83% on ETH!” A different YouTube title would say “I tested VWAP and lost 50%!” Both are technically true. Neither is the truth.

    FAQ

    Why does it fail on BNB?
    BNB spent much of the window in choppy, range-bound conditions where trend filters generate false regime signals. The strategy needs trends; BNB didn’t provide them.

    Would a different VWAP (weekly, anchored) help?
    In our earlier tests, weekly VWAP performed worse as a touch level. Volume-profile POC levels also degraded results — daily VWAP carried all the edge.

    What about the low win rate — can I handle 3 losses out of 4?
    That’s the real question. Statistically it works; psychologically most people abandon it during the losing streaks. That’s a you-parameter, not a strategy parameter.

    Can I replicate this?
    Yes — the rules above are complete, data is public Binance OHLCV, fees 0.06%/side. Every number in this article falls out of those inputs.


    Disclaimer: This is educational research, not financial advice. Past performance does not guarantee future results. Never trade money you cannot afford to lose.
  • RSI Strategy Backtest: I Tested the Famous 30/70 Rule on Bitcoin (It Lost 65%)

    RSI Strategy Backtest: I Tested the Famous 30/70 Rule on Bitcoin (It Lost 65%)

    Every trading YouTube channel eventually makes the same video: “Buy when RSI drops below 30, sell when it crosses 70.” It sounds logical. It looks great on cherry-picked charts. Some videos claim win rates of 80–90%.

    So I did what almost nobody does: I coded the exact rules and ran them on 2 years of real Bitcoin data — with real trading fees included.

    Spoiler: every variant lost money. One lost 65%. Here is the full breakdown, so you don’t have to pay for this lesson with your own account.

    The Exact Rules I Tested

    No vague “price action confirmation.” Rules a computer can execute:

    • Indicator: RSI(14), Wilder’s smoothing, 1-hour candles
    • Long entry: RSI crosses up through 30
    • Long exit: RSI crosses up through 70
    • Short entry (long+short variant): RSI crosses down through 70
    • Short exit: RSI crosses down through 30
    • Data: BTCUSDT, 17,500+ hourly candles (July 2024 – July 2026)
    • Fees: 0.06% per side (typical crypto futures taker fee)
    • Position size: 100% of equity per trade, starting from $10,000

    The Results

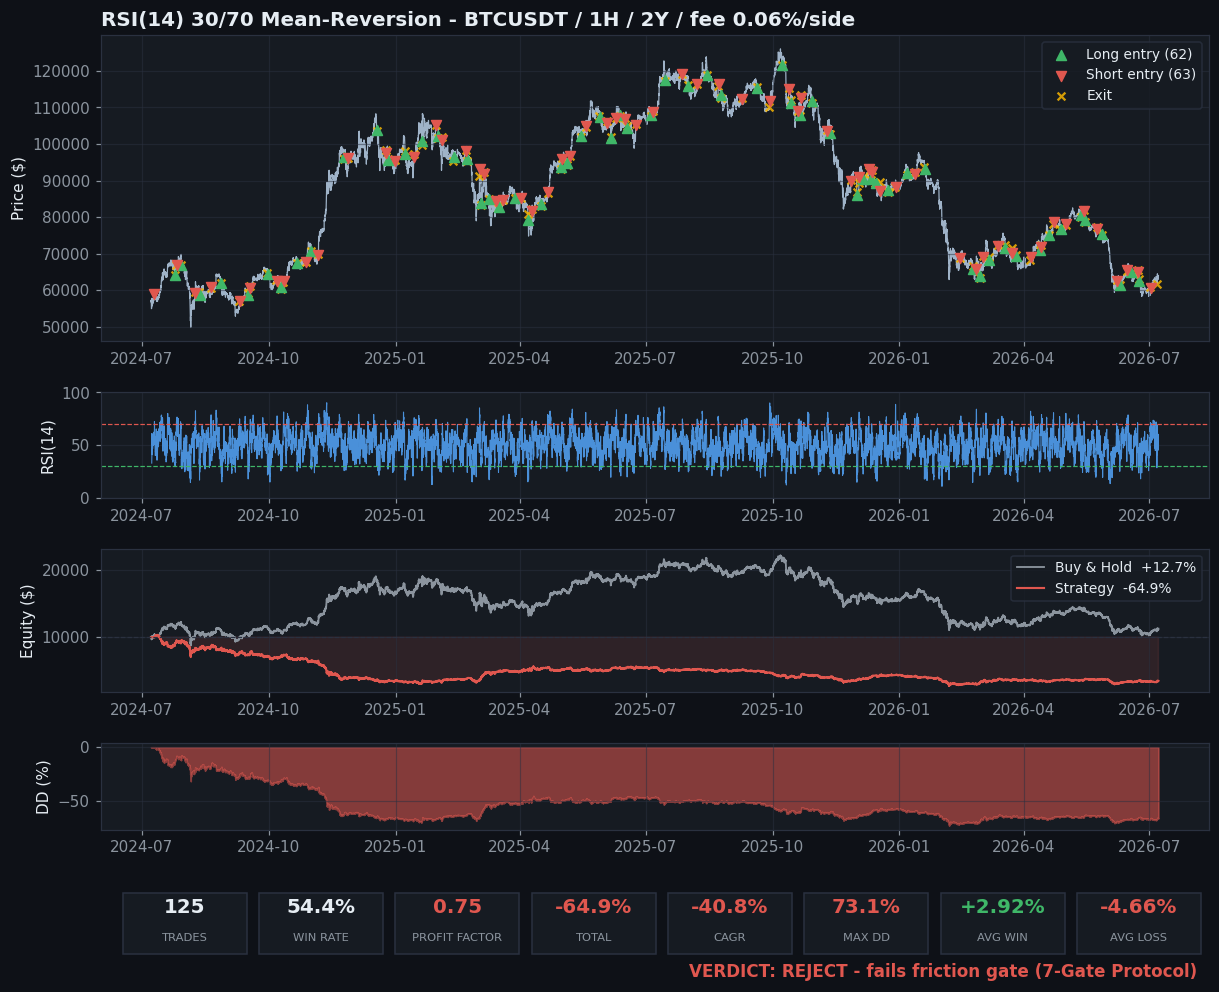
    RSI strategy backtest full tear sheet with long short trade markers bitcoin
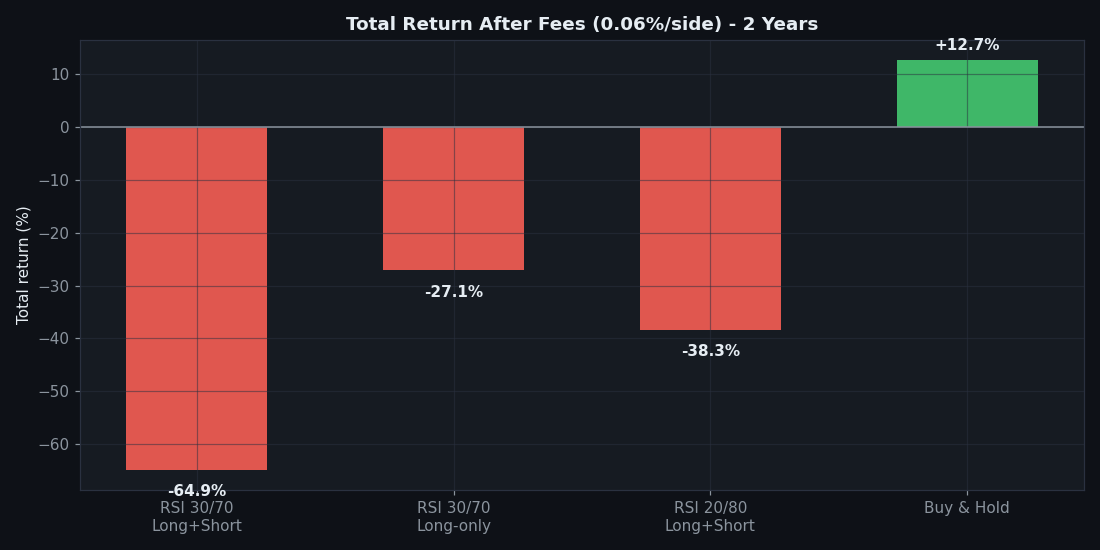
    Variant Trades Win rate Profit factor Total return Max drawdown
    RSI 30/70 long+short 125 54.4% 0.75 −64.9% 73.1%
    RSI 30/70 long-only 62 58.1% 0.86 −27.1% 46.6%
    RSI 20/80 long+short 26 69.2% 1.05 −38.3% 73.3%
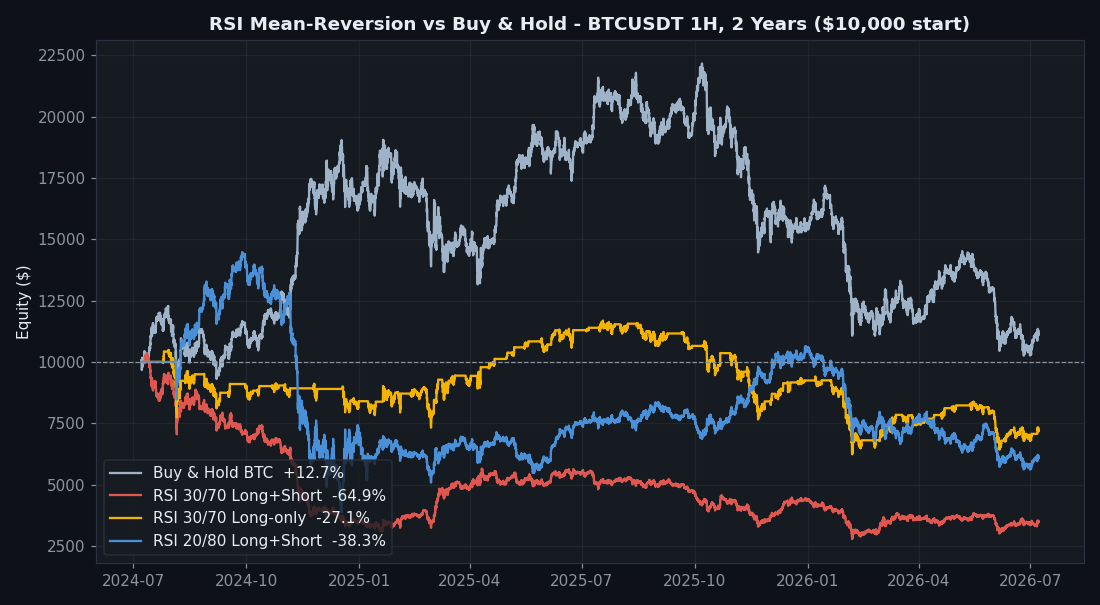
    Buy & Hold BTC +12.7%
    RSI strategy total returns after fees bar chart

    Read that table again. The strictest variant had a 69% win rate and still lost 38%. Meanwhile, doing absolutely nothing — just holding BTC — made +12.7%.

    Why a 69% Win Rate Still Loses Money

    This is the single most important lesson in this article.

    RSI mean-reversion produces many small wins and a few catastrophic losses. When you buy an oversold dip in a real downtrend, RSI doesn’t politely bounce back. It stays oversold while price keeps falling — and the strategy has no stop loss. One bad trend wipes out twenty small wins.

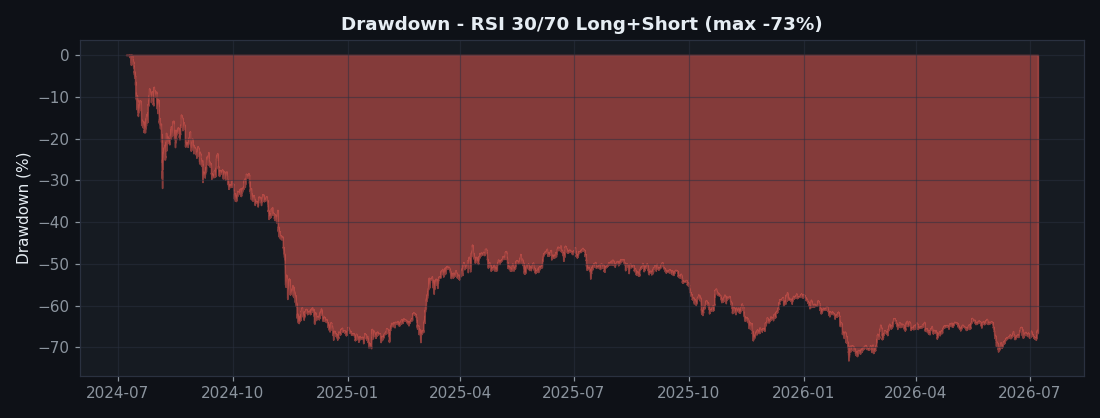
    RSI strategy 73 percent drawdown chart

    That’s what a 73% drawdown looks like. If you started with $10,000, at the worst point you had $2,700. Nobody keeps trading a system through that.

    The math that YouTube never shows:

    • Win rate is meaningless without payoff ratio. 69% wins × small size, 31% losses × huge size = net loss.
    • Fees compound brutally. 125 round trips × 0.12% ≈ 15% of your account gone to fees alone.
    • Buying dips fights the trend. In crypto, trends run further than RSI assumes.

    “But It Worked in That YouTube Video…”

    1. Cherry-picked windows. Any strategy looks amazing during the right 3 months. I tested a full 2-year window.
    2. No fees or slippage. Add 0.06% per side and high-frequency signals collapse.
    3. Hindsight entries. In live trading you get every RSI<30 signal, including the twenty that came before the bottom.
    RSI strategy backtest equity curve vs buy and hold bitcoin

    Same Rules, Every Timeframe: 5m to 1D

    “Maybe it just needs a lower timeframe.” I hear that every time a strategy fails. So the engine re-ran the identical rules on five timeframes — over 240,000 candles in total. Nobody gets to say I didn’t look.

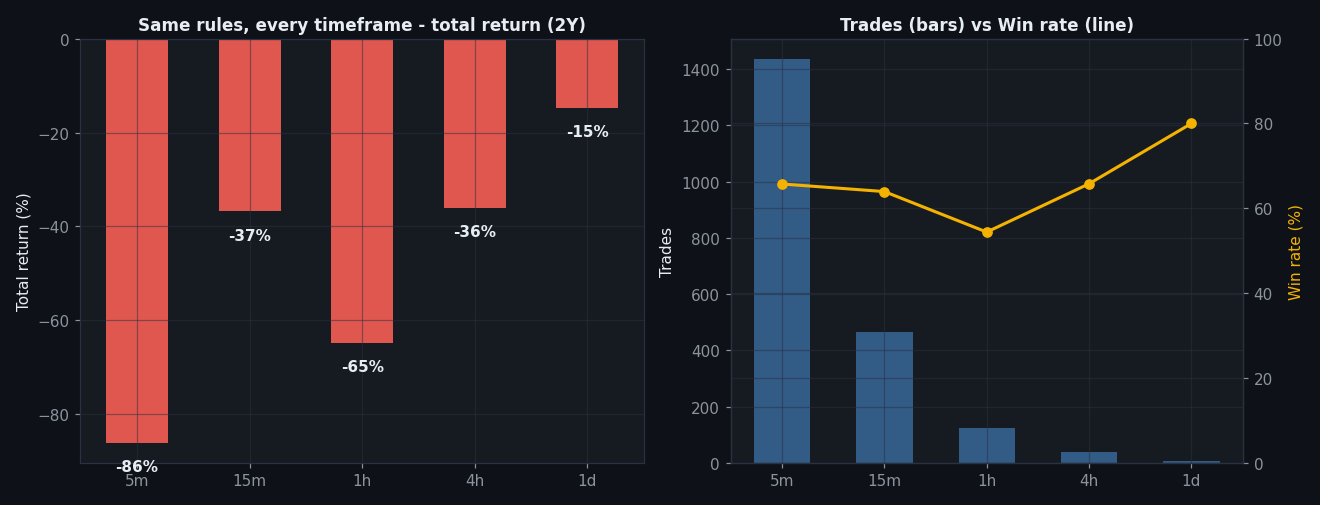
    RSI strategy tested on 5m 15m 1h 4h 1d timeframes total returns
    Timeframe Trades Win rate Profit factor Total return Max drawdown
    5m 1,436 65.7% 0.99 −86.0% 88.2%
    15m 466 63.9% 1.07 −36.8% 56.1%
    1h 125 54.4% 0.75 −64.9% 73.1%
    4h 38 65.8% 0.93 −36.0% 64.0%
    1d 5 80.0% 1.13 −14.7% 66.5%

    Two things this table screams:

    • 5m is death by fees. A 65.7% win rate across 1,436 trades — and it still lost 86%. At 0.12% per round trip, the fees alone consumed more than the entire account. This is gate 02 in its purest form.
    • 1D hit an 80% win rate and still lost money. Five trades, four winners — and the single loser erased them all. Win rate tells you nothing about the size of the loss that’s coming.
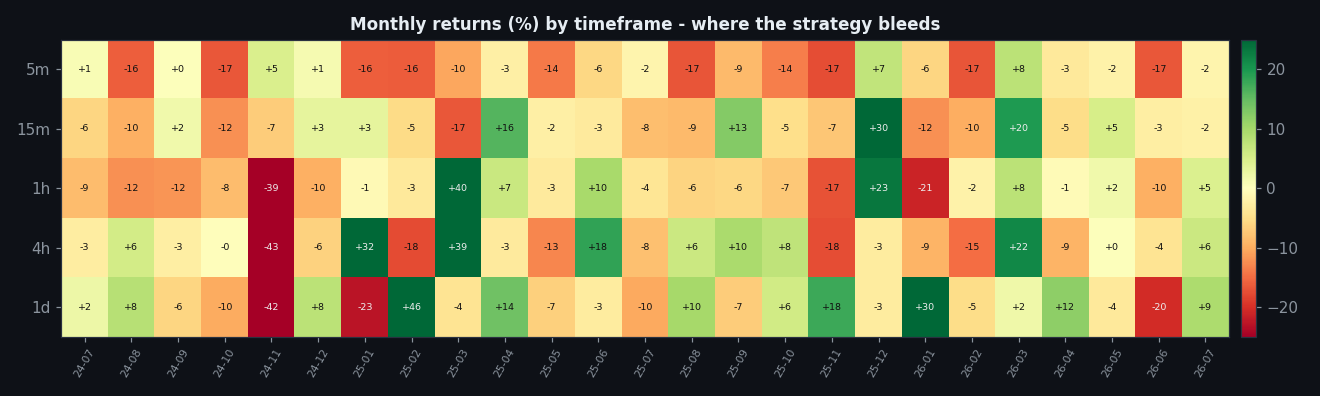
    RSI strategy monthly returns heatmap by timeframe

    The monthly heatmap exposes the regime problem. In 2025 — an up-trending year — the 1h/4h/1d variants printed +22% to +39%. Then 2024 and 2026 took it all back:

    Timeframe 2024 (H2) 2025 2026 (H1)
    5m −24.9% −71.5% −34.7%
    15m −26.8% −3.5% −10.4%
    1h −64.1% +22.5% −20.2%
    4h −47.0% +38.9% −13.1%
    1d −41.4% +23.6% +17.8%

    A strategy that only works in one market regime isn’t a strategy — it’s a bet on the regime. That’s a gate 03 failure (yearly consistency), stacked on top of the gate 02 failure.

    Does a fixed take-profit save it? (TP : SL sweep)

    Maybe the RSI-70 exit is the problem. We replaced it with a fixed stop (2×ATR) and a fixed target, and swept the reward-to-risk from 1:0.5 to 1:3 on BTC 1H.

    TP : SL Trades Win rate Profit factor Net return
    1 : 0.5 254 64.6% 0.60 −48%
    1 : 1 218 42.7% 0.60 −60%
    1 : 1.5 210 34.3% 0.69 −56%
    1 : 2 203 27.6% 0.71 −56%
    1 : 2.5 197 23.4% 0.72 −56%
    1 : 3 190 20.5% 0.73 −56%

    It changes nothing. Every ratio loses 48–60% with a profit factor stuck between 0.60 and 0.73. A tight target lifts the win rate to 65%, but the losers are twice the size; a wide target trims the win rate to 20%. There is no exit that rescues a losing entry — the oversold bounce simply is not there to harvest.

    Does This Mean RSI Is Useless?

    No — it means RSI as a standalone entry signal is useless on crypto. Tools like RSI or VWAP only stop bleeding money when they’re subordinated to a trend filter with a hard stop loss — and even then they rarely beat a simple trend-following system. (Read the full VWAP backtest here — it made it much further through the gates.)

    The general rule: mean reversion without a stop loss is how accounts die slowly, then suddenly.

    The 7-Gate Scorecard

    • Gate 0 — Indicator fidelitypass (standard Wilder RSI(14))
    • Gate 1 — Sanitypass (signal on the closed bar, no look-ahead)
    • Gate 2 — Frictionfail (5-minute loses 86% on fees alone; negative on every timeframe)
    • Gate 3 — Yearly consistencyfail (positive only during 2025’s bull; loses in every other stretch)
    • Gate 4 — Out-of-samplefail (2 of 5 coins positive out-of-sample)
    • Gate 5 — Robustnessfail (every take-profit ratio from 1:0.5 to 1:3 loses)
    • Gate 6 — Multi-marketfail (0 of 5 coins profitable on 4H; XRP −977% at an 83% win rate)
    • Gate 7 — vs Buy & Holdfail (long+short −65%, long-only −27% vs BTC +12.7%)

    How I Validate Any Strategy (The 7-Gate Checklist)

    1. Code sanity — no lookahead bias, no repainting
    2. Friction — realistic fees and slippage included
    3. Yearly breakdown — profits every year, or one lucky year?
    4. Out-of-sample — does it survive data it wasn’t tuned on?
    5. Robustness — small parameter changes shouldn’t destroy it
    6. Multi-market — one coin’s fluke, or a general edge?
    7. Beats Buy & Hold — otherwise, why bother?

    The RSI 30/70 strategy fails gate 2 and never recovers. Most YouTube strategies die at the same gate.

    FAQ

    What RSI settings did you use?
    RSI(14), Wilder’s smoothing, 1H candles — the default in TradingView.

    Would a stop loss fix it?
    It reduces catastrophic losses but doesn’t create an edge. The entry itself is the problem.

    What data and code did you use?
    Public Binance OHLCV data and a Python backtester. The rules above are complete — you can replicate every number.


    Disclaimer: This is educational research, not financial advice. Past performance does not guarantee future results. Never trade money you cannot afford to lose.