SuperTrend is the single most-marketed indicator on crypto YouTube — an ATR trailing stop that paints green in uptrends and red in downtrends, sold as a near-magic trend signal. Does the stop-flip actually make money? We ran the standard SuperTrend(10, 3) through the 7-Gate Protocol. Verdict: reject.
Methodology
- Data: Binance spot, Jul 2024–Jul 2026 (2 years), BTC/ETH/SOL/BNB/XRP
- Timeframes: 5m–1D (9 buckets, incl. resampled)
- Execution: A 10-period ATR trailing stop set a multiplier (default 3) from the mid-price. Close above the stop flips long; close below flips short. Closed-bar, no look-ahead
- Friction: 0.06%/side (real); 0-fee gross reported too. Benchmark: buy & hold
- Six axes: timeframe, atr multiplier, TP:SL, multi-coin, yearly, out-of-sample
Gate 0 — Fidelity
A 10-period ATR trailing stop set a multiplier (default 3) from the mid-price. Close above the stop flips long; close below flips short. Reproduced exactly (pass).
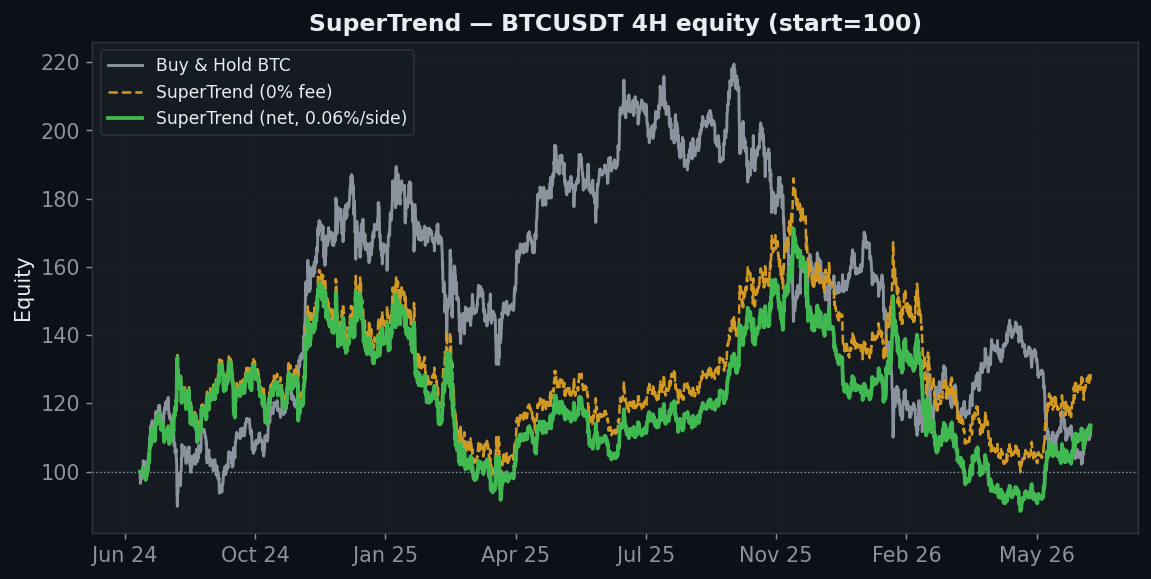
How It Behaves
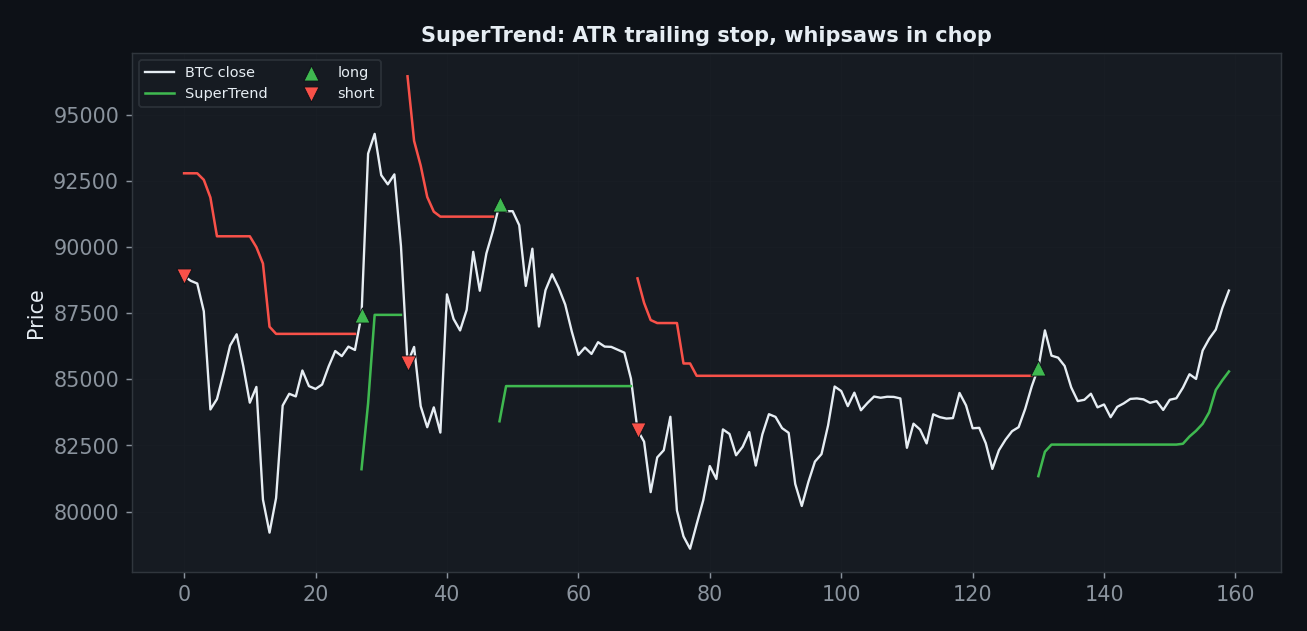
SuperTrend is just an ATR trailing stop. In a clean trend it holds the position and looks brilliant; in a range it gets tagged repeatedly, flipping long and short around the same price. On the 4H it barely nets ahead of holding; on the daily it gets whipsawed for −52%.
Axis 1 — Timeframe
| Timeframe | Trades | Gross (0 fee) | Net (real) |
|---|---|---|---|
| 5분 | 6,494 | −60% | −100% |
| 15분 | 1,781 | −23% | −91% |
| 30분 | 841 | −15% | −69% |
| 1시간 | 421 | −33% | −60% |
| 2시간 | 206 | −19% | −37% |
| 4시간 | 105 | +29% | +14% |
| 6시간 | 68 | +11% | +2% |
| 12시간 | 36 | −18% | −22% |
| 1일 | 21 | −51% | −52% |
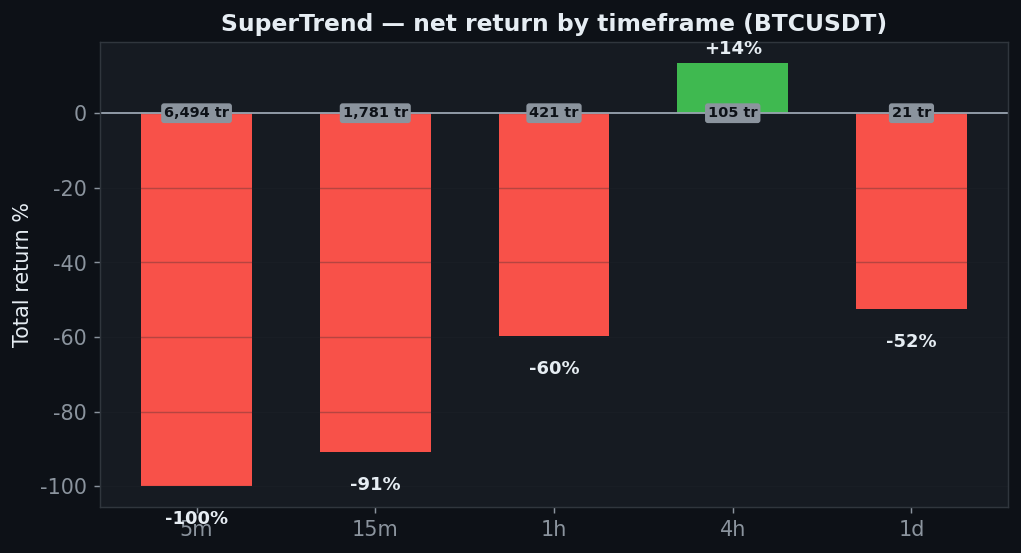
Only the 4H is positive (+14%), and only by a hair over buy & hold. The daily — where a trend stop should shine — loses 52%. That inversion (worse on the higher timeframe) is a red flag that this is noise, not a trend edge.
Axis 2 — ATR multiplier
| ATR multiplier | Net | PF |
|---|---|---|
| 1x | −44% | 1.03 |
| 2x | −10% | 1.09 |
| 3x | +14% | 1.19 |
| 4x | −27% | 0.95 |
| 5x | +30% | 1.37 |
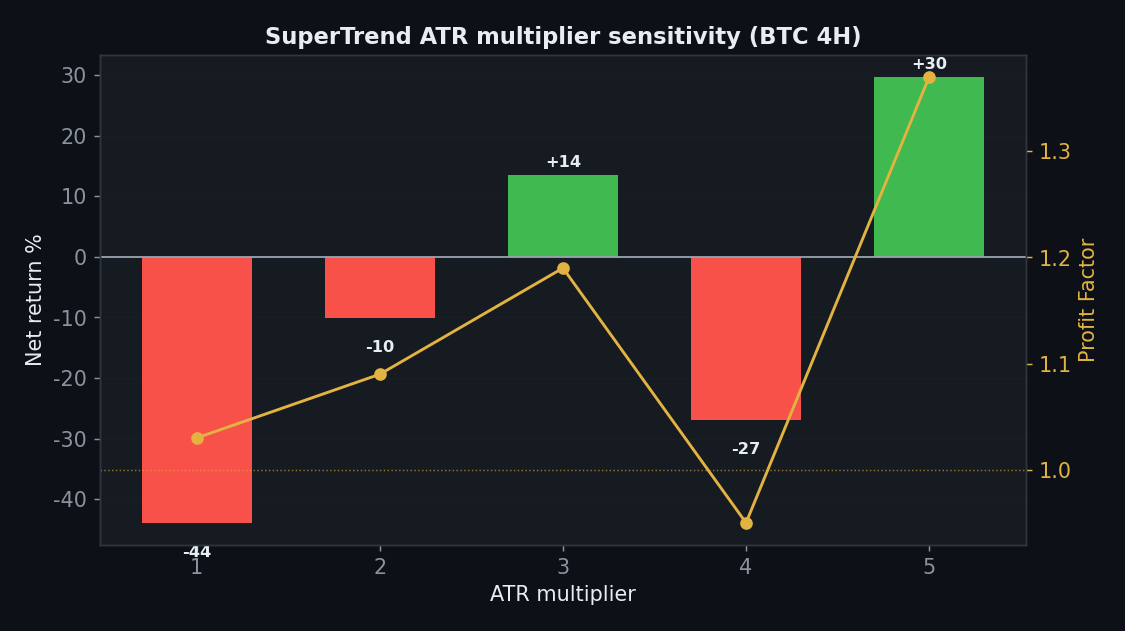
The multiplier sweep is non-monotonic: 3 and 5 are positive but 1, 2 and 4 lose. A real edge shows a plateau; this zig-zag (a loss sitting between two wins) is the signature of curve-fit luck.
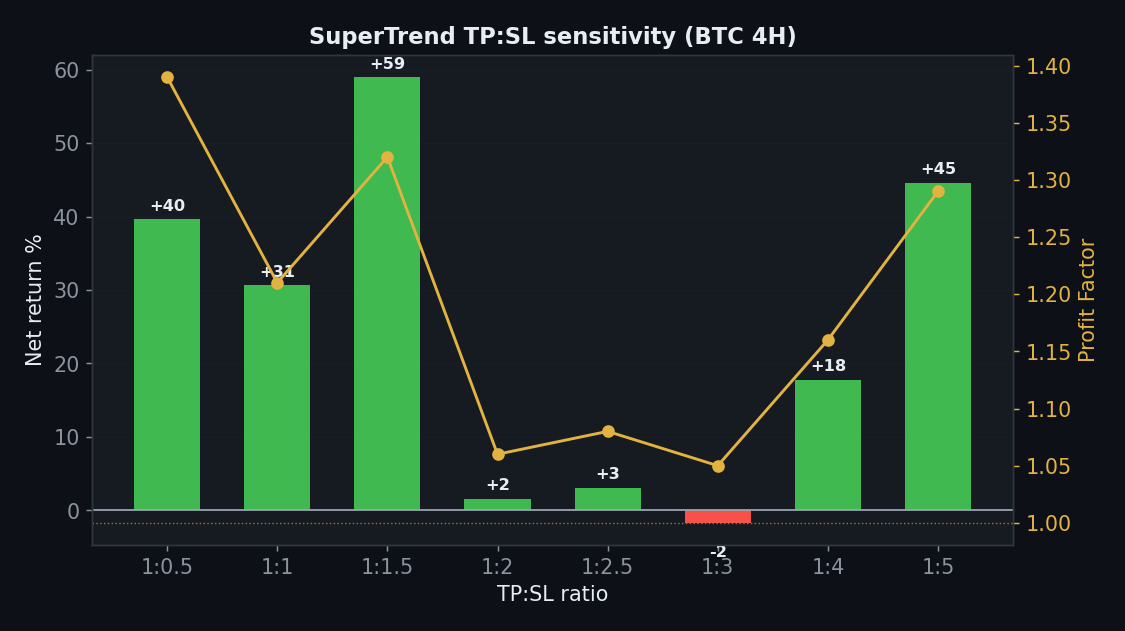
Axis 3 — TP:SL
| TP:SL | Net | PF |
|---|---|---|
| 1:0.5 | +40% | 1.39 |
| 1:1 | +31% | 1.21 |
| 1:1.5 | +59% | 1.32 |
| 1:2 | +2% | 1.06 |
| 1:2.5 | +3% | 1.08 |
| 1:3 | −2% | 1.05 |
| 1:4 | +18% | 1.16 |
| 1:5 | +45% | 1.29 |
The one bright spot: 7 of 8 take-profit ratios are positive. But bolting a good exit onto a base strategy that only ties buy & hold doesn’t create an edge — it just harvests mean-reversion the SuperTrend itself doesn’t capture.
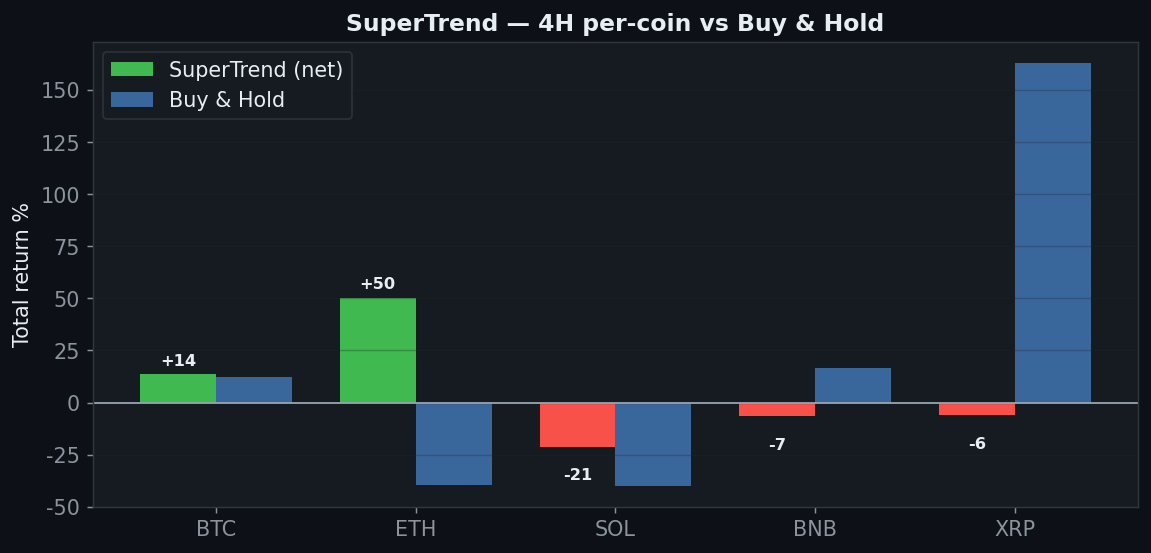
Axis 4 — Five Coins
| Coin | Strategy net | Buy & Hold |
|---|---|---|
| BTC | +14% | +12% |
| ETH | +50% | −40% |
| SOL | −21% | −40% |
| BNB | −7% | +17% |
| XRP | −6% | +163% |
Two of five coins positive (BTC +14%, ETH +50%), but SOL, BNB and XRP all lose — and XRP, which tripled, was completely missed (−6% vs +163%).
Axis 5 — Yearly
| Year | BTC 4H net |
|---|---|
| 2024 | +37% |
| 2025 | −8% |
| 2026 | −10% |
2024 carried it (+37%); 2025 (−8%) and 2026 (−10%) both lost. The ‘edge’ is one good year fading into two losing ones.
Axis 6 — Friction
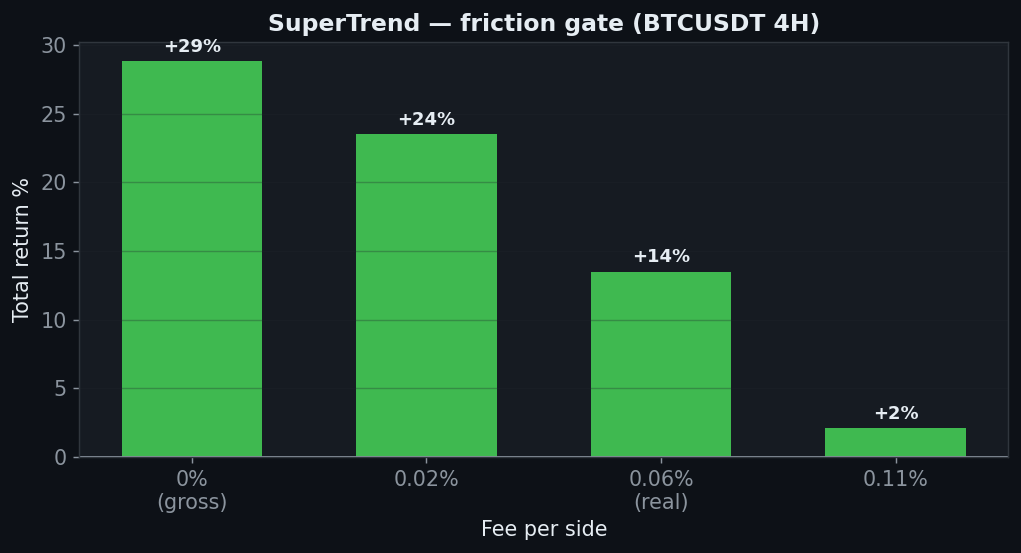
Low turnover (105 trades) means friction is gentle: +29% gross → +14% net → +2% at 0.11%. Costs aren’t the problem here — the lack of a real edge is.
The Verdict: REJECT
- Gate 0 — Indicator fidelity — pass (standard SuperTrend 10/3)
- Gate 1 — Sanity — pass
- Gate 2 — Friction — pass on 4H (survives to +14% net) — but that edge is trivially thin
- Gate 3 — Yearly — fail — +37 / −8 / −10, one good year then two losers
- Gate 4 — Robustness (multiplier) — fail — non-monotonic (3,5 win; 1,2,4 lose)
- Gate 5 — Robustness (TP:SL) — pass — 7 of 8 positive
- Gate 6 — Multi-market — fail — 2 of 5 coins, missed XRP’s +163%
- Gate 7 — vs Buy & Hold — fail — 4H +14% vs +12% is a tie; 1D loses badly
SuperTrend, the most-hyped indicator on crypto YouTube, ties buy & hold on the 4H (+14% vs +12%) and loses 52% on the daily. Its multiplier sweep zig-zags, it catches only 2 of 5 coins, and its one good year fades into two losing ones. The ATR trailing stop is a fine visual, but as a standalone long/short system it has no reliable edge. Reject.
FAQ
But it looks so accurate on the chart!
In hindsight, on the trending sections. The red/green paint updates with price, so your eye sees only the parts where it was right. Measured forward across all regimes, the 4H merely ties holding and the daily loses.
Isn’t SuperTrend better as a filter/trailing stop?
Possibly — as an exit or a regime filter combined with another entry it may add value. That’s a different tool than the standalone flip we tested, and would need its own six-gate run.
Can I replicate this?
Yes — SuperTrend(10, 3), public Binance data, 0.06%/side, five coins, nine timeframes. Every table reproduces.
See also the rejects Keltner, Donchian and Parabolic SAR, and the conditional Vortex.
Disclaimer: educational research, not financial advice. Past performance does not guarantee future results. Never trade money you cannot afford to lose.
Leave a Reply