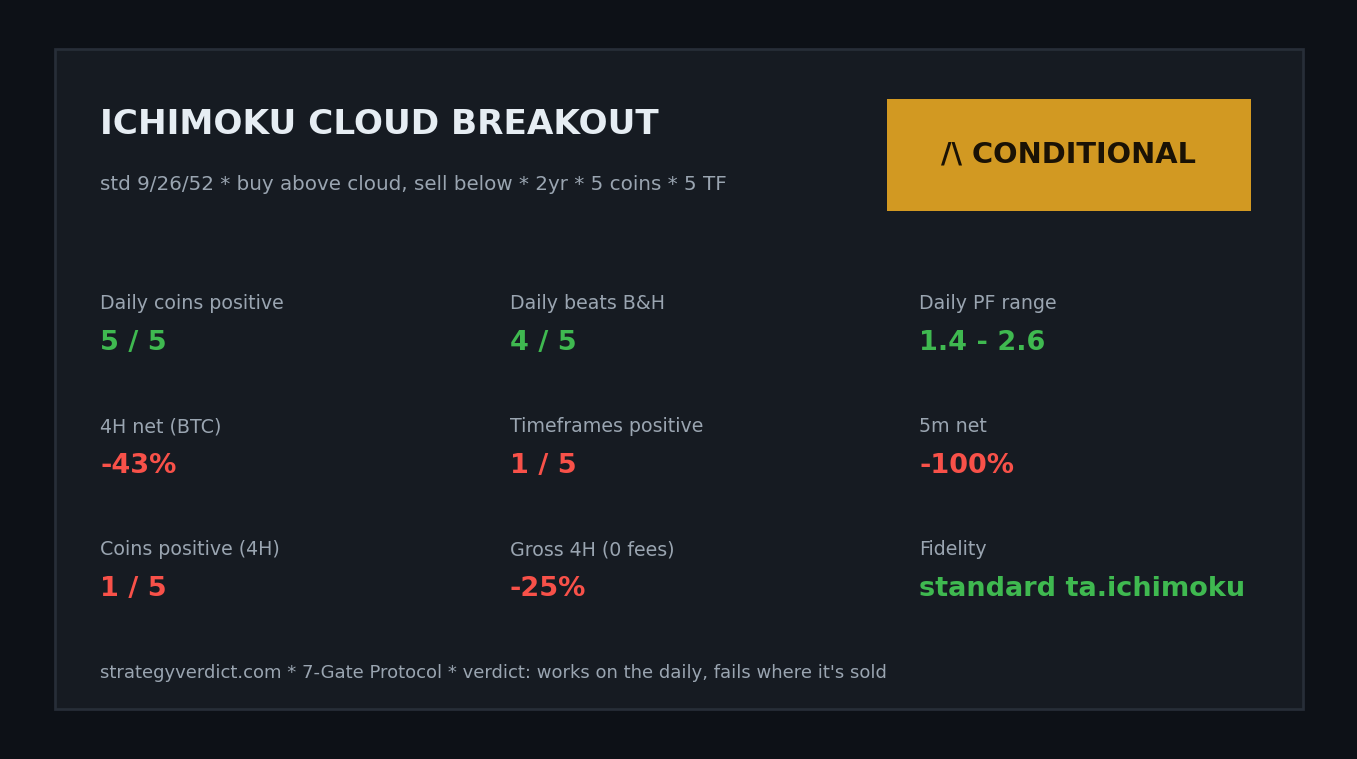
Ichimoku Kinko Hyo — “one glance equilibrium chart” — is the indicator that looks like a weather map and scares beginners away. Clouds, five lines, a signal from the future and one from the past. The most-taught, most-mechanical piece of it is the cloud breakout: go long when price closes above the cloud, short when it closes below. The claims swing wildly, from “70–75% win rate with full alignment” to one study’s brutal “10% win rate across 15,000 trades.” We ran the plain cloud breakout through the 7-Gate Protocol — and it earned something rare on this site: a conditional pass. Only our second, after VWAP. Because this one, unlike the last three, actually works — just not where it’s sold.
Gate 00 — Fidelity
Standard Ichimoku: Tenkan 9, Kijun 26, Senkou B 52, cloud displaced 26 forward — identical to TradingView’s built-in. Crucially, we use the no-look-ahead cloud: the cloud sitting under today’s price was projected 26 bars ago, so the signal only ever uses information that existed at the time.
The Exact Rules
- Signal: close above the cloud (top of Senkou A/B) → long; close below the cloud → short; inside the cloud → flat
- Settings: 9 / 26 / 52, displacement 26 (the universal default)
- Execution: on the bar close, no look-ahead; costs 0.06%/side; data Binance spot Jul 2024–Jul 2026, BTC/ETH/SOL/BNB/XRP, 5m–1D; benchmark buy & hold
Where it genuinely works: the daily
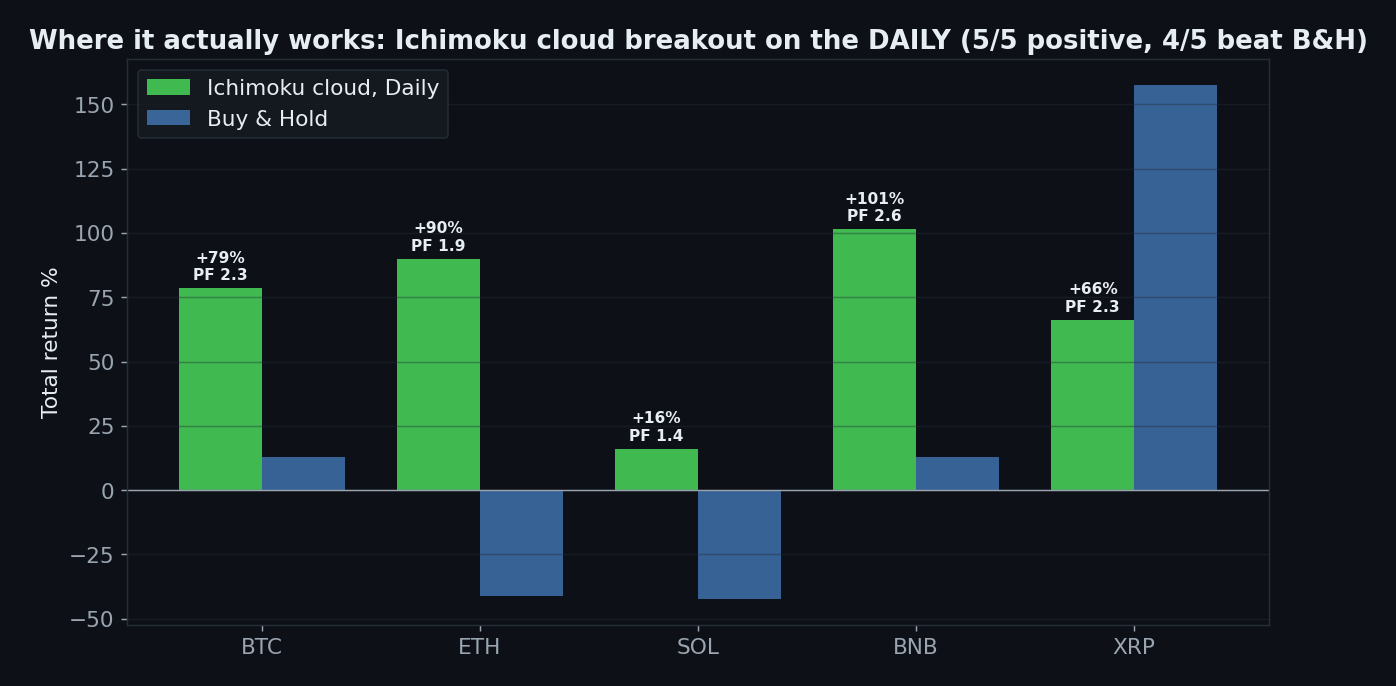
On the daily timeframe the cloud breakout is profitable on all five coins — BTC +79%, ETH +90%, SOL +16%, BNB +102%, XRP +66% — with profit factors of 1.4 to 2.6, and it beats buy & hold on four of the five. This is not an artifact: it’s a real, generalizable trend-following edge. Note how it shines on ETH and SOL, where buy & hold lost 40%+: the short side caught the alt bear market. That is exactly what a trend system is supposed to do.
Why it works: it’s an honest trend-follower
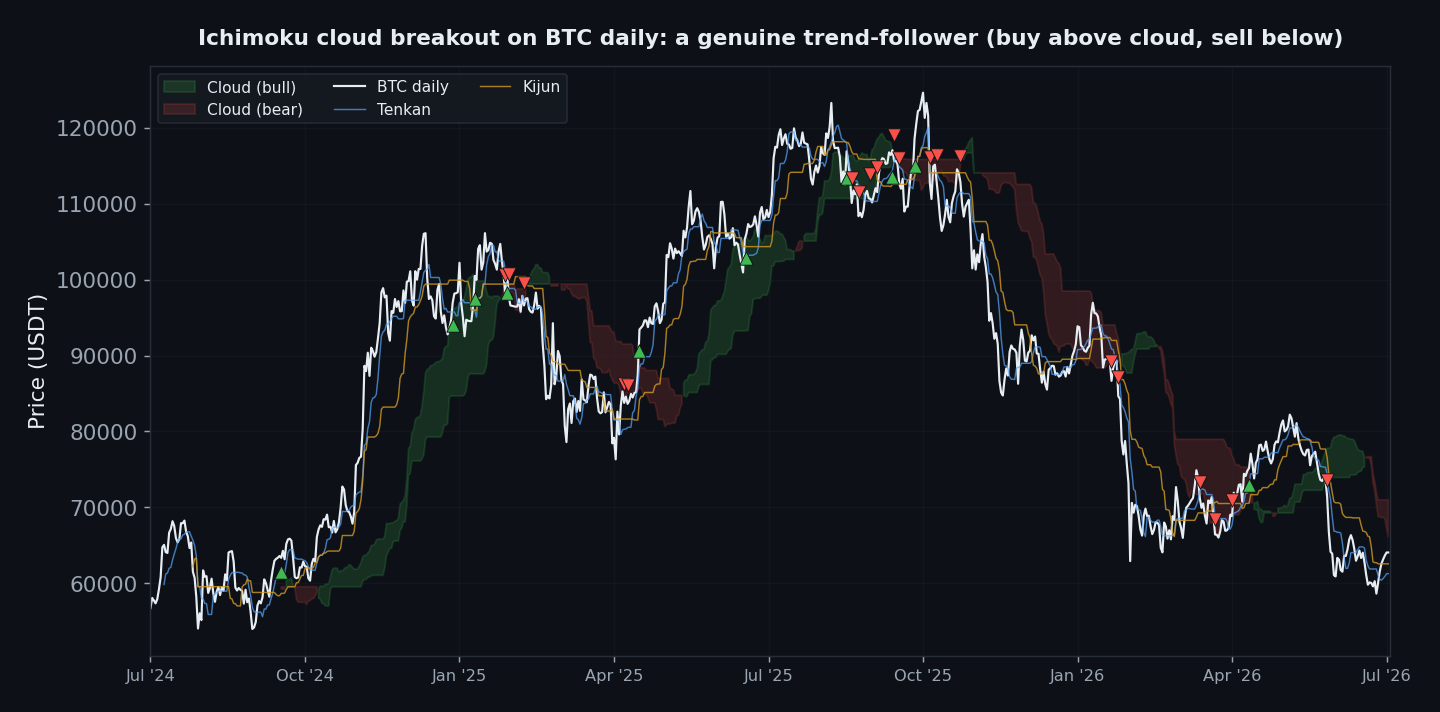
There’s no mysticism here. Long above the cloud, short below it — the strategy simply rides established trends and flips when the regime changes. It buys the 2024 breakout, holds the run to 125k, and shorts the 2025–26 decline. The win rate is low (~28%), which surprises people, but the payoff ratio is high: a few big trends pay for many small stop-outs. That is the correct shape for trend-following — the opposite of the high-win-rate mean-reversion traps like Bollinger reversion and RSI.
The catch: every timeframe it’s actually sold on
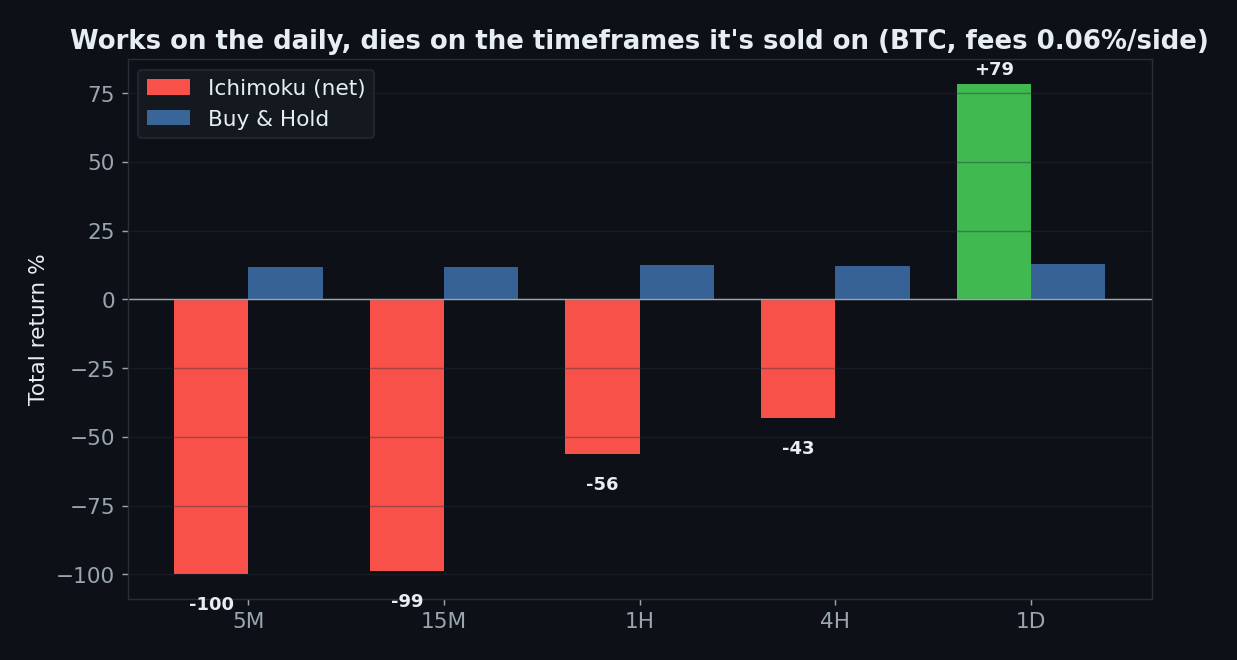
Here’s why it’s conditional and not a clean pass. Drop below the daily and the edge inverts: 4H −43%, 1h −56%, 15m −99%, and on the 5-minute “cloud scalping” setup the videos love, −100% — the account is gone. The cloud is a slow, smoothed structure; on fast charts price chops across it constantly, and fees plus whipsaw shred you. The strategy works precisely where nobody makes hype videos (patient daily swing trading) and detonates precisely where everybody does.
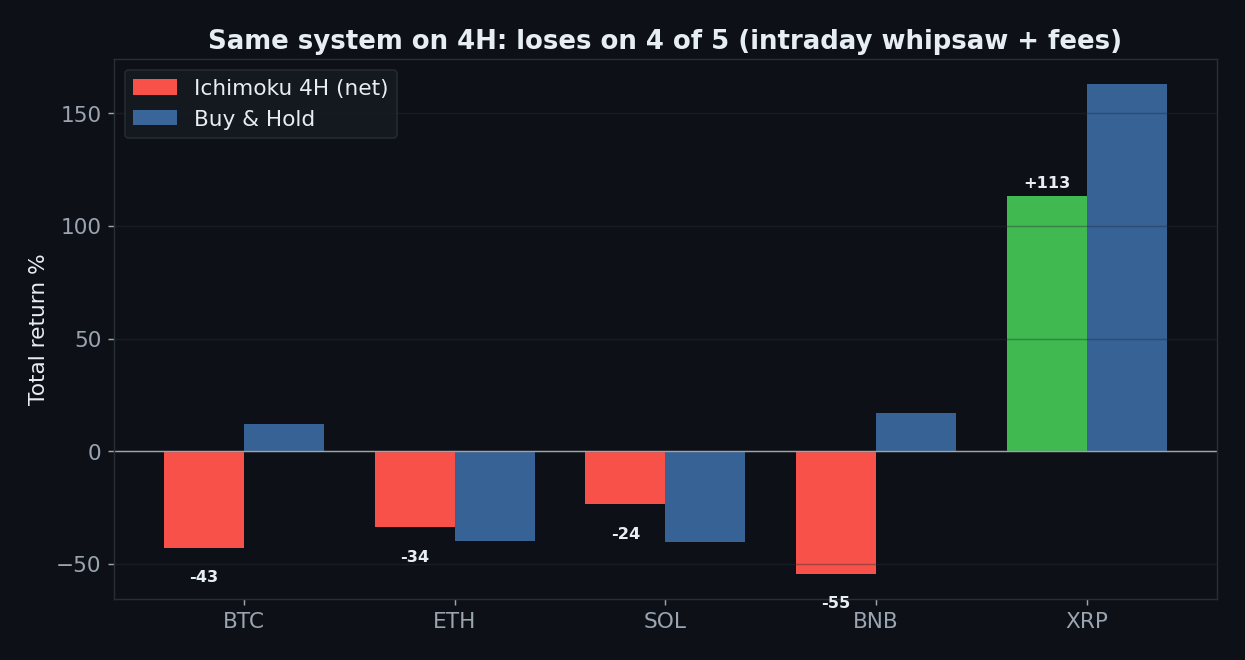
On 4H it loses on 4 of 5 coins. And the friction test confirms the intraday version has no real edge to begin with:
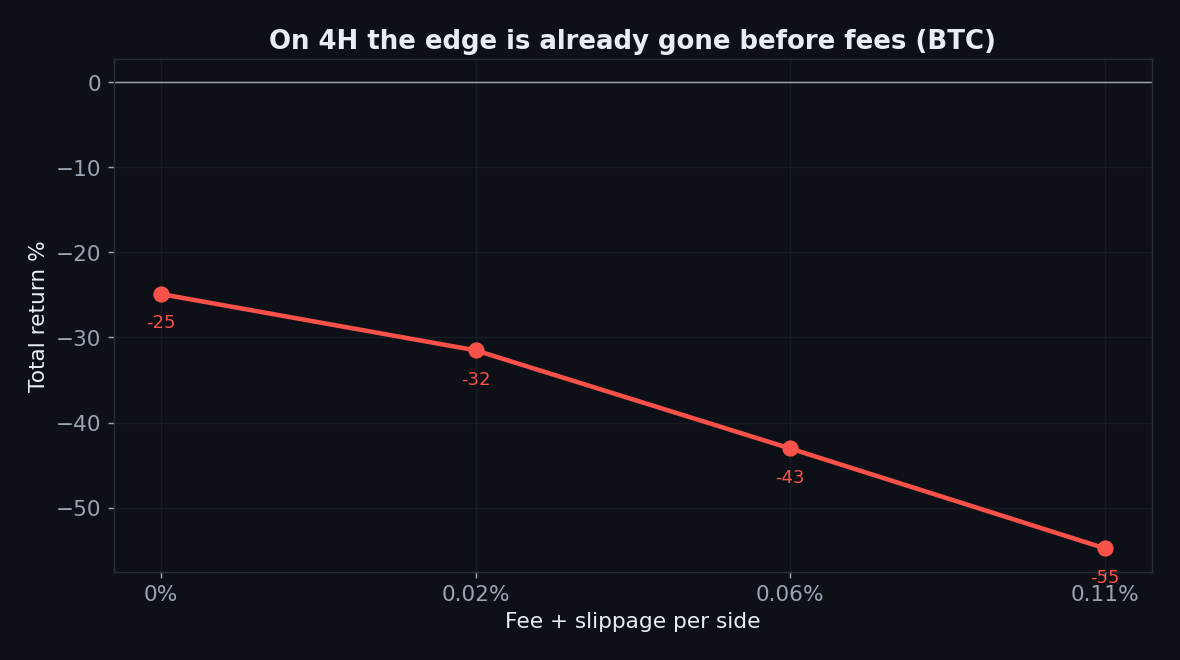
−25% on BTC 4H even at zero fees. The daily edge simply does not exist on the 4-hour chart, at any cost level.
The Verdict: CONDITIONAL
- Gate 0 — Indicator fidelity — pass (standard 9/26/52 Ichimoku with a no-look-ahead cloud)
- Gate 1 — Sanity — pass (signal on the closed bar, no look-ahead)
- Gate 2 — Friction — fail intraday / pass daily (5m → −100%; on the daily its few trades survive fees easily)
- Gate 3 — Yearly consistency — conditional (on the daily it captures multi-year trends in both directions; on 4H it loses)
- Gate 4 — Out-of-sample — partial (4H out-of-sample is 3/5 positive — the least-bad intraday result on this site)
- Gate 5 — Robustness — fail on 4H (0 of 12 Tenkan × Kijun sweep cells positive intraday)
- Gate 6 — Multi-market — pass on daily (5/5 coins) / fail on 4H (1/5)
- Gate 7 — vs Buy & Hold — pass on daily (beats on 4/5 coins) / fail intraday
Ichimoku’s cloud breakout is a legitimate trend-following system — on the daily. There it is profitable on every coin we tested, beats buy & hold on four of five, and behaves exactly like a trend-follower should (low win rate, high payoff). But it is marketed as an intraday “cloud scalping” tool, and on the 5-minute to 4-hour charts it ranges from a slow bleed to a full account wipe. The indicator isn’t the problem; the timeframe the internet sells it on is. Use it on the daily as a swing/trend framework, expect ~28% win rate and 25–40% drawdowns, and never take it down to the scalping charts.
FAQ
A 28% win rate — isn’t that terrible?
For mean reversion, yes. For trend-following, it’s normal and fine: you lose small often and win big rarely. Judge a trend system by profit factor and return, not win rate — the exact opposite of how you’d judge Bollinger reversion.
Why does it die on 5-minute charts?
The cloud is a heavily smoothed, lagging structure. On fast timeframes price crosses it dozens of times a day with no follow-through, so you pay fees and whipsaw on hundreds of fake breakouts. Trend tools need room to trend.
Would the full alignment (TK cross + Chikou + future cloud) do better?
On 4H, the TK-cross and full-alignment variants were also negative (−9% and −18%). Adding conditions didn’t rescue the intraday version; the timeframe is the deciding variable, not the filter stack.
Can I replicate this?
Yes — standard 9/26/52 Ichimoku, public Binance data, 0.06%/side. Daily cloud breakout, five coins.
See also our one other conditional pass, VWAP trend-pullback, and the rejects: UT Bot, Lorentzian, Bollinger reversion.
Disclaimer: educational research, not financial advice. Past performance does not guarantee future results. Never trade money you cannot afford to lose.
Leave a Reply