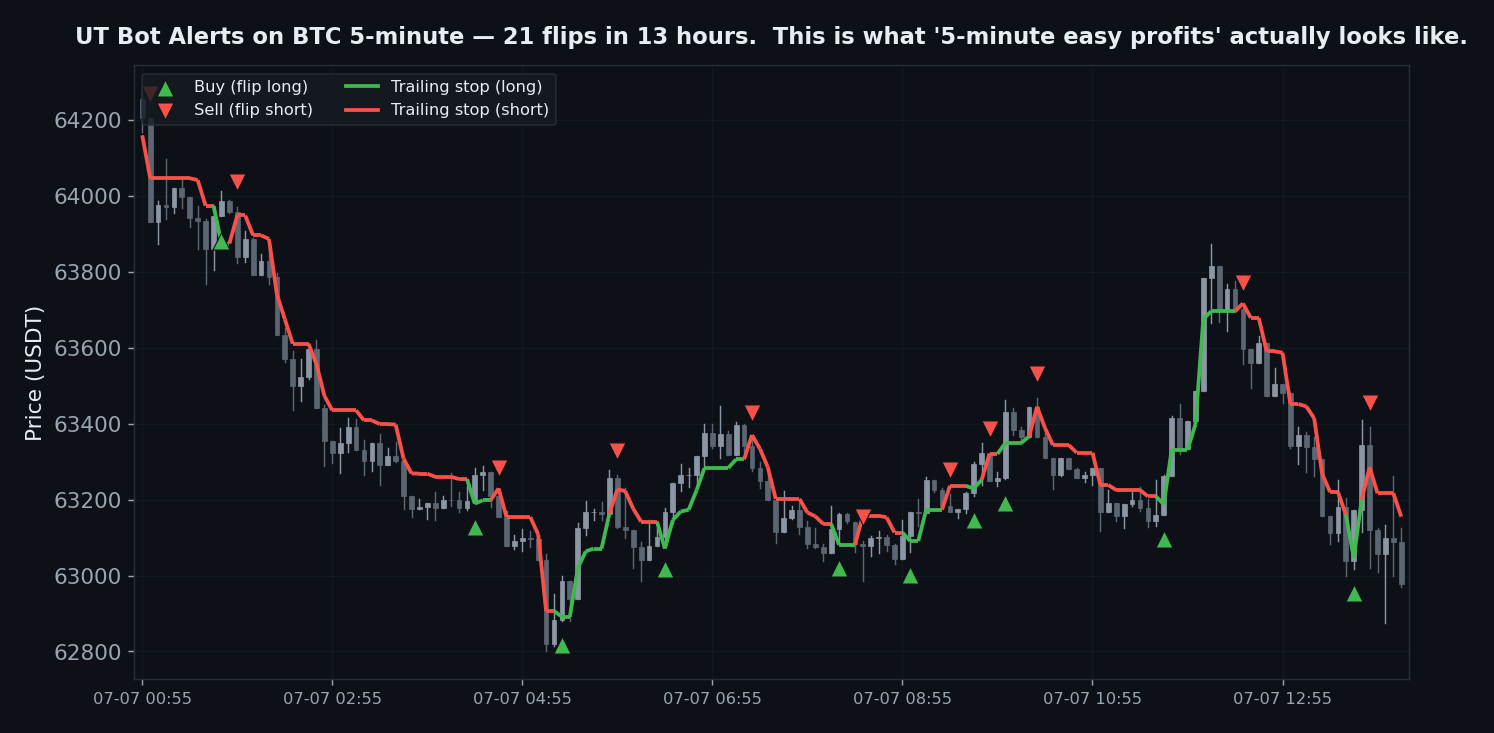
UT Bot Alerts is one of the most-screenshotted indicators on trading YouTube. “UT Bot makes crazy profits.” “The only indicator you need.” “5-minute easy money.” It is an ATR trailing-stop that paints a green “Buy” when price crosses above the stop and a red “Sell” when it crosses below — a clean, hypnotic flip-flop that looks unbeatable in a cherry-picked clip.
We ran it through the full 7-Gate Protocol: 2 years of Binance data, 5 liquid coins, 5 timeframes from 5-minute to daily, a parameter sweep, an out-of-sample split, and two popular variants (Heikin-Ashi, EMA-200 filter). The verdict is reject — but the reason is genuinely interesting, and this time we begin by doing something most “backtest” videos never do: proving our indicator is bit-for-bit the real one.
Gate 00 — First, we proved the indicator is real
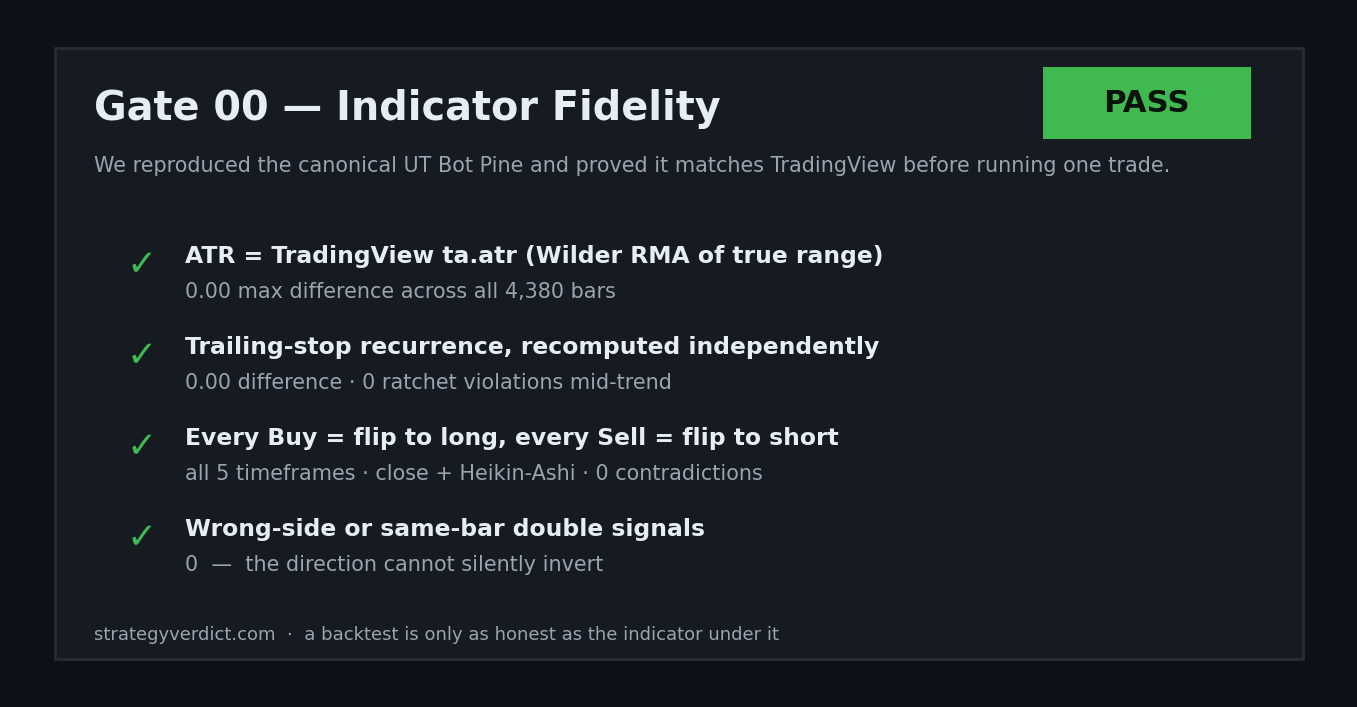
A backtest is worthless if the indicator underneath it doesn’t match what you actually see on TradingView. A single flipped comparison and your “short” becomes a “long” — the numbers look real but describe a strategy nobody trades. So before judging UT Bot, we reimplemented the canonical UT Bot Alerts Pine Script line-for-line and verified it three independent ways:
- ATR match: our ATR equals TradingView’s
ta.atr(Wilder RMA of true range) to 0.00 over all 4,380 bars — not “close”, identical. - Trailing-stop recurrence: the stop, recomputed by a second independent method, matches the engine to 0.00; and the stop never loosens mid-trend (0 ratchet violations) — the defining property of UT Bot.
- No silent long/short inversion: across every timeframe and both close and Heikin-Ashi modes, every Buy coincides exactly with a flip to long and every Sell with a flip to short — zero same-bar contradictions, zero “wrong-side” signals. The direction is structurally incapable of inverting.
Only after that check did we let it trade. Every number below rests on an indicator we can prove is the real thing.
The Exact Rules
- Indicator: UT Bot Alerts, default Key Value = 1, ATR Period = 10, source = close
- Signal: price crosses above the ATR trailing stop → go long; crosses below → go short. It is always in the market (stop-and-reverse)
- Execution: signal on the bar close, enter at that close — no look-ahead
- Costs: 0.06% per side (fees + slippage), on every entry and exit
- Data: Binance spot, Jul 2024 – Jul 2026, BTC/ETH/SOL/BNB/XRP, 5m–1D
- Benchmark: buy & hold over the identical window
Gate 06a — Every Timeframe (the whole story)
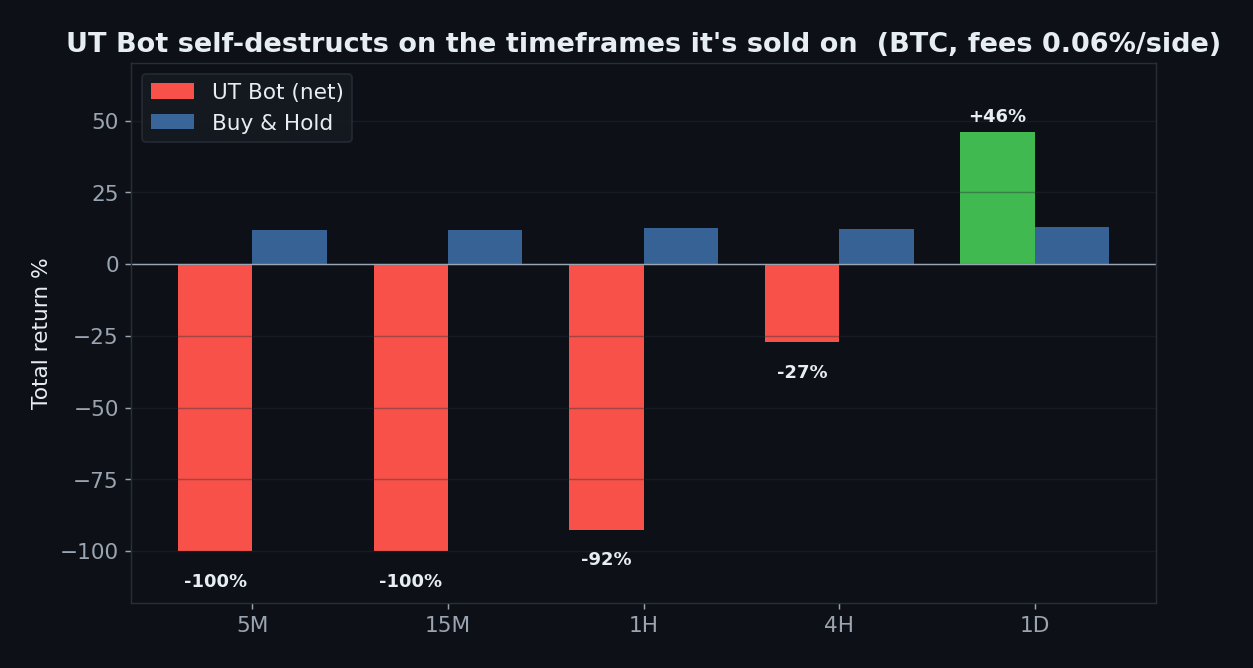
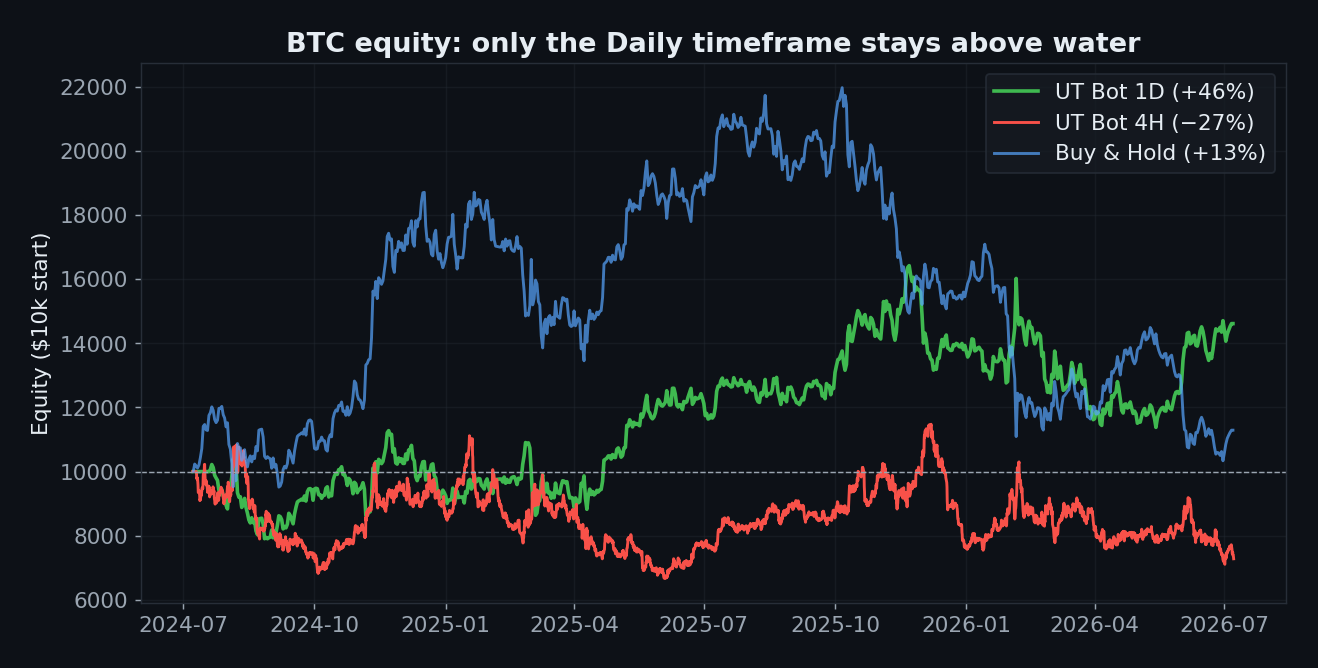
Here is the punchline in one chart. UT Bot is sold on low timeframes — the “5-minute easy profits” clips — and that is precisely where it detonates. On BTC 5-minute bars it takes 31,242 trades and returns −100%: the account is gone. 15m: −100%. 1H: −92%. 4H: −27%. The only timeframe that stays alive is the daily (+46%, 76 trades) — the one timeframe nobody makes hype videos about. The pattern is monotonic: the faster you trade this thing, the faster it kills you.
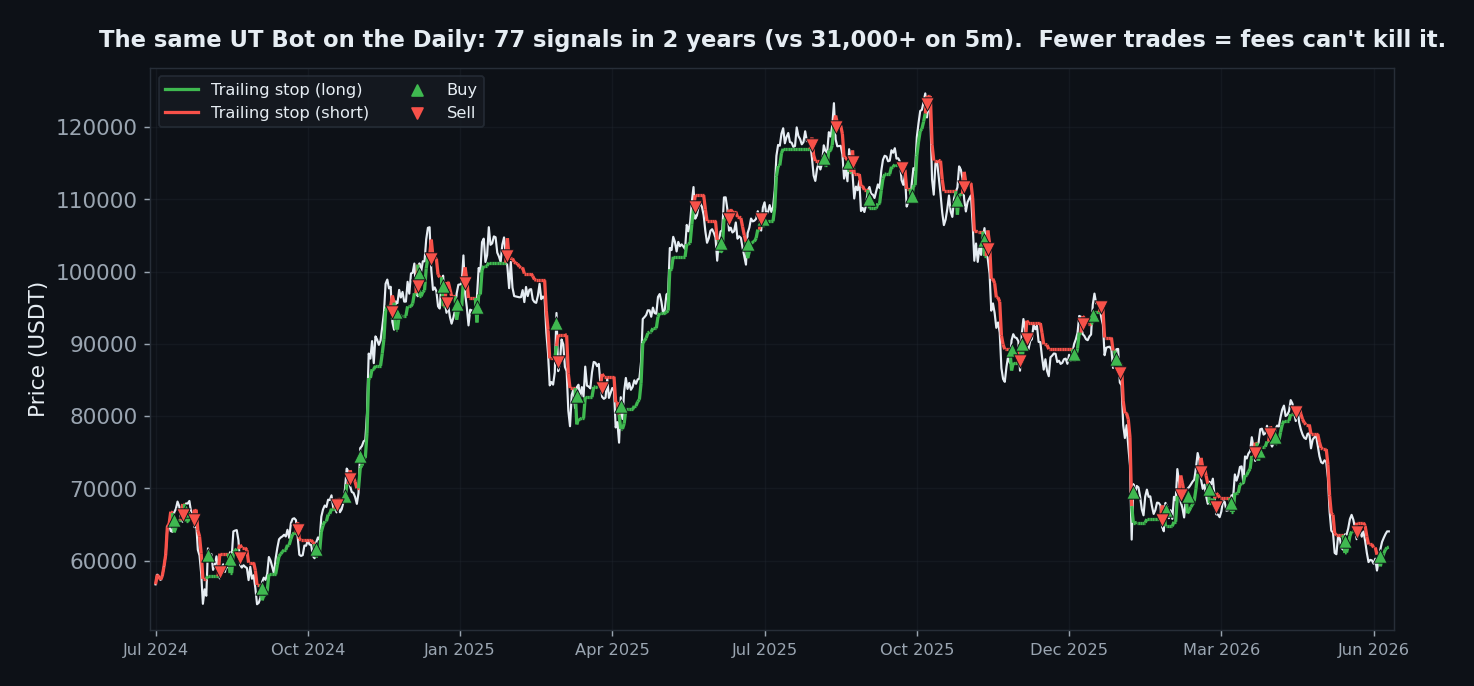
The same indicator, same rules, on the daily — about 77 signals in two years instead of tens of thousands. That, and nothing cleverer, is why the daily survives fees while every intraday chart does not.
Gate 02 — Friction (why it dies)
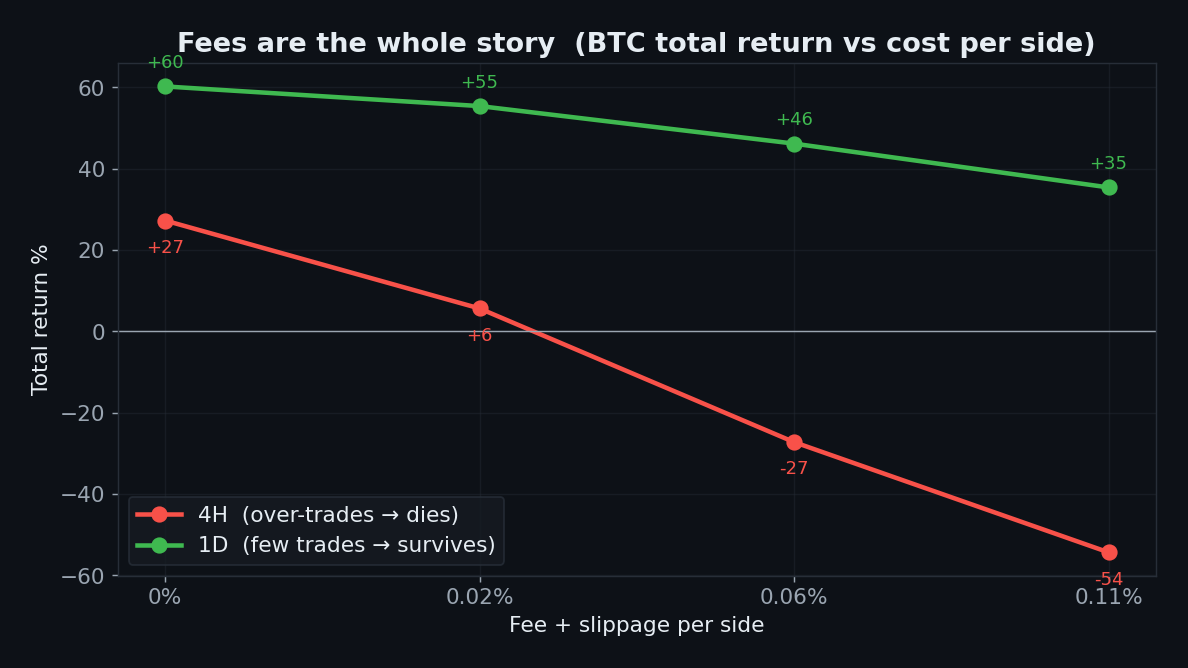
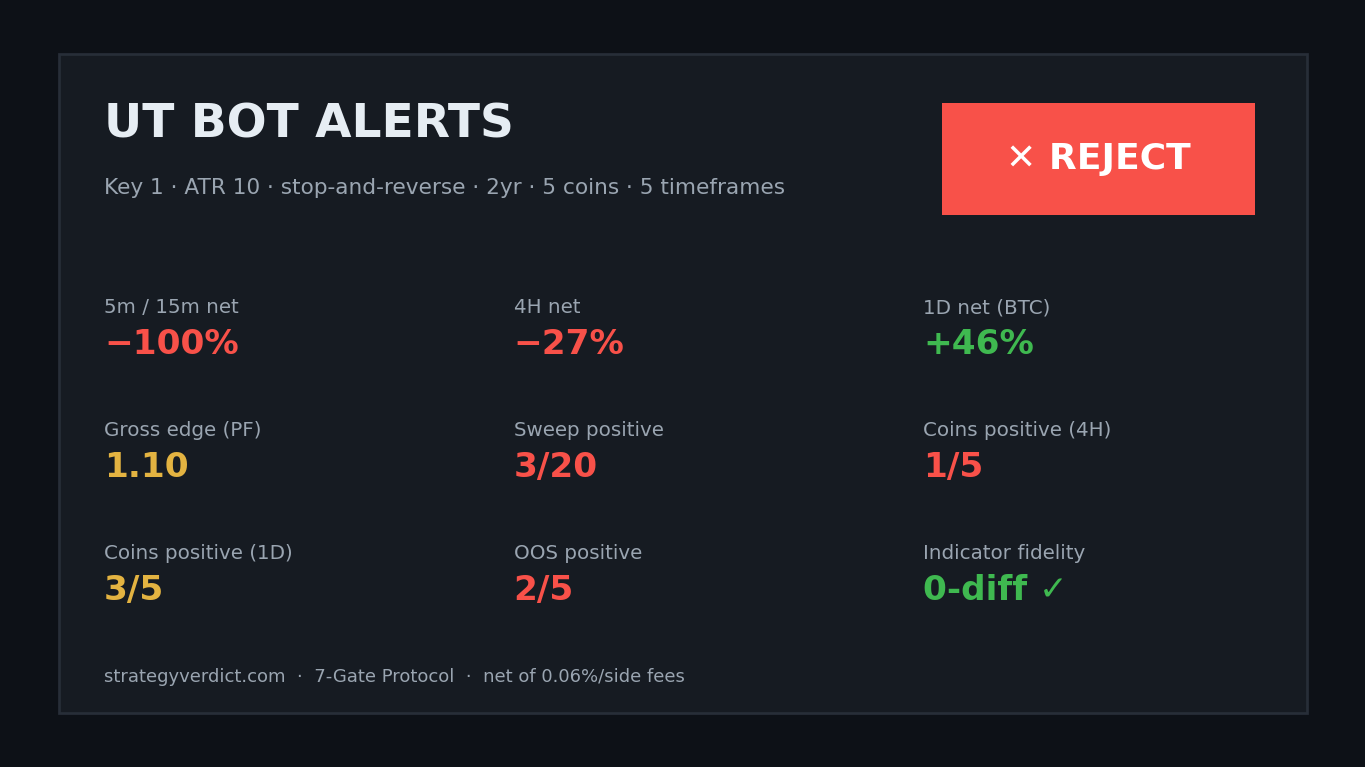
The mechanism is not mysterious. UT Bot’s gross edge is razor-thin — a profit factor of just 1.10 on 4H. With zero fees the 4H strategy makes +27%; at a realistic 0.06% per side it flips to −27%; at 0.11% it’s −54%. The entire “edge” is smaller than the transaction cost of harvesting it. The daily timeframe survives for one reason only: it trades ~75 times instead of 31,000, so friction barely touches it.
Gate 03 — Yearly Consistency
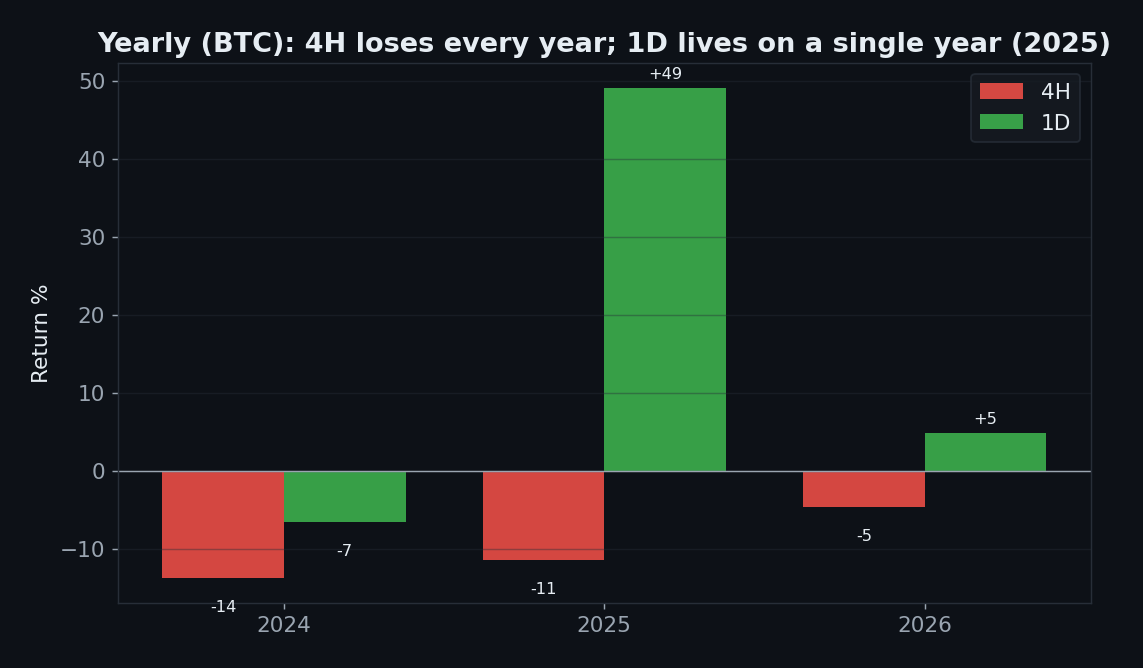
On 4H, UT Bot loses money every single year (−14%, −11%, −5%). The daily’s headline +46% is not steady income either — it lives almost entirely in 2025 (+49%), with 2024 slightly negative and 2026 flat. One good year is not an edge; it’s a sample of one.
Gate 06b — Five Coins
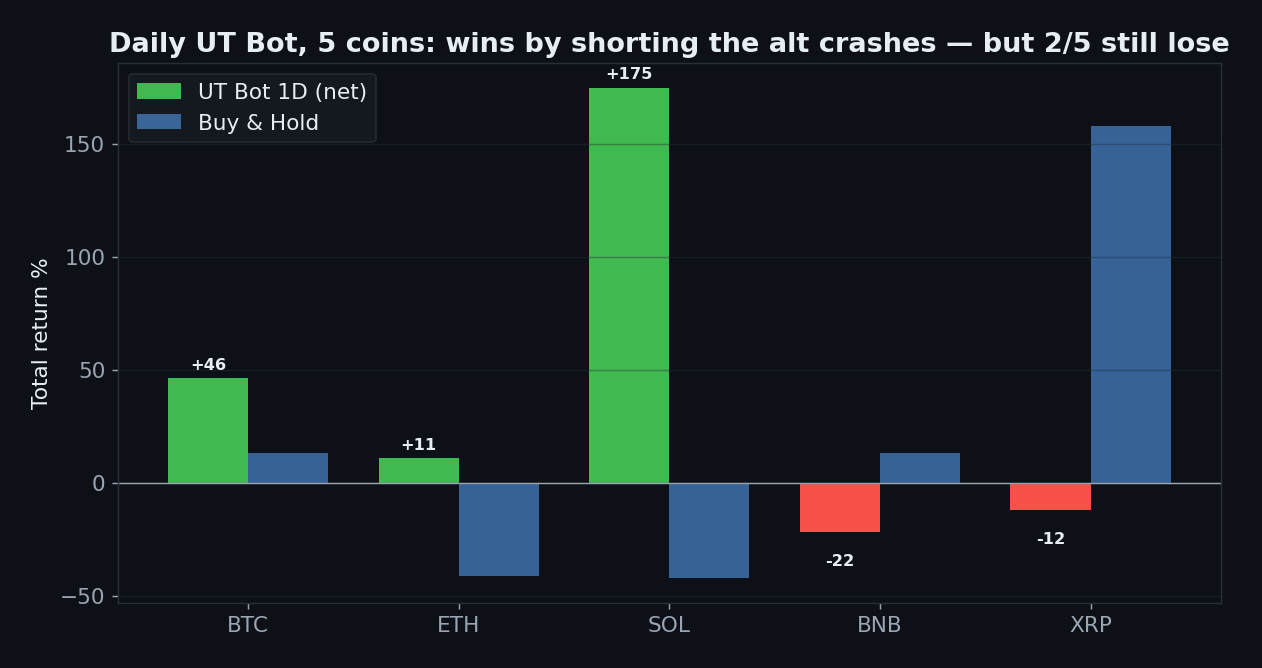
On 4H, only 1 of 5 coins is profitable. On the daily it looks better — 3 of 5 positive and all three beat buy & hold — but read how:
| Coin (1D) | UT Bot | Buy & Hold | Why |
|---|---|---|---|
| BTC | +46% | +13% | beat B&H in an up market |
| ETH | +11% | −41% | profited by shorting the crash |
| SOL | +175% | −42% | profited by shorting the crash |
| BNB | −22% | +13% | whipsawed, lost |
| XRP | −12% | +158% | missed the rally, lost |
The daily wins come from UT Bot’s short side catching the 2024–25 altcoin bear — something any long/short trend-follower would have done. It is not a UT-Bot-specific edge; it’s generic trend exposure, and it still failed on 2 of 5 coins with drawdowns of 50–80%.
Gate 04 — Out-of-Sample
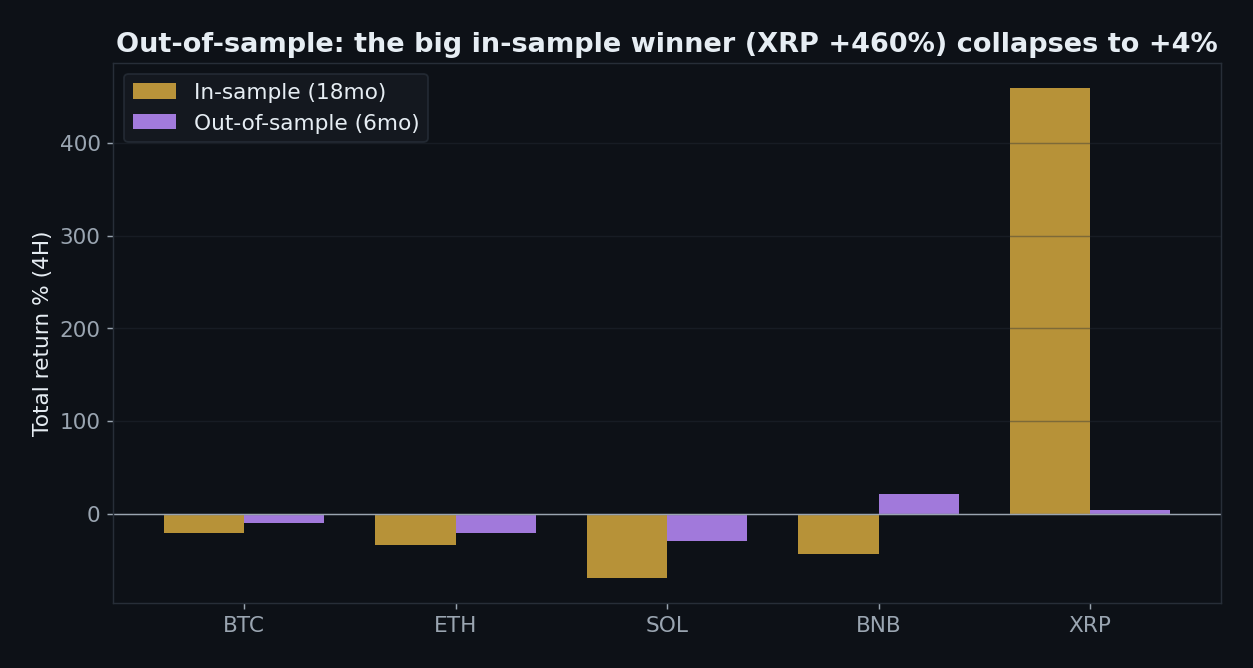
Split each coin 18 months in-sample / 6 months out. The tell is XRP: a monstrous +460% in-sample collapses to +4% out-of-sample — the signature of a curve that fit noise. Only 2 of 5 coins are positive out-of-sample. Whatever looked like an edge does not survive contact with unseen data.
Gate 05 — Parameter Robustness
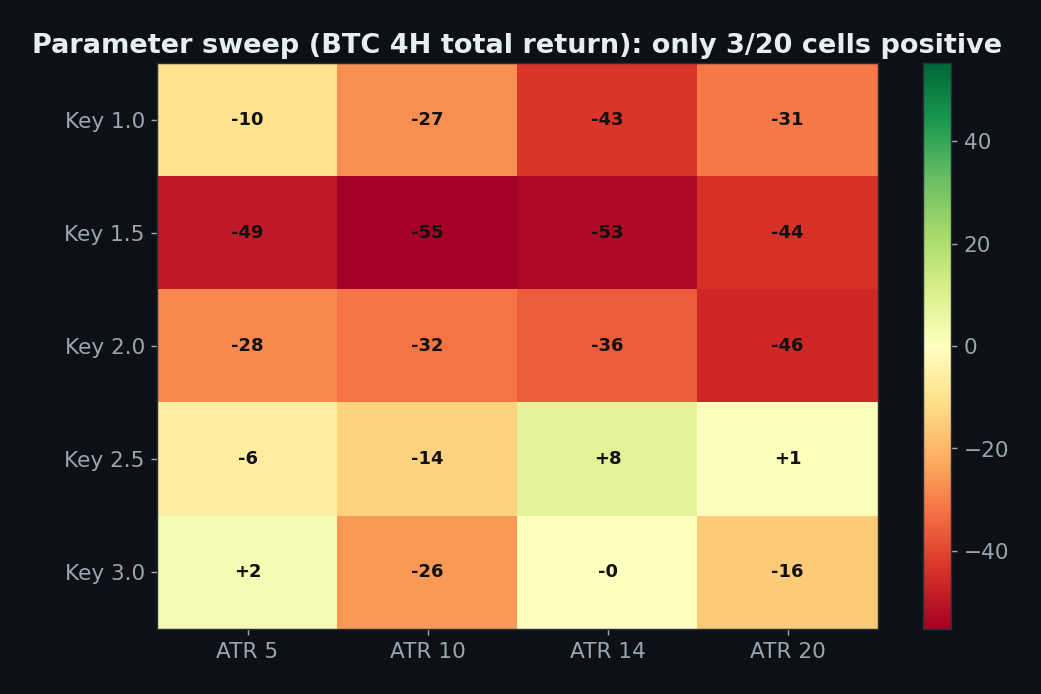
We swept Key Value (1–3) against ATR Period (5–20) on BTC 4H: only 3 of 20 combinations are positive, and the profitable islands are scattered, not clustered. A real edge is robust to its own knobs; UT Bot’s result is a coin toss over the parameter grid.
Do the popular variants save it?
No. On BTC 4H: Heikin-Ashi source makes it worse (−48% vs the base −27%). An EMA-200 regime filter — only longing above the 200-EMA, shorting below — helps but stays negative (−17%). The combination is −30%. None of the “just add this one thing” fixes crosses zero.
Monte Carlo — Is the Daily’s +46% Just Luck?
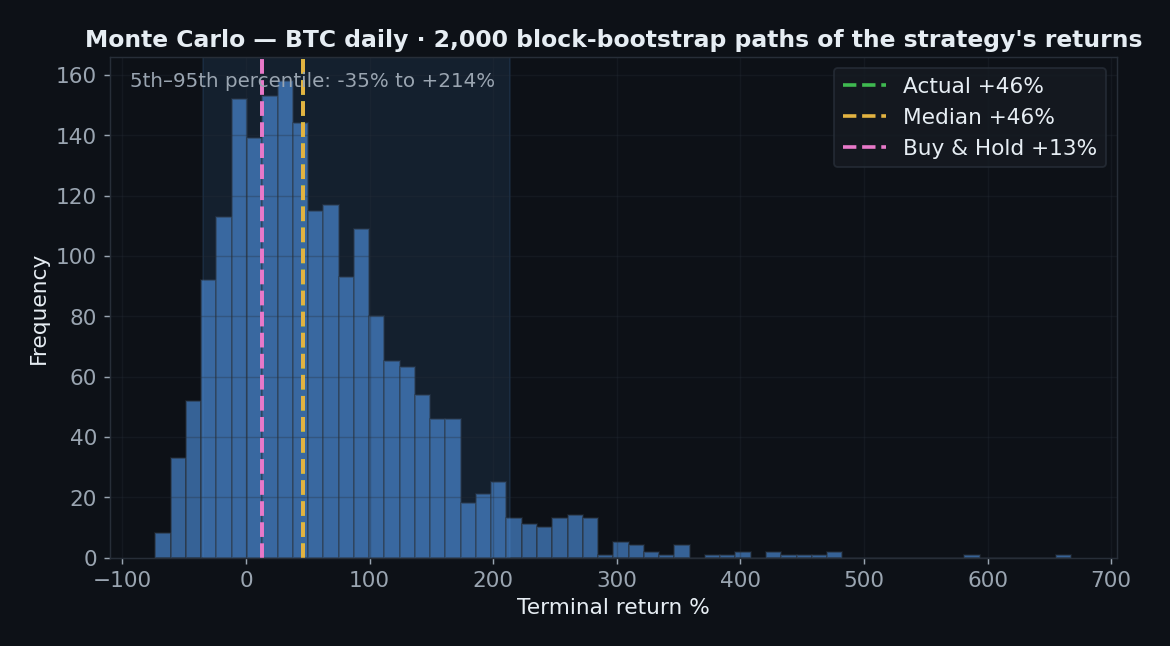
We resampled the daily strategy’s returns into 2,000 block-bootstrap paths. Here the daily earns a little credit: the median path is +46% — the real result sits right on the median, not out on a lucky tail — and 71% of paths beat buy & hold. But the 5th–95th percentile band runs from −35% to +214%: even on its one survivable timeframe, UT Bot carries a real chance of a deep loss, and the fat right tail shows a handful of big trend trades doing most of the work. Dependable edges have tight distributions; this one does not.
The Verdict: REJECT
- Gate 0 — Indicator fidelity — pass (ATR and trailing stop match TradingView to 0.00; every Buy is a flip to long and every Sell a flip to short — the direction cannot invert)
- Gate 1 — Sanity — pass (signal on the closed bar, entry at that close, no look-ahead)
- Gate 2 — Friction — fail (+27% gross → −27% net on 4H; 5m and 15m go to −100%)
- Gate 3 — Yearly consistency — fail (4H loses money every year; the daily’s +46% is almost entirely 2025)
- Gate 4 — Out-of-sample — fail (2/5 positive; XRP +460% in-sample collapses to +4% out)
- Gate 5 — Robustness — fail (only 3 of 20 key-value × ATR cells positive)
- Gate 6 — Multi-market — fail (4H 1/5 coins; daily 3/5, and only via generic short exposure)
- Gate 7 — vs Buy & Hold — mixed (beats it only on the daily, and only on 3 of 5 coins)
UT Bot Alerts is marketed on exactly the timeframes where its constant flipping self-destructs on fees. Move it up to the daily and it stops bleeding — but that is the opposite of the “5-minute easy profits” pitch, and even there it’s a 3-of-5 coin toss with 30–80% drawdowns that mostly just shorted a bear market. The ATR trailing stop is a legitimate concept; UT Bot as sold is not a strategy.
FAQ
The videos show huge wins — are they lying?
Usually they show gross returns (no fees) on a single lucky window and timeframe. Add real costs and test it out-of-sample on multiple coins and the picture inverts. That gap is the entire business model of hype channels.
What about the Heikin-Ashi version everyone raves about?
We tested it. On BTC 4H it was worse than the standard version (−48%). Smoother candles delay the flips but don’t create an edge.
So the daily “+46%” means it works?
On one coin, in one year, with a 31% drawdown and a tiny 76-trade sample. On the other four coins the daily is 2 losses and two wins that are really just “short the crash.” That is not a dependable edge.
Can I replicate this?
Yes — the rules above are complete, the data is public Binance OHLCV, fees 0.06%/side. We even proved the indicator matches TradingView to the decimal before running a single trade.
See also: Triple SuperTrend (also −100% on 5m), the Golden Cross (loses to holding on all 5 coins), RSI 30/70 (died at gate 2), and VWAP pullback (our first conditional pass).
Disclaimer: educational research, not financial advice. Past performance does not guarantee future results. Never trade money you cannot afford to lose.
Leave a Reply