The Parabolic SAR — those little dots that flip above and below price — is one of Welles Wilder’s original 1978 inventions. Here is the detail almost every tutorial skips: Wilder built it as a trailing stop, a “stop and reverse” tool to protect and exit an existing position. Somewhere along the way retail turned it into an entry signal: go long when the dots flip below, short when they flip above. Does a trailing stop make a good entry trigger? We ran the standard SAR (0.02 step, 0.20 max) through the 7-Gate Protocol. Verdict: reject — though it fails more honestly than most.
Gate 0 — Fidelity
Standard Wilder SAR: acceleration factor starts at 0.02, steps up 0.02 each time a new extreme prints, capped at 0.20. When price crosses the SAR, it flips and reverses. This is the exact recurrence from Wilder’s book, reproduced bar by bar.
The Exact Rules
- Signal: price closes across the SAR → flip. Above SAR = long, below = short (stop-and-reverse, always in the market)
- Settings: 0.02 / 0.02 / 0.20 (the universal default)
- Execution: on the bar close, no look-ahead; 0.06%/side; Binance spot Jul 2024–Jul 2026; BTC/ETH/SOL/BNB/XRP; 5m–1D; benchmark buy & hold
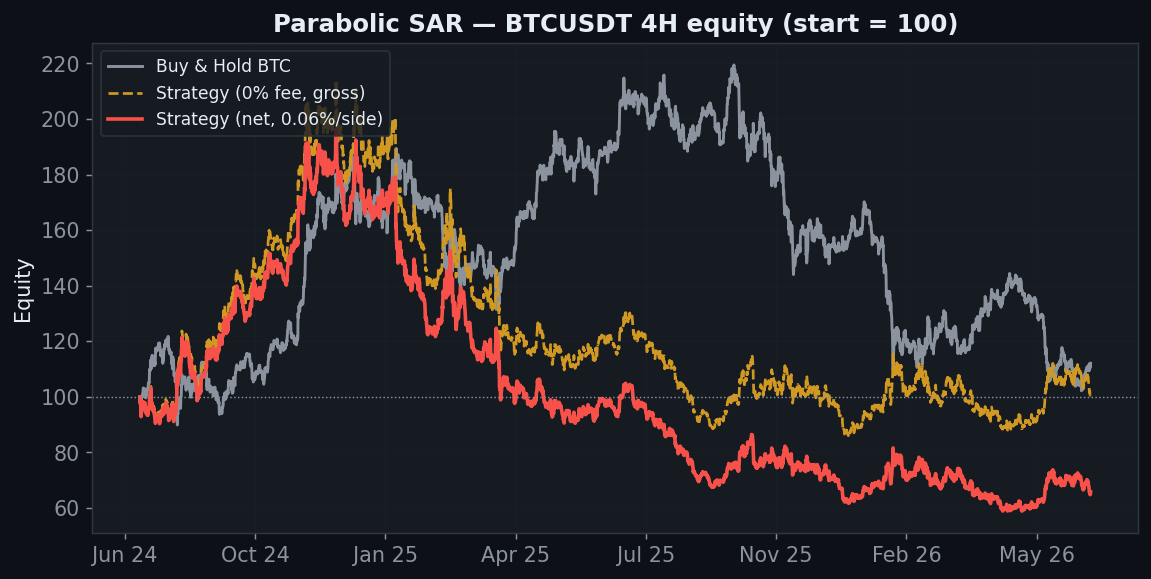
BTC 4H settles at −34%. As with the other flippers, the gross line clears zero (+2%) and the net line sinks — but the gap here is narrower, and that hint matters: SAR is doing something real when a trend actually exists.
Gate 6 — It Only Pays on Coins That Trended Hard
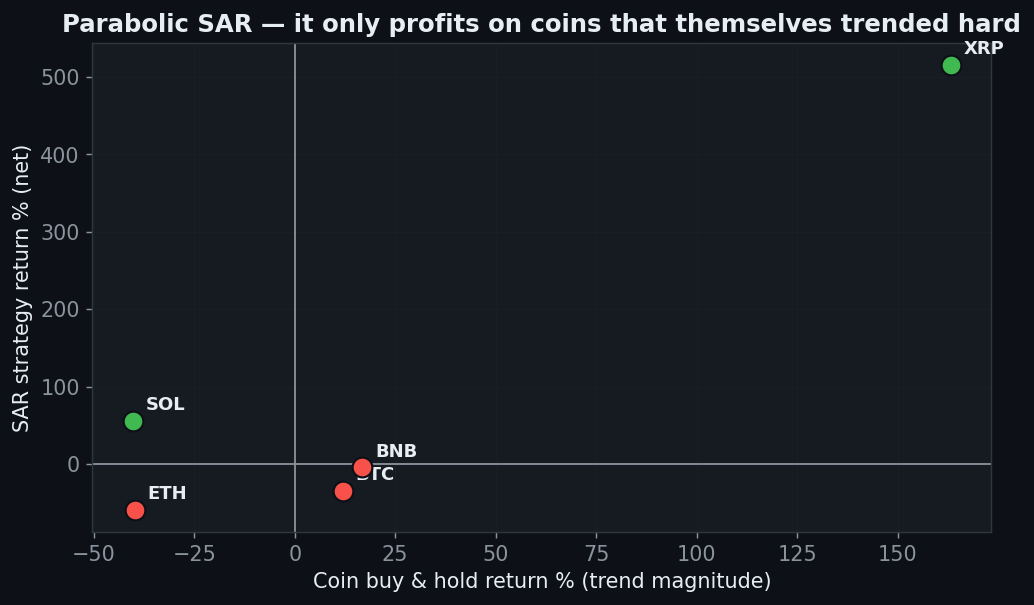
This scatter is the honest picture of SAR. Its two profitable coins on 4H are XRP (+516%) and SOL (+56%) — the two names with the largest, cleanest directional moves in the sample. On XRP, SAR even beats buy & hold (+516% vs +163%). But on the choppier majors — BTC, ETH, BNB — it whipsaws to losses. Catching a big trend is necessary for SAR to work, and not sufficient: ETH fell 40% too, yet SAR still lost on it because the descent was choppy. A strategy that only prints on the two cleanest trenders is a trend-rider, not a general edge.
Gate 2 — Friction Still Wins
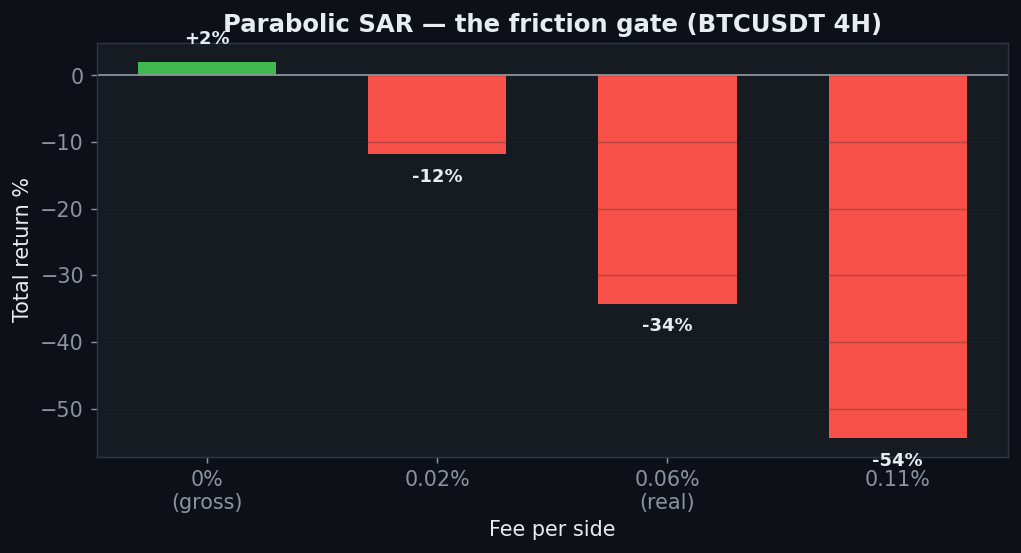
SAR’s gross 4H edge is a slim +2%, and a realistic 0.06%/side turns it into −34%. On fast timeframes it is a massacre — 5m and 15m both go to −100% on thousands of flips. The dots move on every minor wiggle, and every wiggle costs a fee. Its best clean timeframe is the daily, which finally turns positive at +8% — but even that still trails simply holding BTC (+13%).
Gate 6b — Five Coins & Robustness
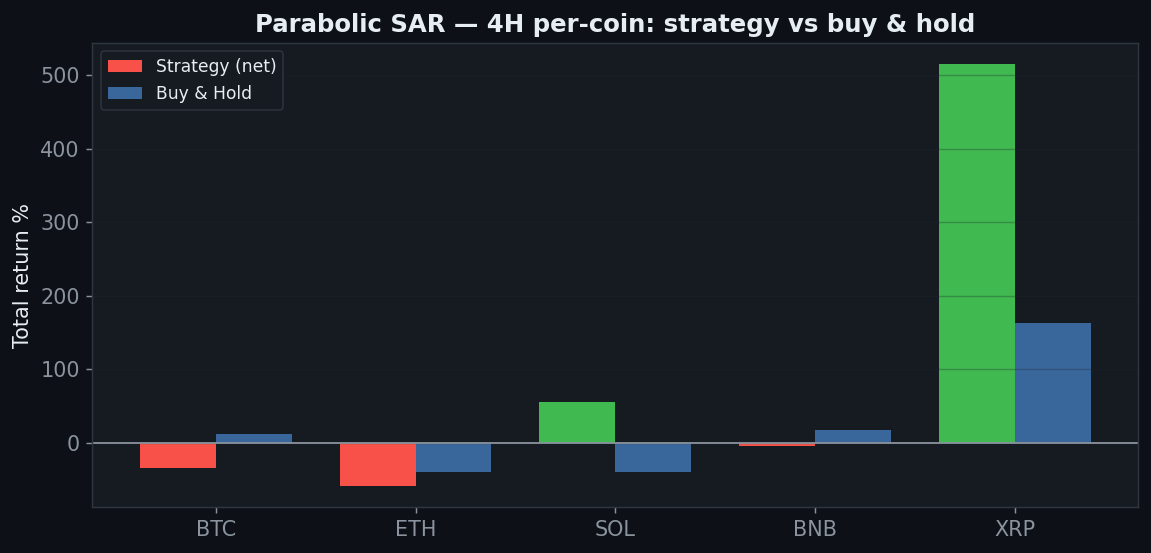
Two of five coins positive on 4H, both trend outliers; the parameter sweep is 0 of 6. To its credit, SAR posts the least-bad out-of-sample result of the pure flippers — 4 of 5 coins positive out-of-sample — which is consistent with a genuine but narrow trend-capturing tendency. It just isn’t enough, often enough, to beat holding after costs.
The Verdict: REJECT
- Gate 0 — Indicator fidelity — pass (Wilder’s SAR, 0.02 step to 0.20 cap, reproduced bar by bar)
- Gate 1 — Sanity — pass (signal on the closed bar, no look-ahead)
- Gate 2 — Friction — fail (+2% gross → −34% net on 4H; 5m and 15m → −100%)
- Gate 3 — Yearly consistency — fail (negative on the tradeable timeframes; only the daily scrapes +8%)
- Gate 4 — Out-of-sample — partial (4 of 5 coins positive out-of-sample — its one genuine bright spot)
- Gate 5 — Robustness — fail (0 of 6 acceleration × cap cells positive on 4H)
- Gate 6 — Multi-market — partial (2 of 5 coins on 4H — but only XRP and SOL, the hardest trenders)
- Gate 7 — vs Buy & Hold — fail (even the daily +8% trails holding +13%)
Parabolic SAR is a trailing stop wearing an entry signal’s costume. Used as Wilder intended — to ride and protect a position you already hold — it is a legitimate tool. Flipped into a stand-alone entry trigger, it only earns its keep on the cleanest, hardest trends (XRP, SOL), whipsaws on everything choppier, bleeds to fees on fast charts, and even at its best — the daily — still can’t beat holding. It fails more honestly than the oscillators, because when a real trend shows up it does catch it. But “catches trends, loses to chop and costs” is not a system you can trade blind.
FAQ
SAR was never meant to be an entry — you’re testing it wrong.
That’s exactly the point, and we say so up front. Retail widely trades the flip as an entry, so we measured that. Used as a trailing stop on top of a separate entry, SAR can be perfectly reasonable — that’s a different system, and it would need its own test.
XRP made +516% — isn’t that great?
On one coin, in one direction, in a sample where XRP itself ran hard. Two of five coins profitable, a 0/6 sweep, and sub-holding returns on the daily are what tell you it’s a trend-rider that got one clean ride, not a repeatable edge.
Can I replicate this?
Yes — SAR(0.02, 0.02, 0.20), public Binance data, 0.06%/side, five coins, five timeframes.
See also: RSI 30/70, Stochastic, MACD crossover, UT Bot, and the conditional passes VWAP and Ichimoku (daily).
Disclaimer: educational research, not financial advice. Past performance does not guarantee future results. Never trade money you cannot afford to lose.