The Commodity Channel Index, built by Donald Lambert in 1980, is one of the most popular momentum oscillators on every charting platform. The rule taught everywhere is the ±100 breakout: when CCI pushes above +100, momentum is “strong” — go long; when it drops below −100, go short. It feels intuitive: buy strength, sell weakness. But there’s a catch baked into the idea, and the out-of-sample test exposes it brutally. We ran the CCI(20) ±100 breakout through the 7-Gate Protocol across six axes. Verdict: reject.
Methodology
- Data: Binance spot, Jul 2024–Jul 2026 (2 years), BTC/ETH/SOL/BNB/XRP
- Timeframes: 5m–1D (9 buckets, incl. resampled)
- Execution: CCI(20) on the closed bar, no look-ahead; long on cross above +100, short on cross below −100
- Friction: 0.06%/side (real); 0-fee gross reported too. Benchmark: buy & hold
- Six axes: timeframe, threshold, TP:SL, multi-coin, yearly, out-of-sample
Gate 0 — Fidelity
Standard CCI(20): (typical price − its 20-period SMA) / (0.015 × mean deviation), where typical price = (H+L+C)/3. Long when CCI crosses above +100, short when it crosses below −100. Reproduced exactly (pass).
The Exact Rules
- Signal: CCI crosses above +100 → long; crosses below −100 → short (stop-and-reverse, hold in between)
- Default: period 20, threshold ±100
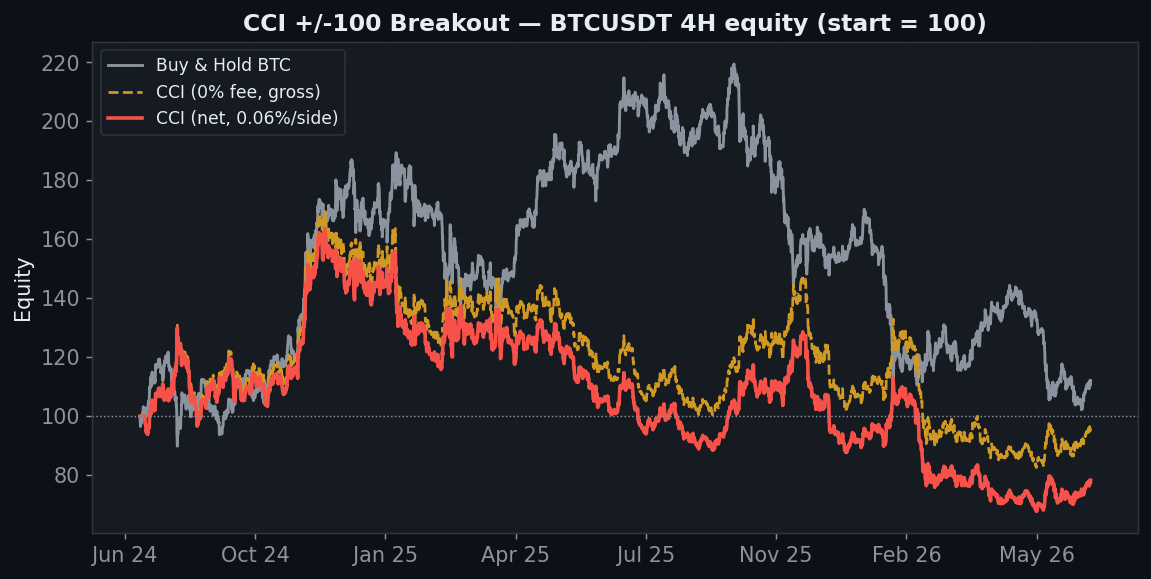
BTC 4H ends at −22% versus buy & hold’s +12%. Even the gross (0-fee) line finishes at −4% — barely any edge to erode. But the deeper problem isn’t the friction gate; it’s what happens the moment you test on data the strategy hasn’t seen.
Why It Bleeds: Buying the Spike Top
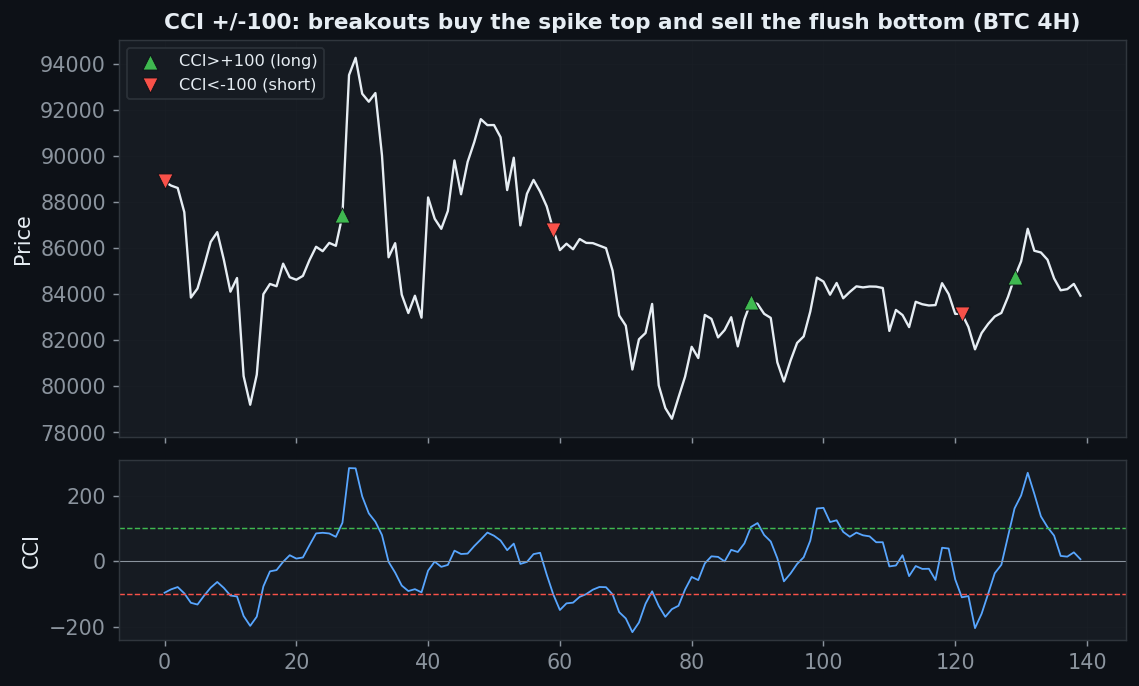
Look at where the entries land. CCI crosses +100 after a sharp push — which in crypto is very often the exhaustion of the move, not its start. So the breakout buys the top of the spike and shorts the bottom of the flush, then reverses. A 33% win rate is the arithmetic of systematically entering extremes just as they’re about to snap back. “Buy strength” sounds right, but a +100 reading is frequently the last gasp of strength.
Axis 1 — Timeframe (gross vs net)
| Timeframe | Trades | Gross (0 fee) | Net (real) |
|---|---|---|---|
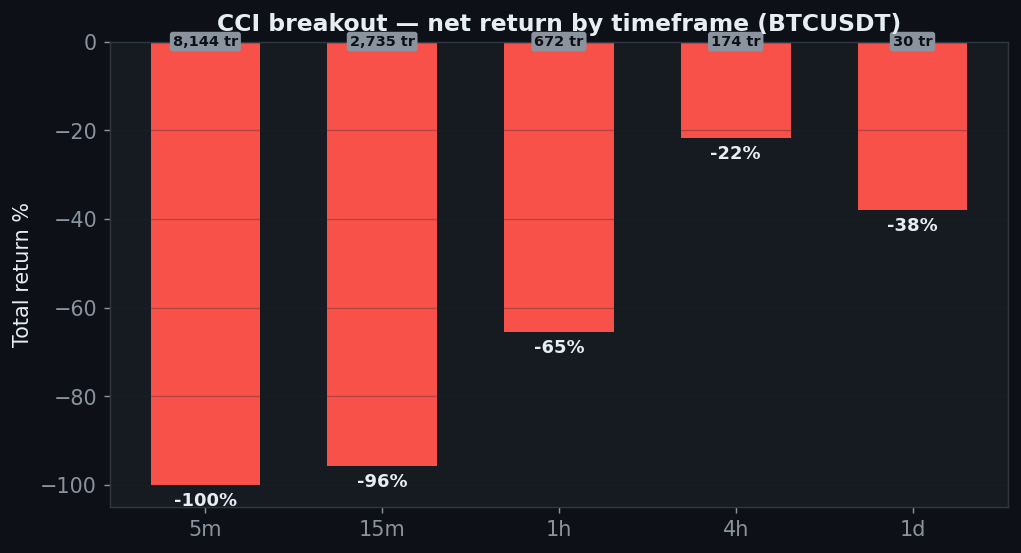
| 5m | 8,144 | −48% | −100% |
| 15m | 2,735 | +16% | −96% |
| 30m | 1,354 | +15% | −77% |
| 1h | 672 | −22% | −65% |
| 2h | 324 | +6% | −28% |
| 4h | 174 | −4% | −22% |
| 6h | 112 | −38% | −46% |
| 12h | 44 | +55% | +47% |
| 1D | 30 | −36% | −38% |
The five main timeframes are all net-negative. There is one honest bright spot — the 12-hour is +47% net — but it rests on just 44 trades, one timeframe on one coin, and (as the out-of-sample gate shows) doesn’t generalize. A single green cell on a tiny sample is a curiosity, not a system.
Axis 2 — Threshold (parameter)
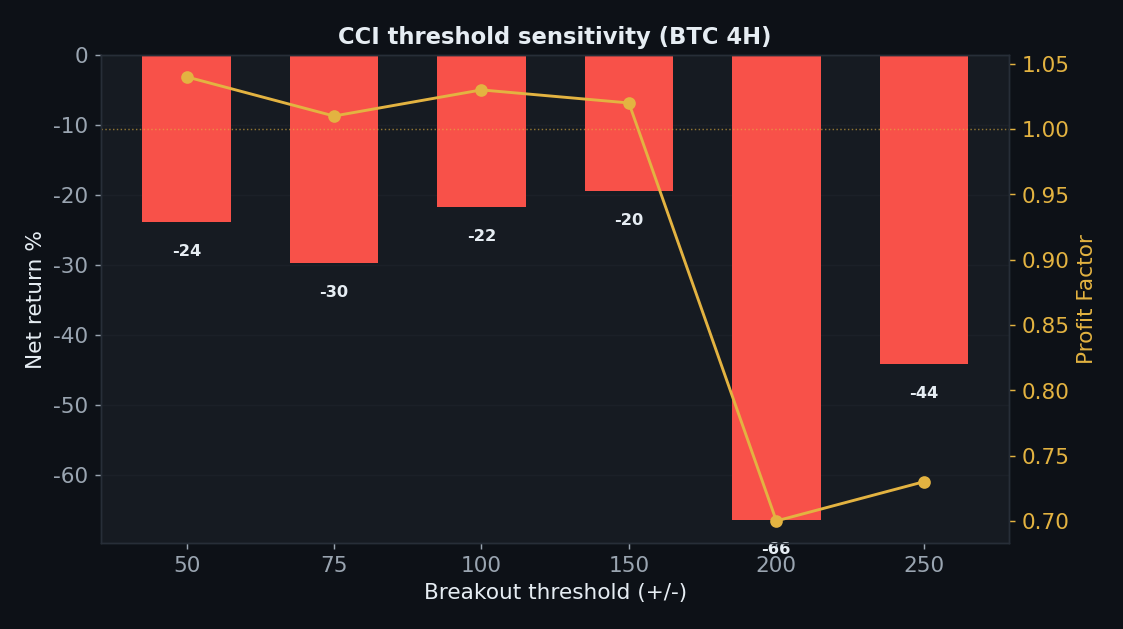
Maybe ±100 is just the wrong level? We swept the breakout threshold on BTC 4H.
| Threshold (±) | Trades | Net | PF |
|---|---|---|---|
| 50 | 238 | −24% | 1.04 |
| 75 | 202 | −30% | 1.01 |
| 100 (default) | 174 | −22% | 1.03 |
| 150 | 108 | −20% | 1.02 |
| 200 | 66 | −66% | 0.70 |
| 250 | 39 | −44% | 0.73 |
Every threshold loses, and widening it makes things worse (±200 → −66%). There is no “extreme enough” level that turns momentum-breakout entries into an edge on the majors. Nothing to tune.
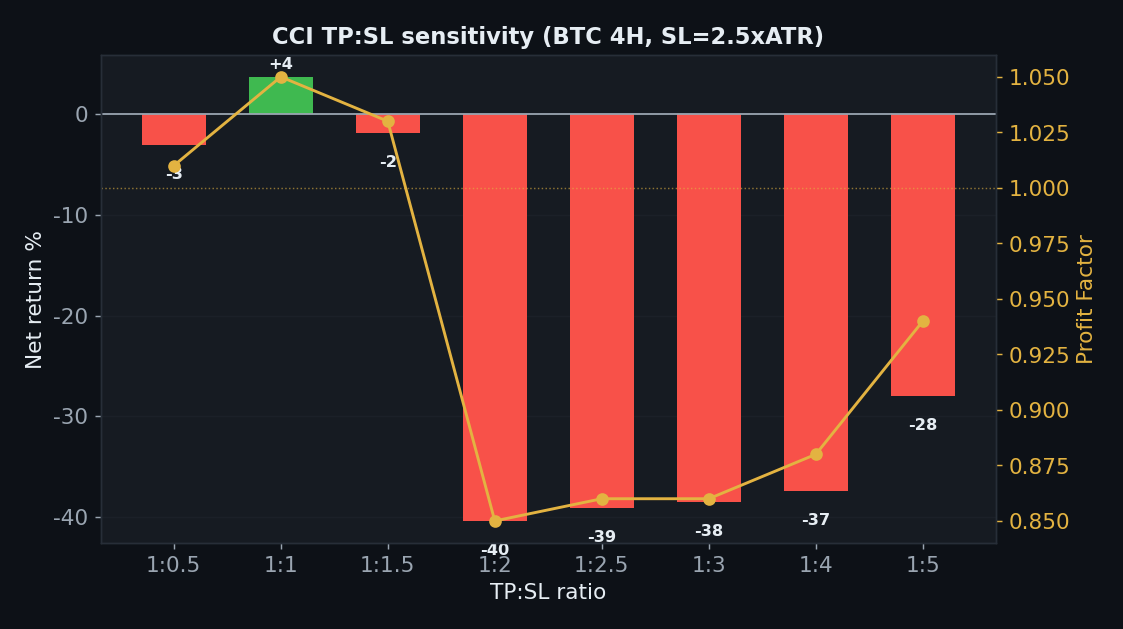
Axis 3 — TP:SL
| TP:SL | Net | PF |
|---|---|---|
| 1:0.5 | −3% | 1.01 |
| 1:1 | +4% | 1.05 |
| 1:1.5 | −2% | 1.03 |
| 1:2 | −40% | 0.85 |
| 1:2.5 | −39% | 0.86 |
| 1:3 | −39% | 0.86 |
| 1:4 | −37% | 0.88 |
| 1:5 | −28% | 0.94 |
Only a very tight take-profit (1:1) scrapes +4%; everything from 1:2 upward loses 28–40%. As with the other momentum rejects, the only marginally-positive variant is quick-scalp, not the “ride the breakout” the strategy is sold as — and +4% on one coin isn’t a strategy.
Axis 4 — Five Coins
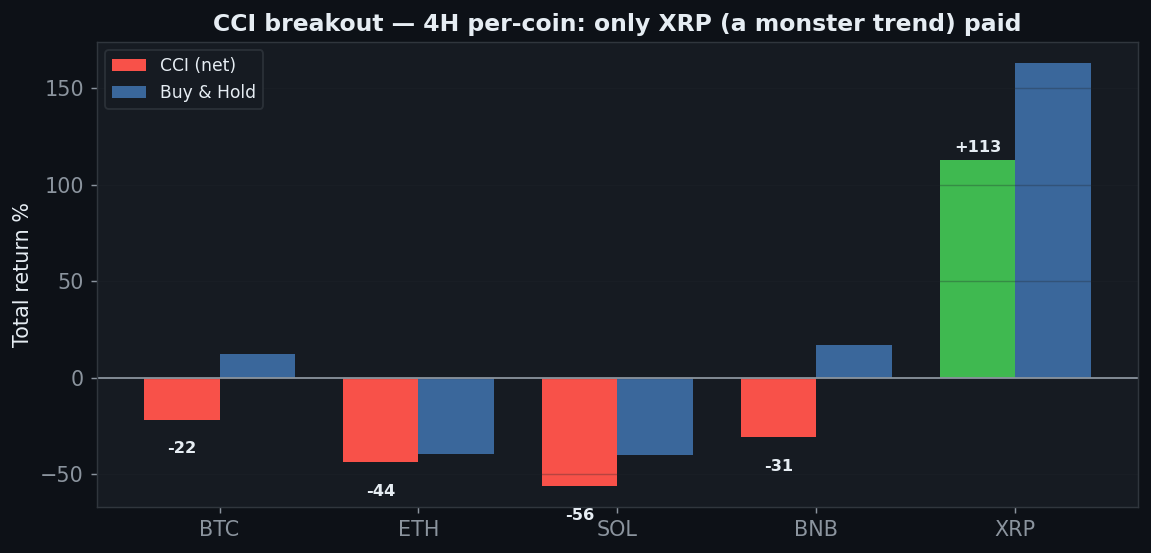
| Coin | CCI net | Buy & Hold | Excess |
|---|---|---|---|
| BTC | −22% | +12% | −34pp |
| ETH | −44% | −40% | −4pp |
| SOL | −56% | −40% | −16pp |
| BNB | −31% | +17% | −48pp |
| XRP | +113% | +163% | −50pp |
Only XRP (1 of 5) is net-positive (+113%), and even that trails XRP’s own buy & hold (+163%). The rest lose 22–56%. The single winner is the biggest trender — trend-luck.
Axis 5 — Yearly
| Year | BTC 4H net |
|---|---|
| 2024 | +38% |
| 2025 | −36% |
| 2026 (to Jul) | −11% |
2024 looks great at +38% — but 2025 (−36%) and 2026 (−11%) are both negative. Two of three years lose. A single good year is exactly the kind of result the next gate is designed to catch.
Axis 6 — Friction & the Killer Gate: Out-of-Sample
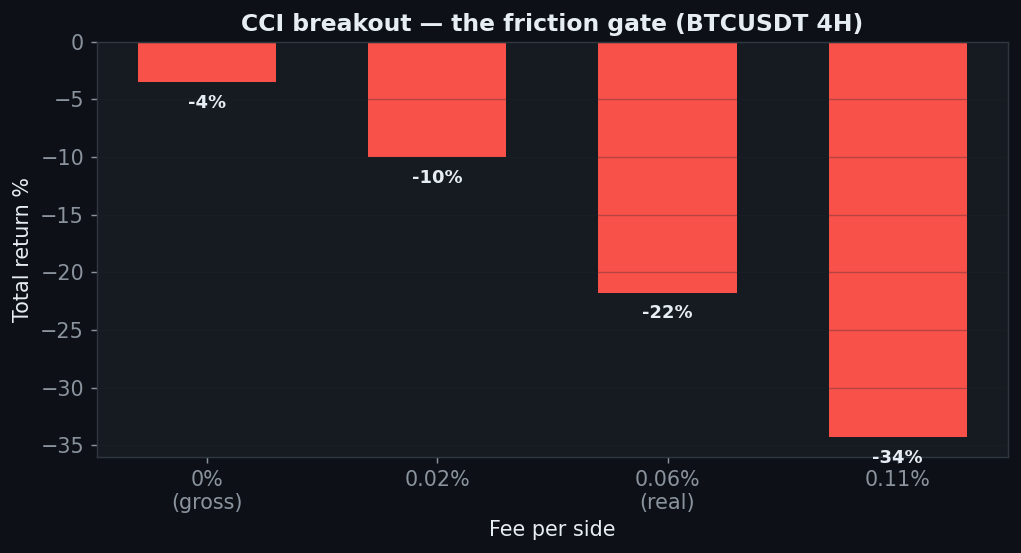
Friction (BTC 4H): −4% gross → −22% net. But the decisive result is out-of-sample. Train on the first 18 months, test on the last 6, and 0 of 5 coins stay positive out-of-sample — the cleanest failure on this entire site. Whatever looked workable in-sample (2024’s +38%, the 12H, the tight TP) is precisely the memorised past; none of it survives on unseen data.
The Verdict: REJECT
- Gate 0 — Indicator fidelity — pass (standard CCI(20), ±100 breakout)
- Gate 1 — Sanity — pass (signal on the closed bar, no look-ahead)
- Gate 2 — Friction — fail (−4% at zero fees on 4H, −22% net; 5m → −100%)
- Gate 3 — Yearly consistency — fail (2024 +38 / 2025 −36 / 2026 −11 — two of three years lose)
- Gate 4 — Out-of-sample — fail hard (0 of 5 coins positive out-of-sample — nothing generalizes)
- Gate 5 — Robustness — fail (threshold sweep 0/6; wider thresholds are worse)
- Gate 6 — Multi-market — fail (1 of 5 coins; only XRP, a monster trender)
- Gate 7 — vs Buy & Hold — fail (5 main timeframes all lose; only a 44-trade 12H sample is positive)
CCI’s ±100 breakout buys momentum extremes — and in crypto, extremes are usually exhaustion. You enter at the top of the spike, reverse at the bottom of the flush, and win 33% of the time. There are teasing green cells — a +47% 12-hour, a +38% 2024 — but the out-of-sample gate is unforgiving: zero of five coins survive on unseen data, the flattest “this does not generalize” result we’ve measured. As the taught momentum-breakout rule, CCI is a reject.
FAQ
You should use CCI for reversion — buy oversold below −100, not breakouts.
That’s a different, opposite rule, and worth its own test — but “buy the +100 breakout” is what’s most commonly taught as the CCI strategy, so that’s what we measured here. A reversion version would still have to clear the same six gates, out-of-sample included.
Isn’t the 12-hour actually good (+47%)?
On 44 trades, one coin, in-sample. The out-of-sample gate (0/5) is the direct rebuttal: results that thin don’t repeat on new data.
Can I replicate this?
Yes — CCI(20), ±100 breakout, public Binance data, 0.06%/side, five coins, nine timeframes. Every table reproduces.
See also: Stochastic, ADX / DMI, Heikin Ashi, RSI 30/70, and the conditional passes VWAP and Ichimoku (daily).
Disclaimer: educational research, not financial advice. Past performance does not guarantee future results. Never trade money you cannot afford to lose.