The golden cross — a short moving average crossing above a long one — is the most famous signal retail traders know. YouTube sells it by the million views: “buy the golden cross, ride the trend.” So does it actually beat simply holding?
We ran it through the full 7-Gate Protocol: 9 years of daily data, 5 liquid coins, 5 timeframes down to 5-minute bars, a parameter sweep, and a 2,000-path Monte Carlo. It failed — and not narrowly. Here is the complete autopsy.
The Exact Rules
- Signal: fast MA crosses above slow MA (default 50/200) → go long; death cross → flat (cash)
- Position: spot, long-only, no leverage
- Execution: signal on the daily close, enter the next bar — no look-ahead
- Costs: 0.11% per side (fees + slippage), applied on every entry and exit
- Data: Binance daily, Aug 2017 – Jul 2026 (plus intraday for the timeframe test)
- Benchmark: buy & hold over the identical window
The Baseline: BTC, 50/200
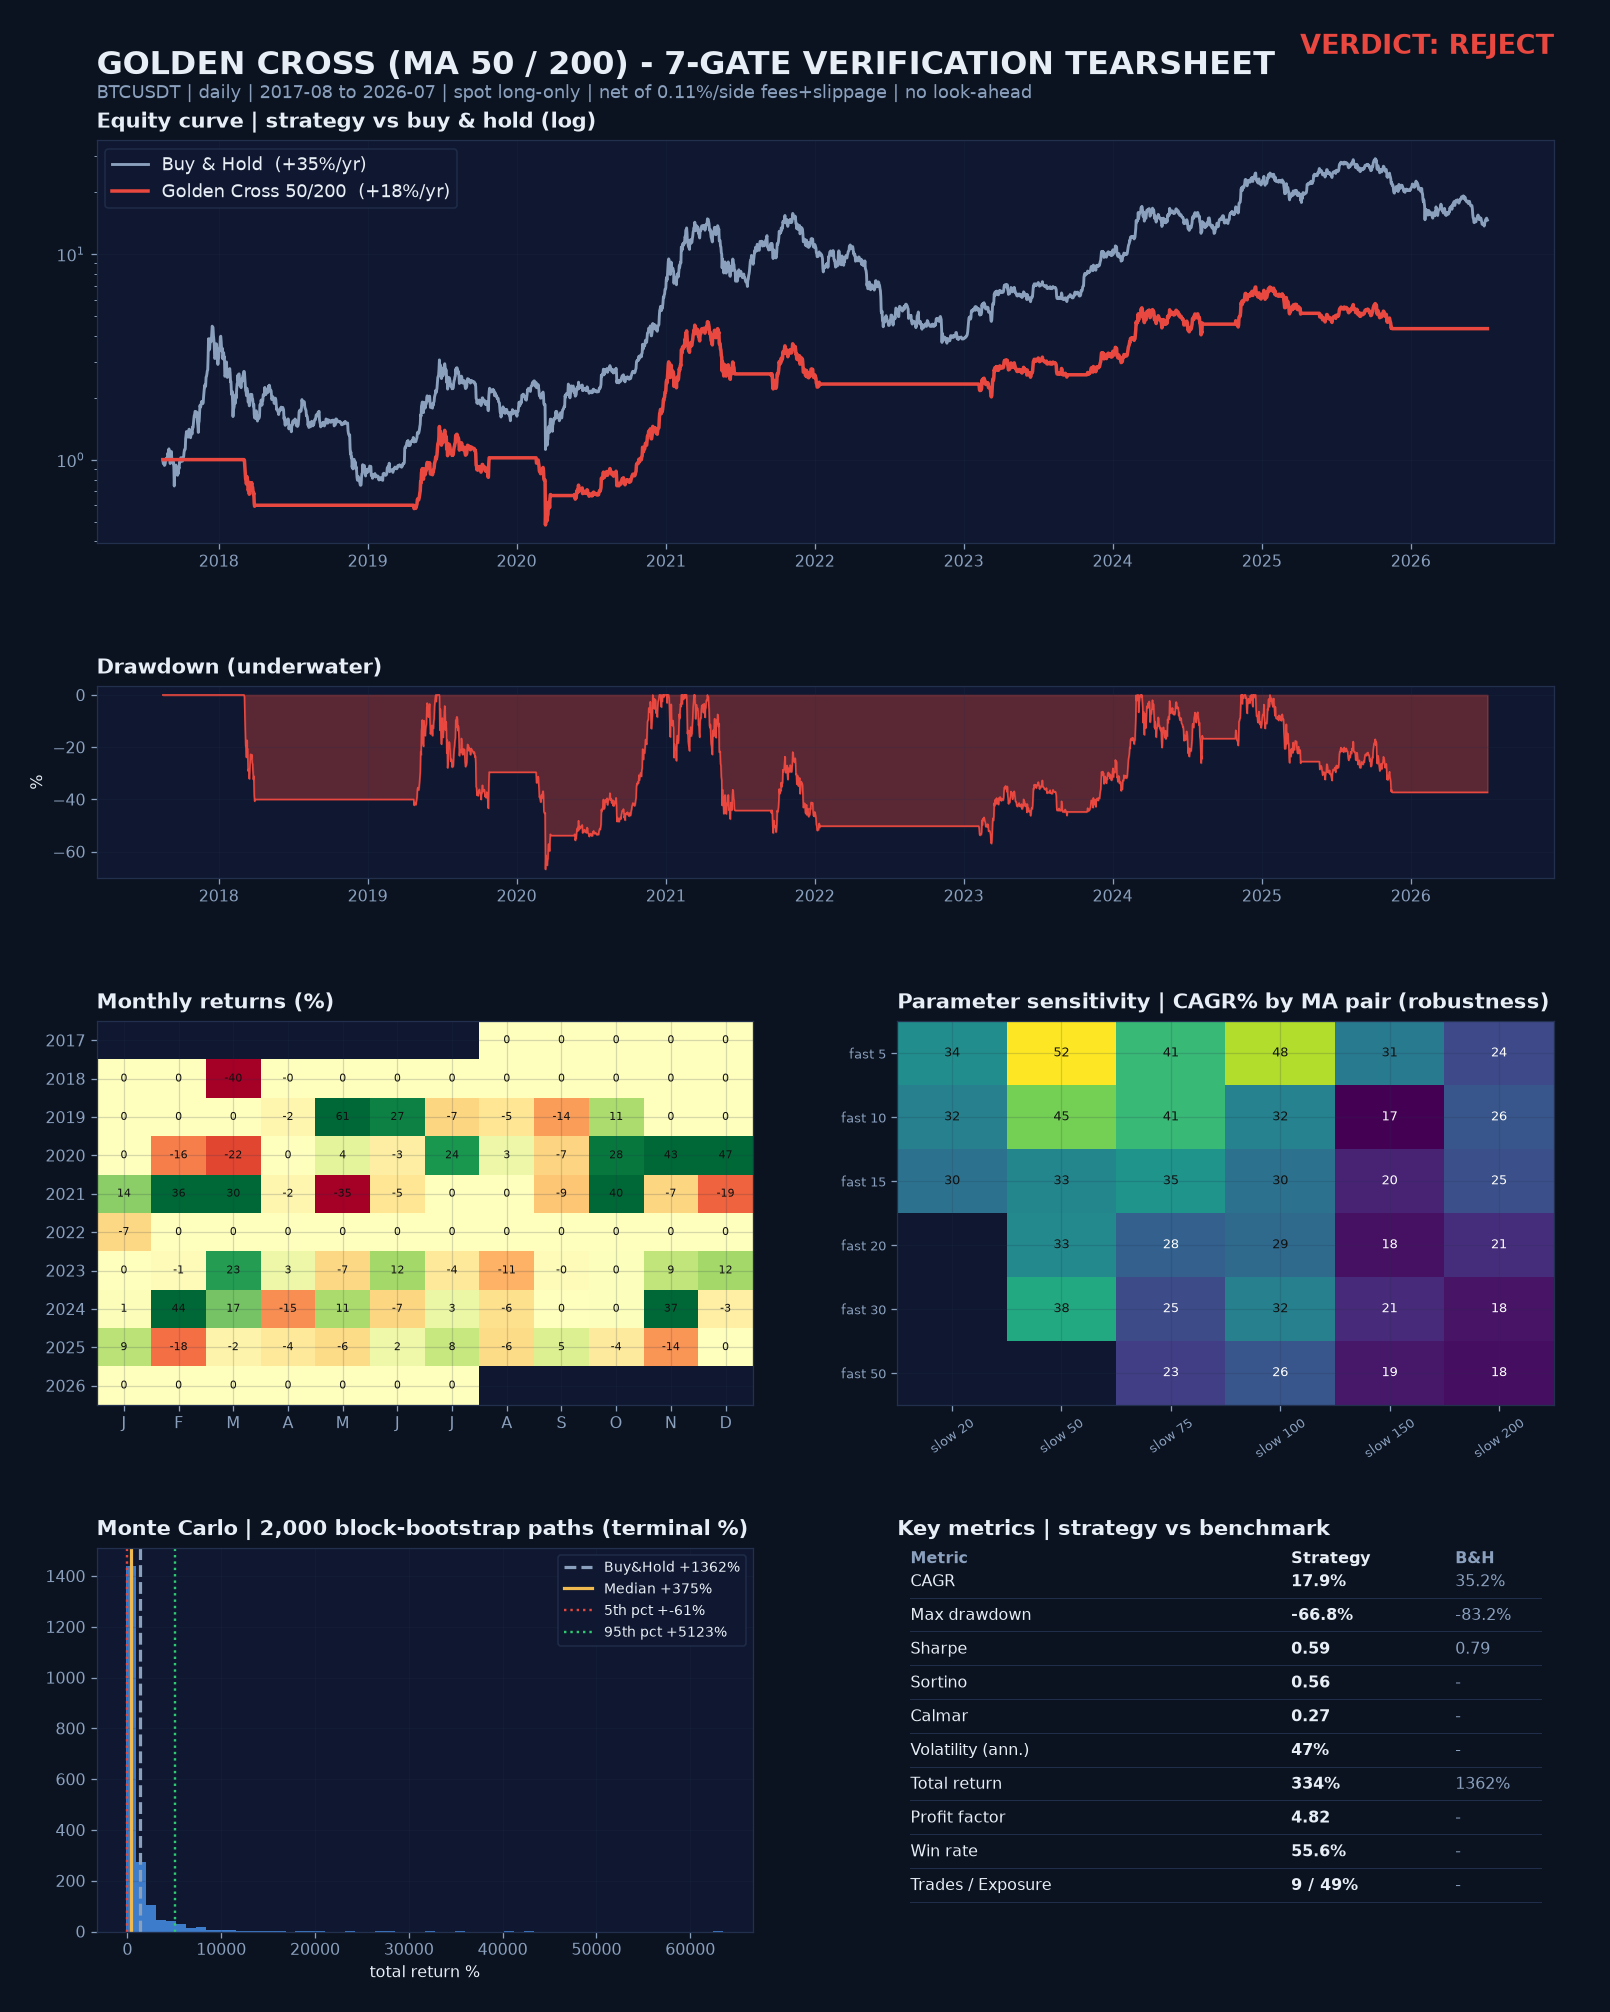
+334% total return sounds great — until you see buy & hold did +1,362% over the same window. Sharpe 0.59 vs 0.79. Calmar 0.27. The strategy’s only real contribution is a smaller drawdown (−66.8% vs −83.2%). It doesn’t make you more; it loses you less. That is a risk tool, not a profit engine — and it is the opposite of what the golden-cross evangelists promise.
Gate 03 — Yearly & Monthly
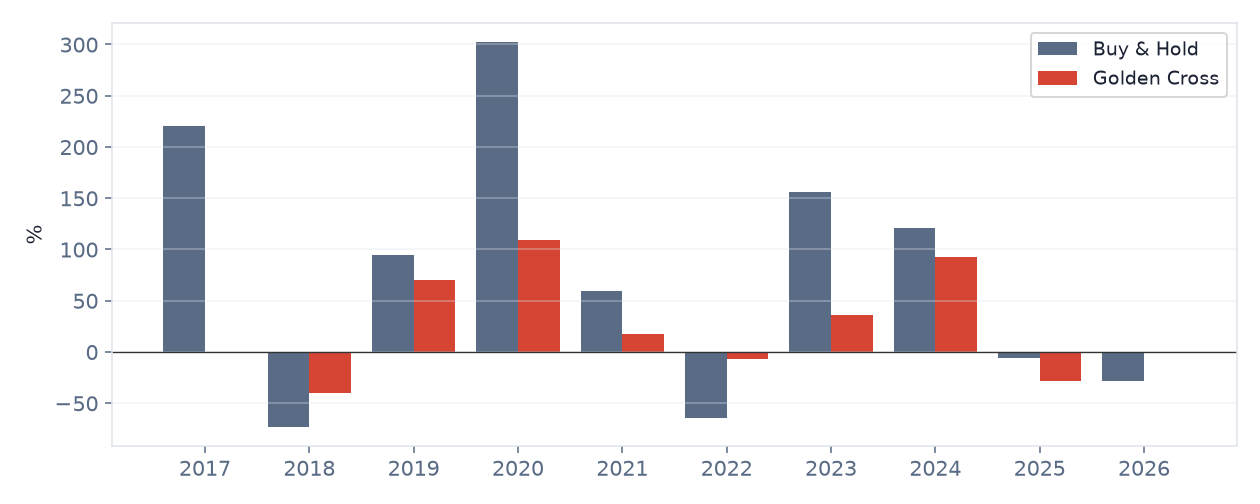
The pattern is unmistakable: the golden cross only wins in crash years — 2018 (−40% vs −73%), 2022 (−7% vs −64%). In every bull year it lags badly (2020: +109% vs +302%; 2021: +18% vs +60%). It is a drawdown filter wearing a profit strategy’s clothes.
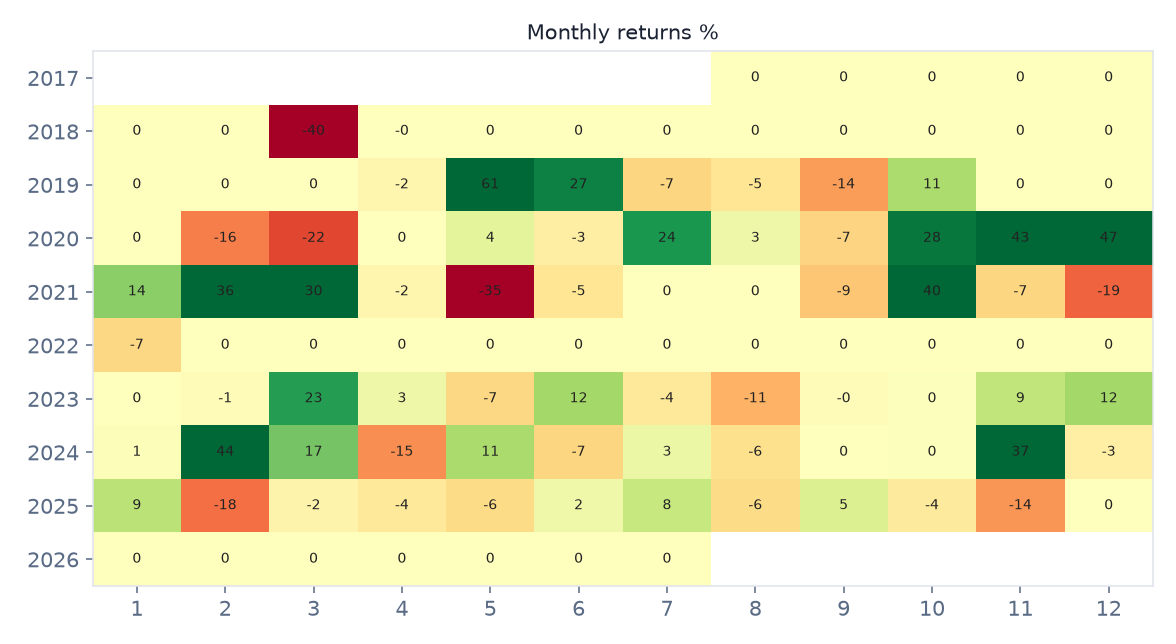
Monthly, there is no seasonality — long flat stretches (cash) punctuated by the occasional green month. You don’t get paid on a schedule; you get paid only when a big trend shows up.
Gate 04 — Out-of-Sample
Split the history in half. First half (2017–2022, an explosive bull): golden cross +133% vs buy & hold +759% — a rout. Second half (2022–2026, chop and decline): +86% (−37% DD) vs +69% (−67% DD) — here it wins, mostly on drawdown. The edge is regime-dependent, not stable.
Gate 05 — Parameter Robustness (the killer)
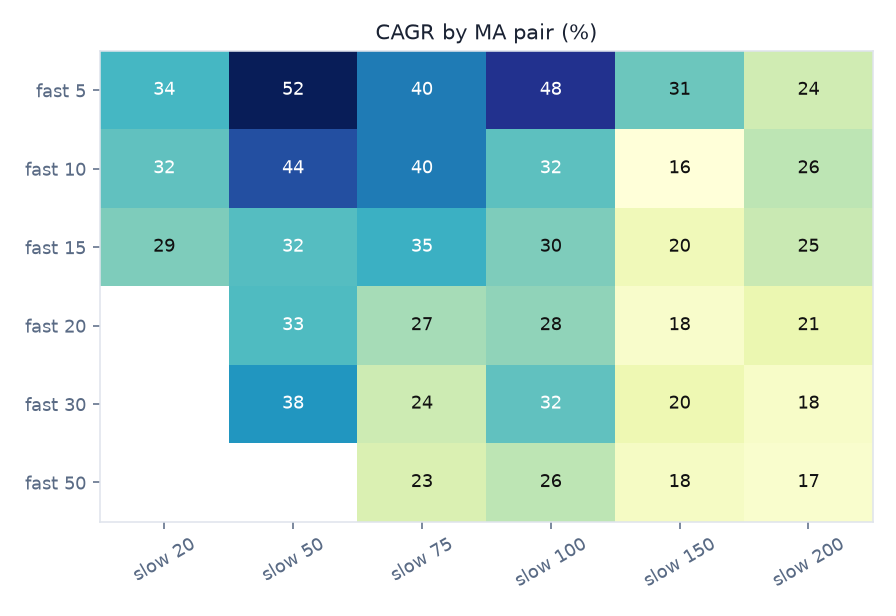
“Golden cross” means 50/200 to almost everyone. But CAGR swings wildly with the MA pair: the best combination reaches ~52% CAGR while the famous 50/200 sits near the bottom at ~18%. On ETH the gap is extreme — a 10/30 cross returns ~59% CAGR versus ~15% for 50/200. Most of the “performance” is simply which moving average you happened to pick. That is not an edge; that is luck, and the crowd picked one of the worst cells.
Gate 06a — Every Timeframe (the scalper’s grave)
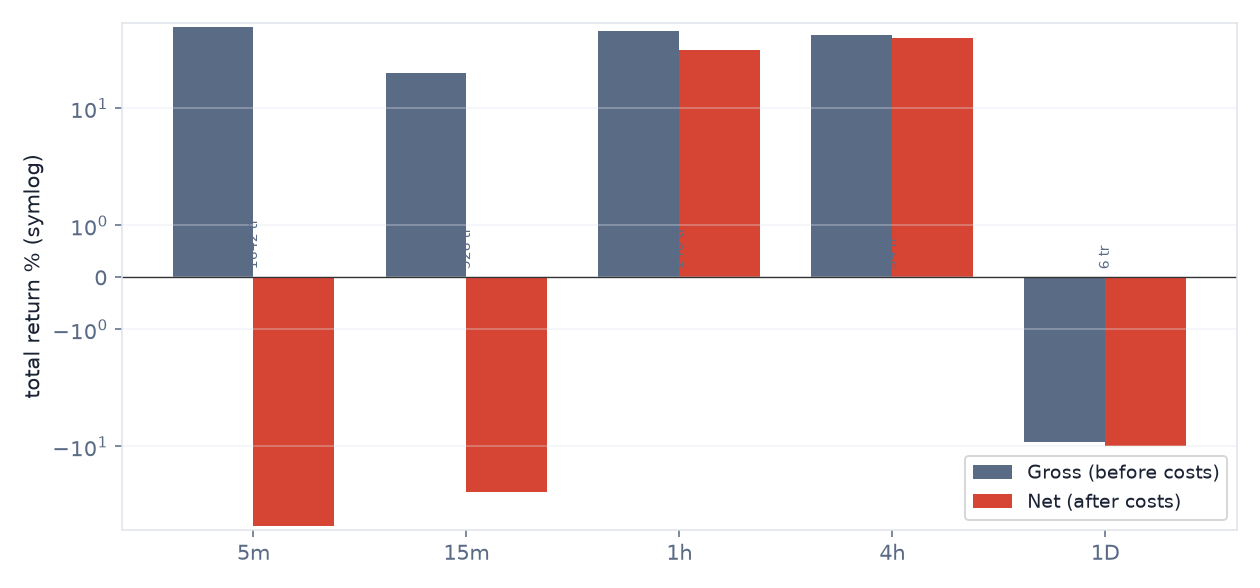
Does it work intraday, the way the “golden cross scalping” videos claim? We ran the identical 50/200 cross on 5m, 15m, 1h, 4h and daily. The result is brutal: on 5-minute bars it is +74% gross but −71% net once you pay for 1,642 trades. 15m: +24% → −31%. The lower the timeframe, the faster friction eats it alive. 4H is the least-bad (+56% net) yet still loses to buy & hold (+74%) over the same window. Golden-cross scalping is dead on arrival — the fees alone bury it.
Gate 06b — Five Liquid Coins
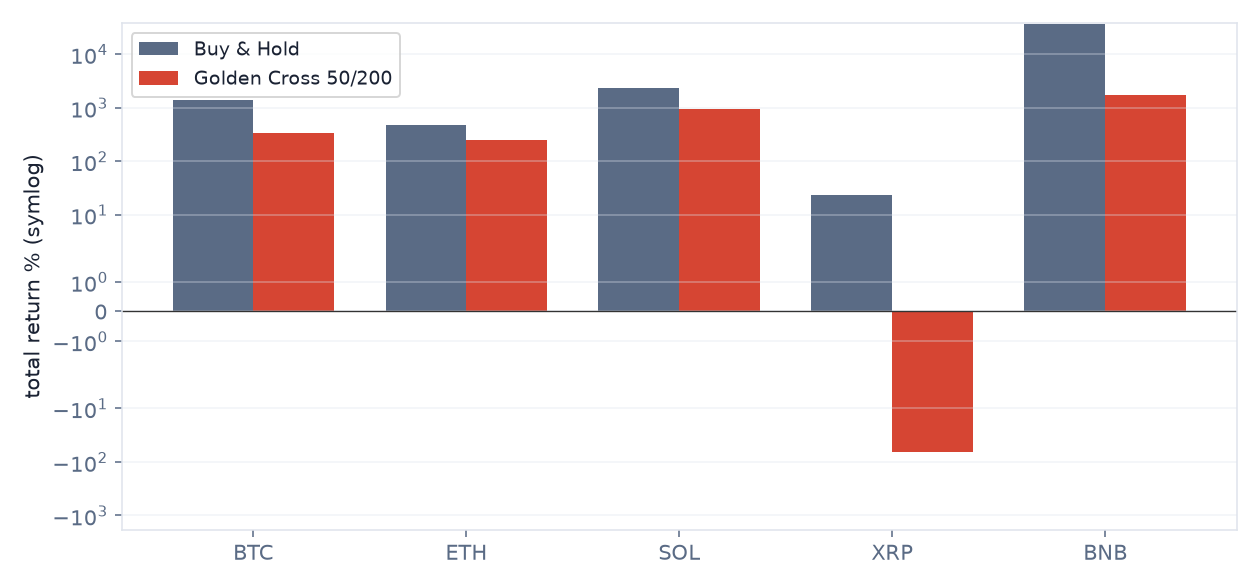
| Symbol | Golden Cross | Buy & Hold | Strategy Max DD | Verdict |
|---|---|---|---|---|
| BTC | +334% | +1,362% | −66.8% | loses to holding |
| ETH | +245% | +481% | −79.4% | loses to holding |
| SOL | +922% | +2,272% | −78.4% | loses to holding |
| XRP | −65% | +23% | −91.4% | loses money |
| BNB | +1,740% | +36,044% | −77.3% | loses to holding |
Five of the most liquid coins in crypto. The golden cross loses to buy & hold on every single one. On XRP it doesn’t merely underperform — it loses money (−65% while holding made +23%), whipsawed to death by a coin that mostly went sideways. Note BNB: even against a 361× monster, the golden cross returned “only” +1,740% — underperforming by a factor of twenty. The stronger the trend, the more it leaves on the table.
Gate 07 — Monte Carlo
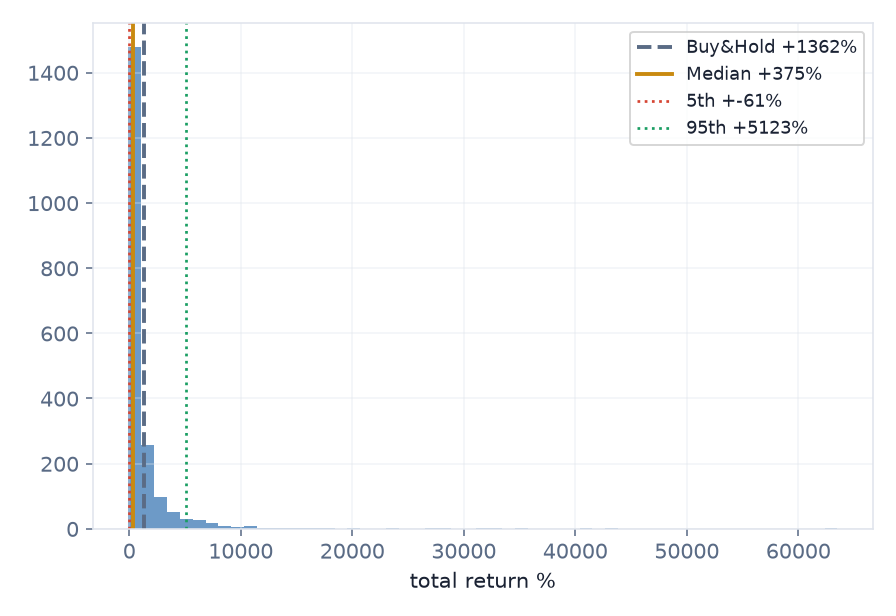
2,000 block-bootstrap paths of the daily returns. The median outcome is +375% — close to the actual +334%, and still far below buy & hold’s +1,362%. The 5th–95th percentile band is enormous (−61% to +5,123%), confirming heavy path-dependence. Translation: even luck doesn’t rescue it.
Take-profit to stop-loss — and why it cannot help
Could a fixed target beat holding to the death cross? We swept a fixed stop (3×ATR) and target on the daily 50/200 crosses, 2017–2026.
| TP : SL | Trades | Win rate | Profit factor | Net return |
|---|---|---|---|---|
| 1 : 0.5 | 8 | 62.5% | 0.75 | −12% |
| 1 : 1 | 8 | 50.0% | 1.01 | −5% |
| 1 : 1.5 | 8 | 50.0% | 1.52 | +16% |
| 1 : 2 | 8 | 50.0% | 2.03 | +40% |
| 1 : 2.5 | 8 | 50.0% | 2.55 | +69% |
| 1 : 3 | 8 | 50.0% | 3.06 | +101% |
Two problems leap out. First, the sample: a 50/200 golden cross fires just 8 times in nine years, so every figure here rests on eight trades — statistically meaningless, however tidy the rising profit factor looks. Second, even the best fixed target (+101% at 1:3) is far below simply holding to the death cross (+334%), and further still below buy-and-hold (+1362%). A take-profit on a trend-following cross only caps the rare winners that justify it. TP:SL cannot rescue a signal already beaten by doing nothing.
The Verdict: REJECT
Adding up the gates:
- Gate 0 — Indicator fidelity — pass (standard 50/200 simple-moving-average cross)
- Gate 1 — Sanity — pass (signal on the closed bar, entry next bar, no look-ahead)
- Gate 2 — Friction — fail intraday (5m/15m flip to losses purely on fees)
- Gate 3 — Yearly consistency — fail (wins only in crash years, lags every bull)
- Gate 4 — Out-of-sample — partial (regime-dependent)
- Gate 5 — Robustness — fail (result hinges on the MA pair; 50/200 is near-worst)
- Gate 6 — Multi-market — fail (loses to holding on all 5 coins)
- Gate 7 — vs Buy & Hold — fail (behind on total return and Sharpe)
“Buy the golden cross and profit” is, on the data, false. Its only value is drawdown reduction — and even that depends on a moving-average pair you got lucky with. As a standalone profit strategy it is a myth. As a defensive trend filter bolted onto a real system, maybe. Nothing more.
That distinction is the whole point of this site. One YouTube title says “The golden cross made 922% on Solana!” Another says “I tested the golden cross and lost money!” Both are technically true (SOL and XRP, right here). Neither is the truth.
FAQ
Then why does everyone still use it?
Because in crash years it looks like genius, and almost nobody backtests the bull years it quietly lags. Availability bias does the rest.
Isn’t a smaller drawdown worth it?
Only if you value risk reduction over returns and accept the parameter fragility. A plain “exit below the 200-day” achieves similar defense with far less overfitting risk.
Does it work on stocks or forex?
Different assets, different result. This test is crypto spot, daily and intraday. We only publish what we measured.
Can I replicate this?
Yes — the rules above are complete, the data is public Binance OHLCV, fees 0.11%/side. Every number in this article falls out of those inputs.
See also: the RSI 30/70 strategy (died at gate 2) and the VWAP trend-pullback strategy (the first to earn a conditional pass).
Disclaimer: This is educational research, not financial advice. Past performance does not guarantee future results. Never trade money you cannot afford to lose.