The Keltner Channel wraps price in a volatility envelope: an EMA in the middle, with an upper and lower band set a multiple of the ATR away. The breakout rule taught with it is simple — close above the upper band, go long; close below the lower band, go short — on the logic that leaving the channel signals a real move. Bollinger’s cousin, essentially, but built on ATR. So does breaking the Keltner band make money on crypto? We ran the EMA(20) ± 2×ATR breakout through the 7-Gate Protocol across six axes. Verdict: reject.
Methodology
- Data: Binance spot, Jul 2024–Jul 2026 (2 years), BTC/ETH/SOL/BNB/XRP
- Timeframes: 5m–1D (9 buckets, incl. resampled)
- Execution: EMA(20), bands at ±2×ATR; close beyond a band flips the position; closed-bar, no look-ahead
- Friction: 0.06%/side (real); 0-fee gross reported too. Benchmark: buy & hold
- Six axes: timeframe, band multiplier, TP:SL, multi-coin, yearly, out-of-sample
Gate 0 — Fidelity
Standard Keltner: a 20-period EMA of close, with upper/lower bands at the EMA ± 2×ATR(20). Long on a close above the upper band, short on a close below the lower. Reproduced exactly (pass).
The Exact Rules
- Signal: close > upper band → long; close < lower band → short (stop-and-reverse, hold inside the channel)
- Default: EMA 20, multiplier 2.0
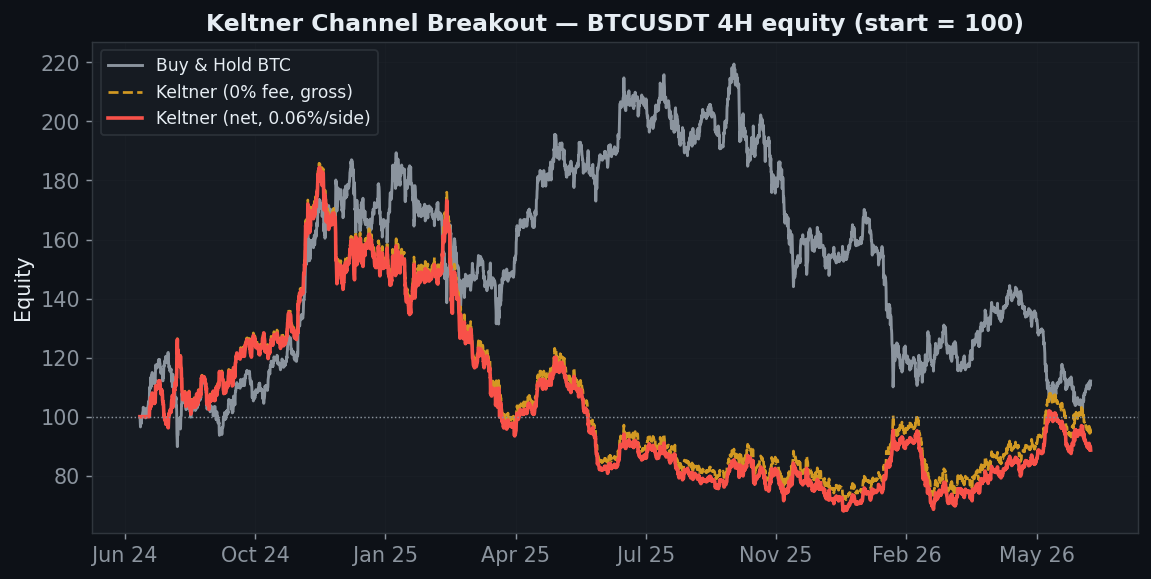
BTC 4H ends at −11% against buy & hold’s +12%. The gross (0-fee) line is −6% — barely any edge before costs. As with every breakout on this site, the problem is what happens when the market isn’t trending.
Why It Bleeds: Chop Inside the Band
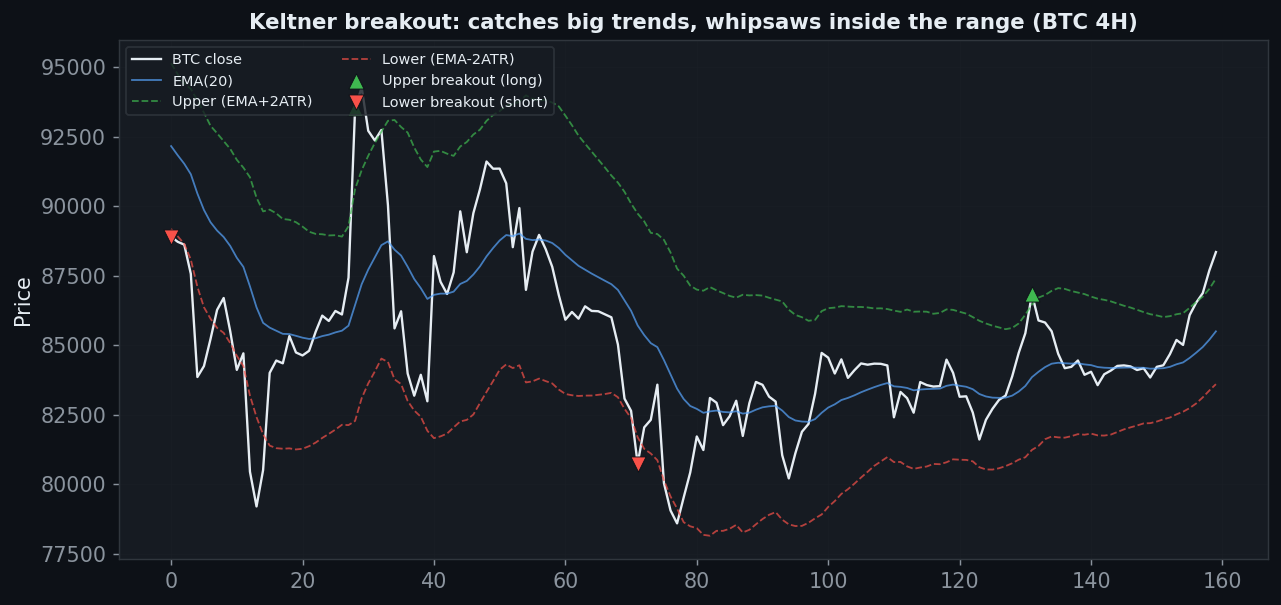
The Keltner breakout has the same Achilles’ heel as Donchian: when price ranges, it repeatedly pokes just past a band, fires a trade, and slips back inside — a whipsaw. It only earns when a market makes a big, clean, sustained move that rides along a band. The 4H curve on BTC, which chopped as much as it trended, is the result: a slow bleed.
Axis 1 — Timeframe (gross vs net)
| Timeframe | Trades | Gross (0 fee) | Net (real) |
|---|---|---|---|
| 5m | 3,005 | −39% | −98% |
| 15m | 873 | −51% | −83% |
| 30m | 454 | −33% | −60% |
| 1h | 202 | +25% | −2% |
| 2h | 110 | −21% | −31% |
| 4h | 51 | −6% | −11% |
| 6h | 36 | −31% | −34% |
| 12h | 20 | +79% | +76% |
| 1D | 6 | −10% | −11% |
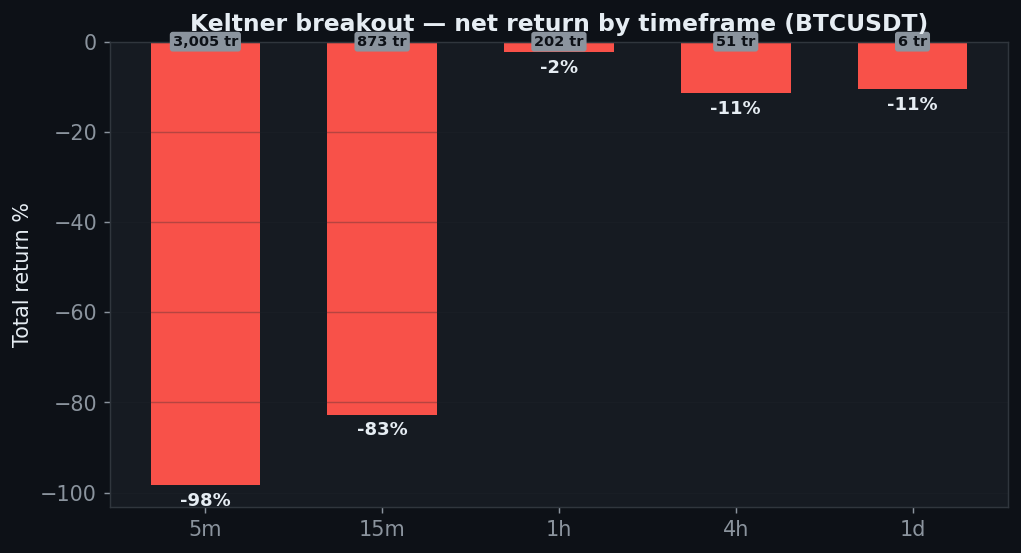
The five main timeframes are net-negative. There’s a bright spot on the 12-hour (+76%), but it rests on just 20 trades — a small-sample curiosity, not a system. The 5-minute vaporises at −98%.
Axis 2 — Band Multiplier (parameter)
| ATR multiplier | Net | PF |
|---|---|---|
| 1.0 | −6% | 1.09 |
| 1.5 | +4% | 1.15 |
| 2.0 (default) | −11% | 1.12 |
| 2.5 | −15% | 1.09 |
| 3.0 | −40% | 0.81 |
| 4.0 | −29% | 0.31 |
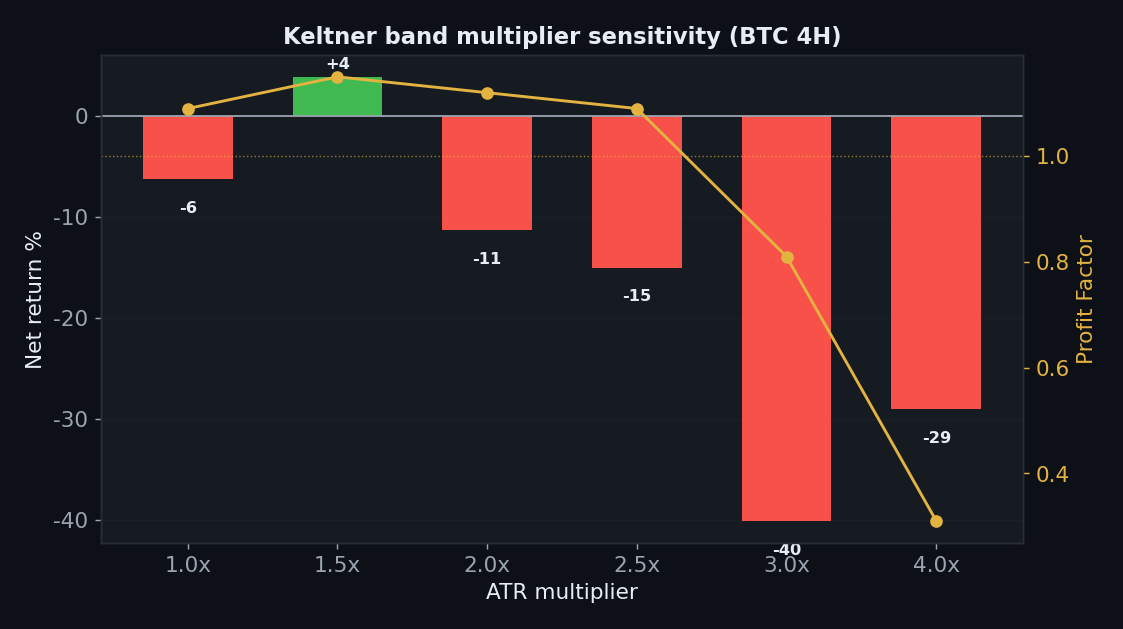
Only the 1.5× band scrapes a positive +4%; the default 2.0× loses, and wider bands (3×, 4×) lose badly. The edge, such as it is, lives at one narrow setting — not the plateau a robust strategy shows.
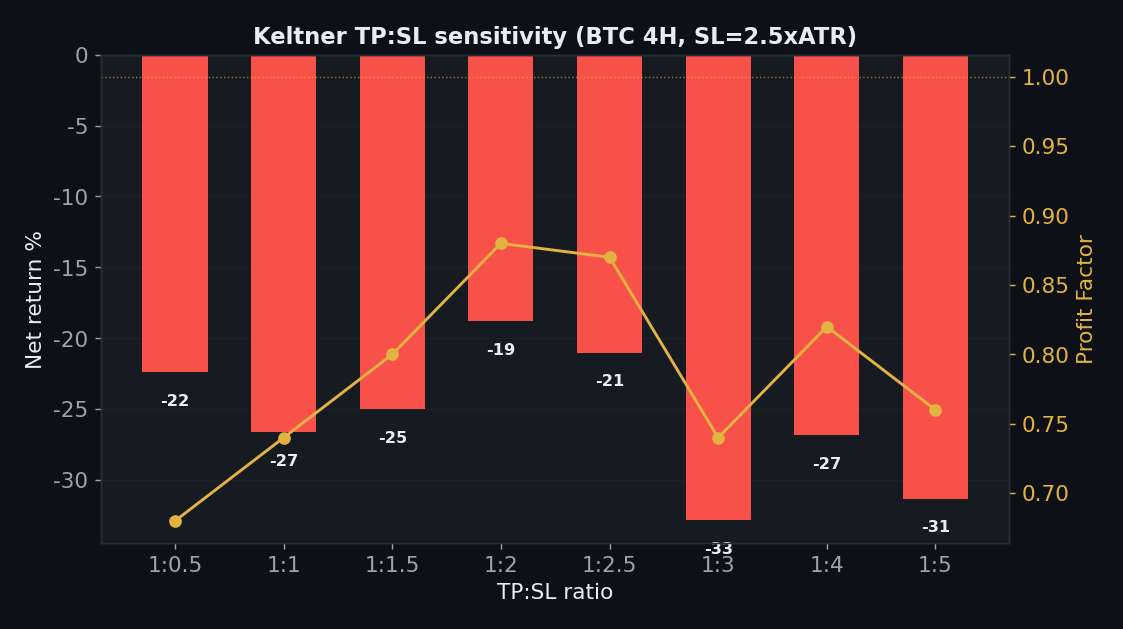
Axis 3 — TP:SL
| TP:SL | Net | PF |
|---|---|---|
| 1:0.5 | −22% | 0.68 |
| 1:1 | −27% | 0.74 |
| 1:1.5 | −25% | 0.80 |
| 1:2 | −19% | 0.88 |
| 1:2.5 | −21% | 0.87 |
| 1:3 | −33% | 0.74 |
| 1:4 | −27% | 0.82 |
| 1:5 | −31% | 0.76 |
No take-profit setting rescues it — every ratio loses 19–33% with a profit factor below 0.9. There’s no gross edge for a stop/target scheme to protect.
Axis 4 — Five Coins
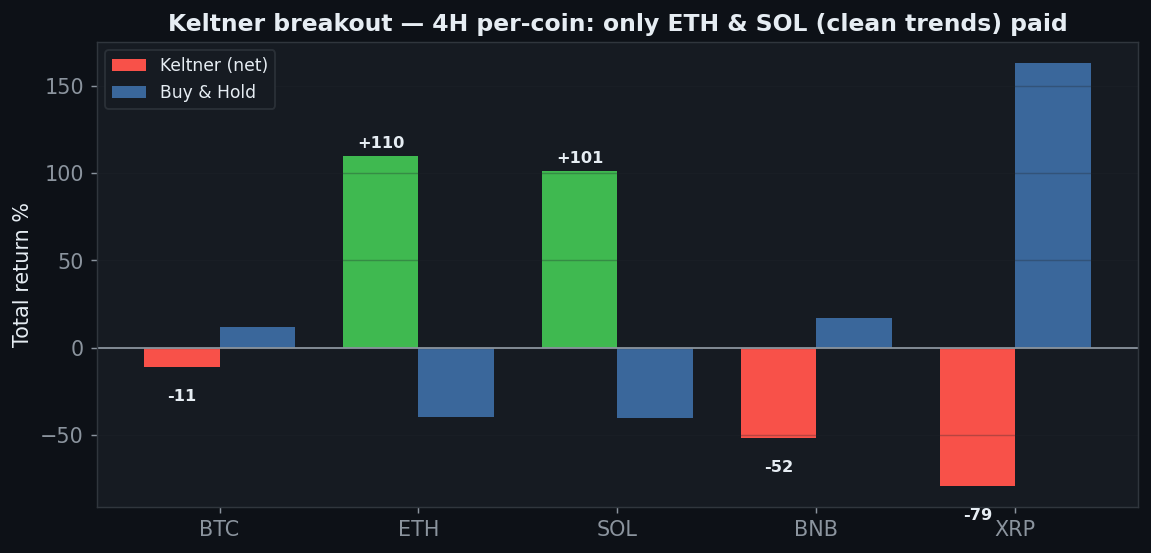
| Coin | Keltner net | Buy & Hold | Note |
|---|---|---|---|
| BTC | −11% | +12% | chopped |
| ETH | +110% | −40% | shorted the downtrend |
| SOL | +101% | −40% | shorted the downtrend |
| BNB | −52% | +17% | chopped |
| XRP | −79% | +163% | whipsawed |
This row is revealing. Keltner made +110% on ETH and +101% on SOL — both coins that fell ~40% over the period. It profited by shorting their clean downtrends. But on the choppier BTC and BNB it lost, and on XRP — which trended up hard — it was whipsawed to −79%. So it isn’t “2 of 5 coins work”; it’s “breakouts pay only where a big clean trend exists,” which you can’t know in advance.
Axis 5 — Yearly
| Year | BTC 4H net |
|---|---|
| 2024 | +60% |
| 2025 | −57% |
| 2026 (to Jul) | +30% |
2024 (+60%) and 2026 (+30%) look strong, but 2025’s −57% wipes them out on the full sample. Extreme regime dependence — great in trending years, destroyed in the choppy one.
Axis 6 — Friction & Out-of-Sample
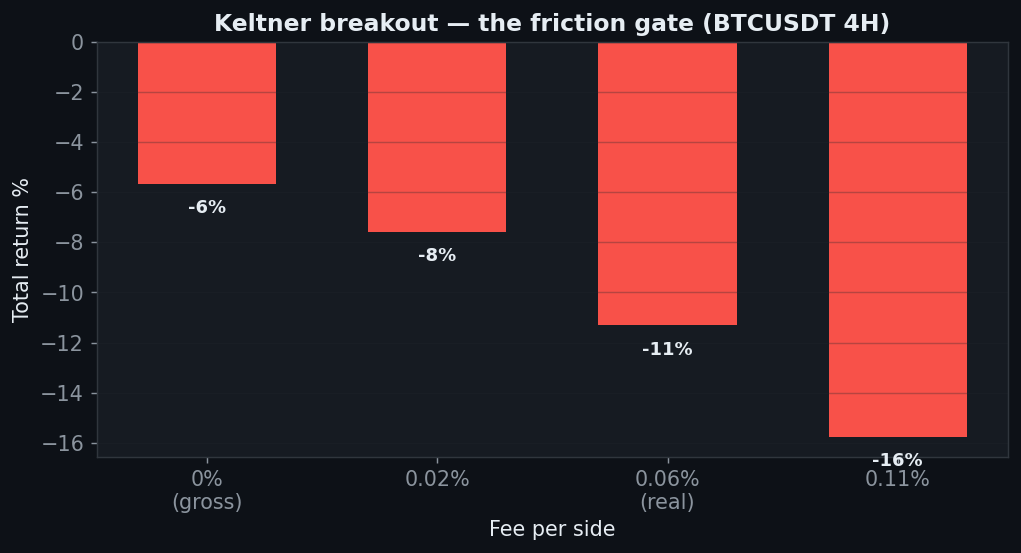
Friction (BTC 4H): −6% gross → −11% net. Out-of-sample, 2 of 5 coins stay positive — the same clean-trend coins — while the majors don’t. There’s no edge that generalizes across markets and regimes.
The Verdict: REJECT
- Gate 0 — Indicator fidelity — pass (EMA(20) ± 2×ATR Keltner Channel)
- Gate 1 — Sanity — pass (signal on the closed bar, no look-ahead)
- Gate 2 — Friction — fail (−6% at zero fees on 4H, −11% net; 5m → −98%)
- Gate 3 — Yearly consistency — fail (2024 +60 / 2025 −57 / 2026 +30 — 2025 wipes out the total)
- Gate 4 — Out-of-sample — fail (2 of 5 coins positive, the clean-trend ones)
- Gate 5 — Robustness — fail (only the 1.5× band positive; every TP:SL loses)
- Gate 6 — Multi-market — fail (2 of 5; profits only where a big clean trend existed, e.g. shorting ETH/SOL)
- Gate 7 — vs Buy & Hold — fail (0 of 5 timeframes beat holding)
Keltner is another breakout with no trend to break into. Leaving the volatility band is only a good signal when a clean, sustained move follows — which is why it printed +110% shorting ETH’s downtrend and lost on choppy BTC. On the majors, price pokes past the band and slips back, over and over, for a slow bleed. Its edge lives at one band width and one kind of market, evaporates in 2025, and doesn’t beat holding on any timeframe. As the taught band-breakout rule, Keltner is a reject.
FAQ
Keltner is meant for pullbacks/mean-reversion, not breakouts.
The band breakout is the most commonly taught Keltner trade, so that’s what we measured. A pullback (fade back to the EMA) is a different, opposite rule and would need its own six-gate test.
It made +110% on ETH though.
By shorting a coin that fell 40% — a single clean downtrend. It lost on BTC, BNB and XRP. Profiting only where a big clean trend happened to exist is trend-luck, and the yearly (−57% in 2025) and out-of-sample gates confirm it doesn’t generalize.
Can I replicate this?
Yes — Keltner EMA(20) ± 2×ATR breakout, public Binance data, 0.06%/side, five coins, nine timeframes. Every table reproduces.
See also: Donchian / Turtle, Bollinger reversion, Triple SuperTrend, UT Bot, and the conditional passes VWAP and Ichimoku (daily).
Disclaimer: educational research, not financial advice. Past performance does not guarantee future results. Never trade money you cannot afford to lose.