Tag: Breakout

  • Keltner Channel Strategy Backtest: the Band Breakout That Only Pays on Clean Trends

    Keltner Channel Strategy Backtest: the Band Breakout That Only Pays on Clean Trends

    The Keltner Channel wraps price in a volatility envelope: an EMA in the middle, with an upper and lower band set a multiple of the ATR away. The breakout rule taught with it is simple — close above the upper band, go long; close below the lower band, go short — on the logic that leaving the channel signals a real move. Bollinger’s cousin, essentially, but built on ATR. So does breaking the Keltner band make money on crypto? We ran the EMA(20) ± 2×ATR breakout through the 7-Gate Protocol across six axes. Verdict: reject.

    Methodology

    • Data: Binance spot, Jul 2024–Jul 2026 (2 years), BTC/ETH/SOL/BNB/XRP
    • Timeframes: 5m–1D (9 buckets, incl. resampled)
    • Execution: EMA(20), bands at ±2×ATR; close beyond a band flips the position; closed-bar, no look-ahead
    • Friction: 0.06%/side (real); 0-fee gross reported too. Benchmark: buy & hold
    • Six axes: timeframe, band multiplier, TP:SL, multi-coin, yearly, out-of-sample

    Gate 0 — Fidelity

    Standard Keltner: a 20-period EMA of close, with upper/lower bands at the EMA ± 2×ATR(20). Long on a close above the upper band, short on a close below the lower. Reproduced exactly (pass).

    The Exact Rules

    • Signal: close > upper band → long; close < lower band → short (stop-and-reverse, hold inside the channel)
    • Default: EMA 20, multiplier 2.0
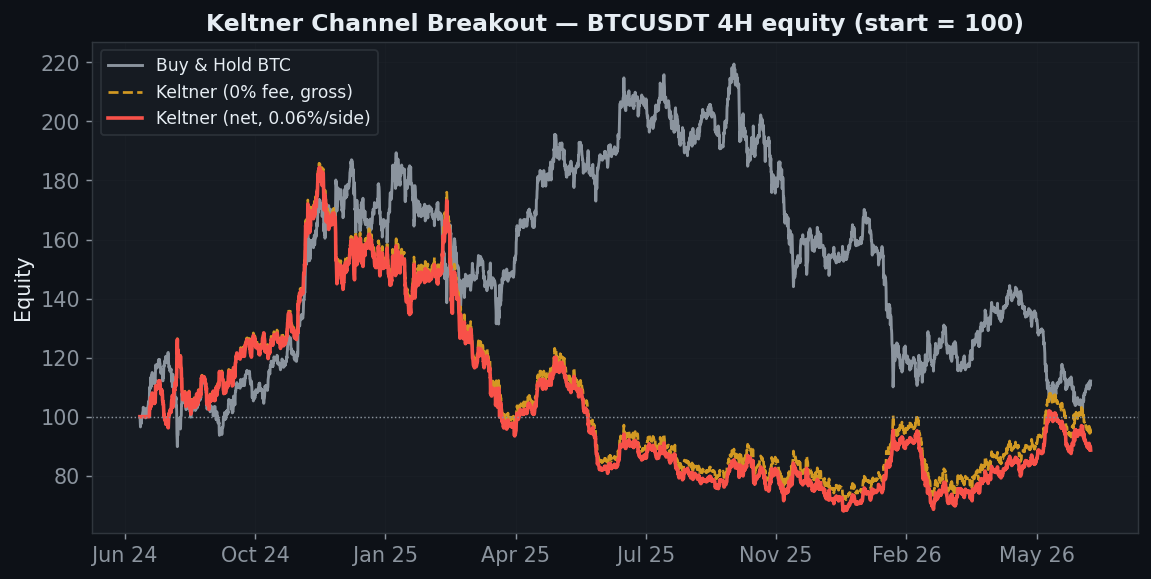
    Keltner channel breakout BTC 4H equity minus 11 net, gross minus 6, no edge, buy and hold plus 12

    BTC 4H ends at −11% against buy & hold’s +12%. The gross (0-fee) line is −6% — barely any edge before costs. As with every breakout on this site, the problem is what happens when the market isn’t trending.

    Why It Bleeds: Chop Inside the Band
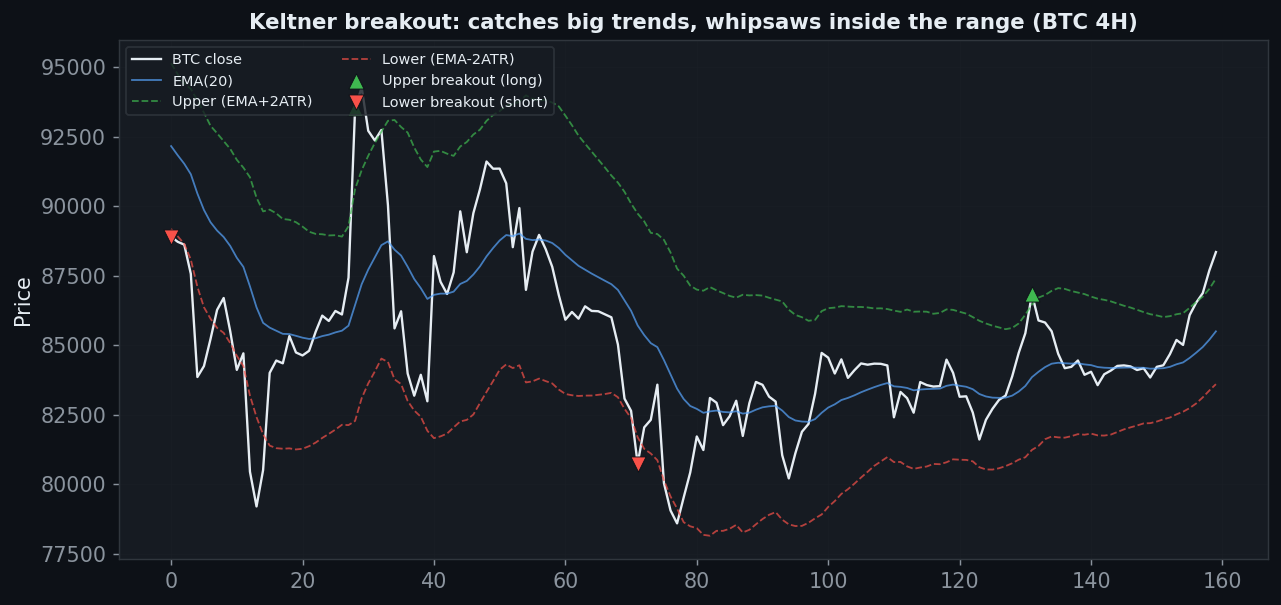
    Keltner channel EMA and 2 ATR bands on BTC 4H, breakouts whipsaw inside the range, catch big trends

    The Keltner breakout has the same Achilles’ heel as Donchian: when price ranges, it repeatedly pokes just past a band, fires a trade, and slips back inside — a whipsaw. It only earns when a market makes a big, clean, sustained move that rides along a band. The 4H curve on BTC, which chopped as much as it trended, is the result: a slow bleed.

    Axis 1 — Timeframe (gross vs net)

    Timeframe Trades Gross (0 fee) Net (real)
    5m 3,005 −39% −98%
    15m 873 −51% −83%
    30m 454 −33% −60%
    1h 202 +25% −2%
    2h 110 −21% −31%
    4h 51 −6% −11%
    6h 36 −31% −34%
    12h 20 +79% +76%
    1D 6 −10% −11%

    The five main timeframes are net-negative. There’s a bright spot on the 12-hour (+76%), but it rests on just 20 trades — a small-sample curiosity, not a system. The 5-minute vaporises at −98%.
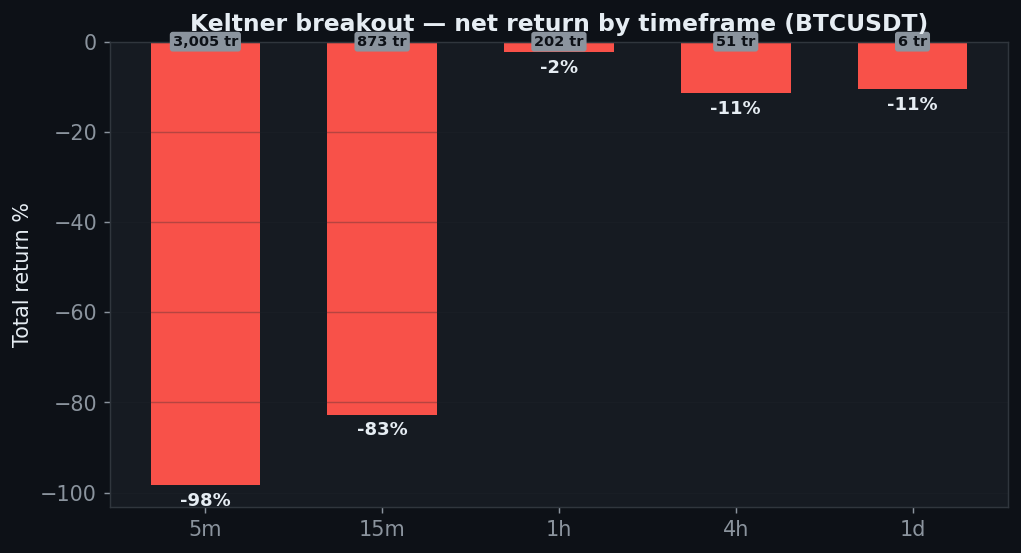
    Keltner net return by timeframe five main negative, 5 minute minus 98

    Axis 2 — Band Multiplier (parameter)

    ATR multiplier Net PF
    1.0 −6% 1.09
    1.5 +4% 1.15
    2.0 (default) −11% 1.12
    2.5 −15% 1.09
    3.0 −40% 0.81
    4.0 −29% 0.31

    Only the 1.5× band scrapes a positive +4%; the default 2.0× loses, and wider bands (3×, 4×) lose badly. The edge, such as it is, lives at one narrow setting — not the plateau a robust strategy shows.
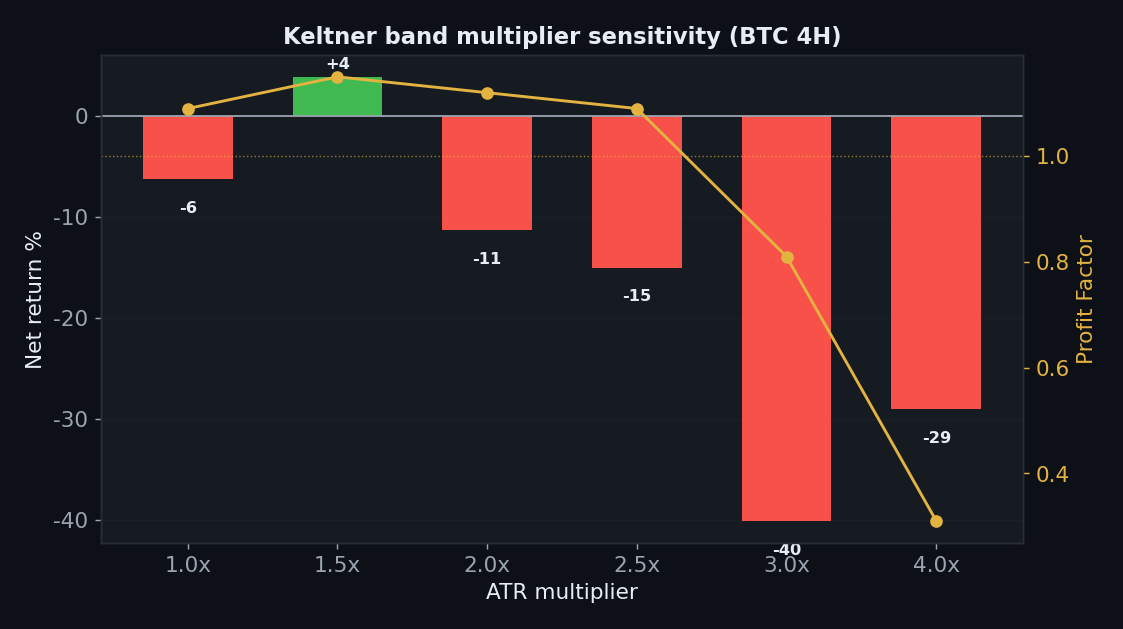
    Keltner band multiplier sensitivity, only 1.5x positive, default 2x and wider lose

    Axis 3 — TP:SL

    TP:SL Net PF
    1:0.5 −22% 0.68
    1:1 −27% 0.74
    1:1.5 −25% 0.80
    1:2 −19% 0.88
    1:2.5 −21% 0.87
    1:3 −33% 0.74
    1:4 −27% 0.82
    1:5 −31% 0.76

    No take-profit setting rescues it — every ratio loses 19–33% with a profit factor below 0.9. There’s no gross edge for a stop/target scheme to protect.
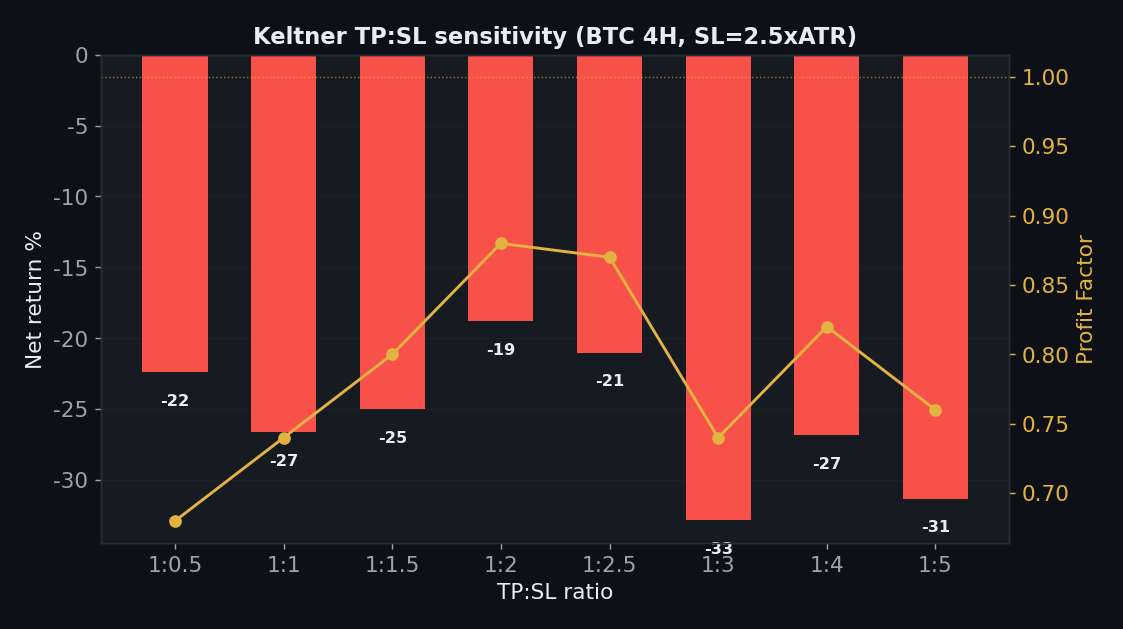
    Keltner TP:SL sensitivity every ratio loses 19 to 33 percent

    Axis 4 — Five Coins

    Coin Keltner net Buy & Hold Note
    BTC −11% +12% chopped
    ETH +110% −40% shorted the downtrend
    SOL +101% −40% shorted the downtrend
    BNB −52% +17% chopped
    XRP −79% +163% whipsawed

    This row is revealing. Keltner made +110% on ETH and +101% on SOL — both coins that fell ~40% over the period. It profited by shorting their clean downtrends. But on the choppier BTC and BNB it lost, and on XRP — which trended up hard — it was whipsawed to −79%. So it isn’t “2 of 5 coins work”; it’s “breakouts pay only where a big clean trend exists,” which you can’t know in advance.
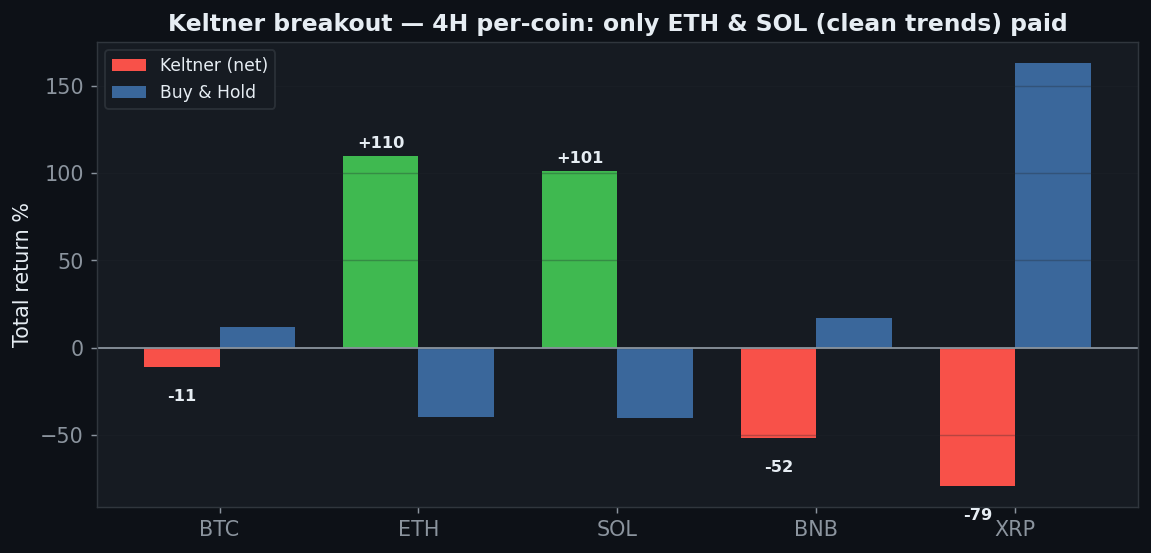
    Keltner five coins 4H, ETH plus 110 SOL plus 101 from shorting downtrends, BTC BNB XRP lose

    Axis 5 — Yearly

    Year BTC 4H net
    2024 +60%
    2025 −57%
    2026 (to Jul) +30%

    2024 (+60%) and 2026 (+30%) look strong, but 2025’s −57% wipes them out on the full sample. Extreme regime dependence — great in trending years, destroyed in the choppy one.

    Axis 6 — Friction & Out-of-Sample
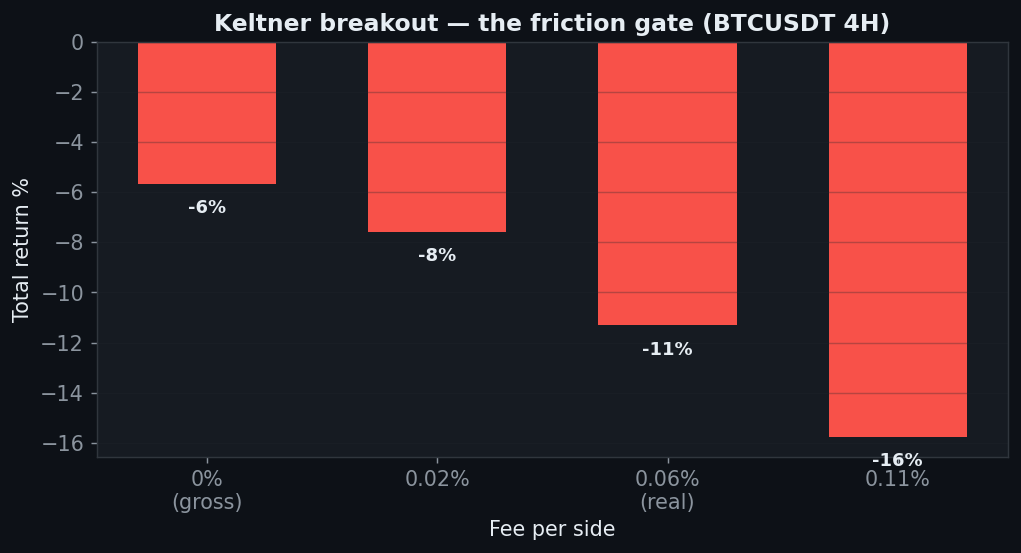
    Keltner friction gate minus 6 gross to minus 11 net BTC 4H

    Friction (BTC 4H): −6% gross → −11% net. Out-of-sample, 2 of 5 coins stay positive — the same clean-trend coins — while the majors don’t. There’s no edge that generalizes across markets and regimes.

    The Verdict: REJECT

    • Gate 0 — Indicator fidelitypass (EMA(20) ± 2×ATR Keltner Channel)
    • Gate 1 — Sanitypass (signal on the closed bar, no look-ahead)
    • Gate 2 — Frictionfail (−6% at zero fees on 4H, −11% net; 5m → −98%)
    • Gate 3 — Yearly consistencyfail (2024 +60 / 2025 −57 / 2026 +30 — 2025 wipes out the total)
    • Gate 4 — Out-of-samplefail (2 of 5 coins positive, the clean-trend ones)
    • Gate 5 — Robustnessfail (only the 1.5× band positive; every TP:SL loses)
    • Gate 6 — Multi-marketfail (2 of 5; profits only where a big clean trend existed, e.g. shorting ETH/SOL)
    • Gate 7 — vs Buy & Holdfail (0 of 5 timeframes beat holding)

    Keltner is another breakout with no trend to break into. Leaving the volatility band is only a good signal when a clean, sustained move follows — which is why it printed +110% shorting ETH’s downtrend and lost on choppy BTC. On the majors, price pokes past the band and slips back, over and over, for a slow bleed. Its edge lives at one band width and one kind of market, evaporates in 2025, and doesn’t beat holding on any timeframe. As the taught band-breakout rule, Keltner is a reject.

    FAQ

    Keltner is meant for pullbacks/mean-reversion, not breakouts.
    The band breakout is the most commonly taught Keltner trade, so that’s what we measured. A pullback (fade back to the EMA) is a different, opposite rule and would need its own six-gate test.

    It made +110% on ETH though.
    By shorting a coin that fell 40% — a single clean downtrend. It lost on BTC, BNB and XRP. Profiting only where a big clean trend happened to exist is trend-luck, and the yearly (−57% in 2025) and out-of-sample gates confirm it doesn’t generalize.

    Can I replicate this?
    Yes — Keltner EMA(20) ± 2×ATR breakout, public Binance data, 0.06%/side, five coins, nine timeframes. Every table reproduces.

    See also: Donchian / Turtle, Bollinger reversion, Triple SuperTrend, UT Bot, and the conditional passes VWAP and Ichimoku (daily).


    Disclaimer: educational research, not financial advice. Past performance does not guarantee future results. Never trade money you cannot afford to lose.
  • Donchian / Turtle Breakout Strategy Backtest: the Legend That Crypto Chop Shredded

    Donchian / Turtle Breakout Strategy Backtest: the Legend That Crypto Chop Shredded

    In 1983 the commodity trader Richard Dennis made a bet with his partner William Eckhardt: can trading be taught? Dennis recruited novices through a newspaper ad, handed them a handful of mechanical rules, and — as the legend goes — they went on to make hundreds of millions of dollars. That is the most famous story in trading, the Turtle Traders, and its core entry rule is today’s subject: the Donchian channel breakout.

    The rule is beautifully simple. When price closes above the highest high of the last 20 bars, go long; when it closes below the 20-bar low, go short. You catch a trend at the moment it breaks out and ride it until the opposite signal. Forty years on, “breakouts” are still sold relentlessly in courses and on YouTube. So does the most famous breakout system in history survive on 2024–26 crypto? We swept it across 5 coins, 9 timeframes, and four more axes. Verdict: reject — but the sensitivity analysis reveals something more interesting than a plain failure: a result that turns the Turtle philosophy against itself.

    Methodology

    We never judge on a single setting — one good result can be luck or cherry-picking, so every axis is swept for robustness.

    • Data: Binance spot, Jul 2024–Jul 2026 (2 years), BTC/ETH/SOL/BNB/XRP
    • Timeframes: 5m–1D (9 buckets, incl. resampled)
    • Execution: on the bar close, no look-ahead (the channel uses only the prior 20 bars)
    • Friction: 0.06%/side (real); we also report the 0-fee gross so you can see the raw edge
    • Benchmark: buy & hold. Six robustness axes: timeframe, parameter, TP:SL, multi-coin, yearly, out-of-sample

    Gate 0 — Fidelity

    Standard Donchian: the upper channel is the highest high and the lower channel the lowest low of the prior 20 bars (the window is shifted back one candle so the signal never peeks at the current bar). Close above the upper channel → long; close below the lower → short. This is the Turtle entry, reproduced without distortion (pass).

    The Exact Rules

    • Signal: close breaks the 20-bar high → long; breaks the 20-bar low → short (stop-and-reverse)
    • Default: channel length 20 (the classic Turtle system)
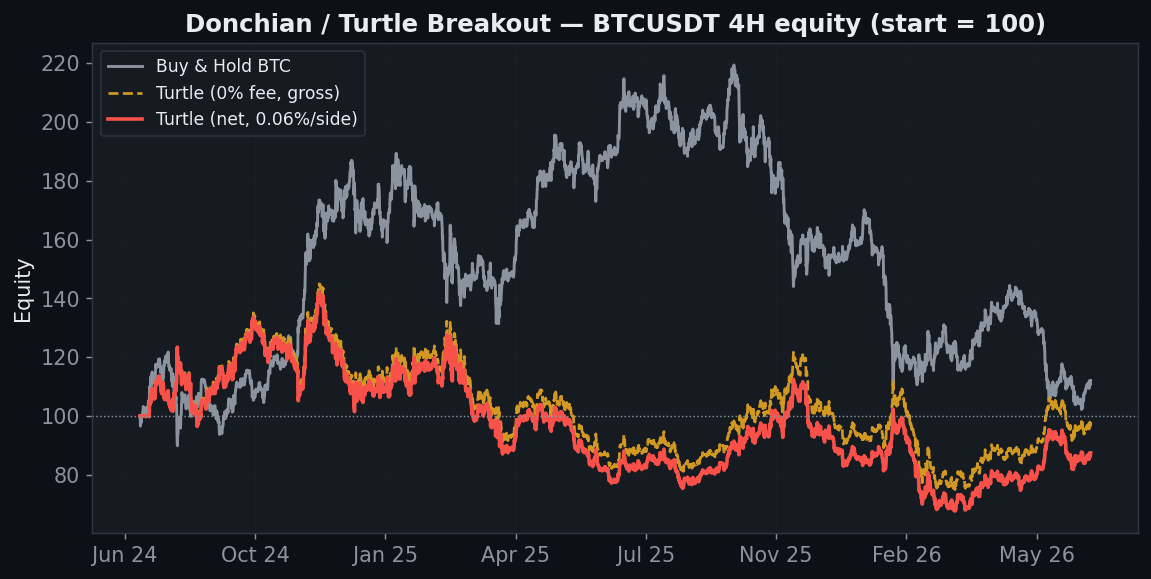
    Donchian Turtle breakout BTC 4H equity minus 13 percent net, gross near minus 2 percent, buy and hold plus 12

    On BTC 4H the Turtle ends at −13% while simply holding was +12%. The number that matters, though, is the gross (0-fee) line — it finishes near −2%. Losing without paying a cent in fees means this isn’t “friction ate the edge”; it’s that there is almost no gross edge to begin with on the majors. A good strategy has a large gross return that costs merely shrink. The Turtle starts near zero.

    Why It Bleeds: the Curse of Chop

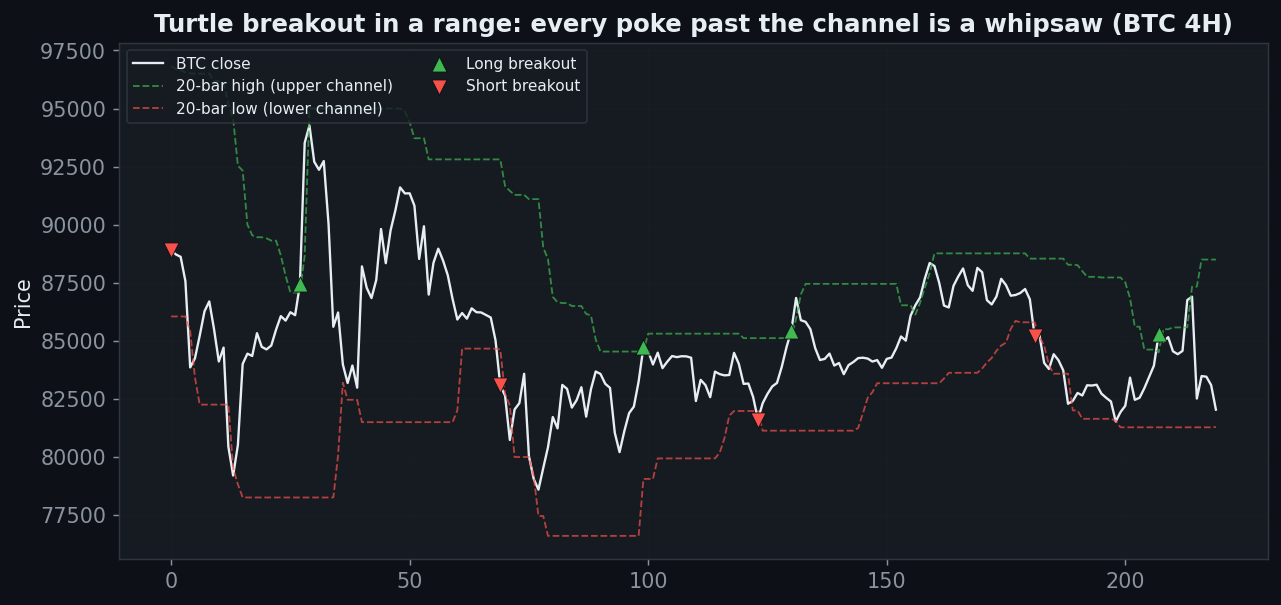
    Donchian 20-bar channel on BTC 4H, breakouts in a range whipsaw, long and short pokes fail repeatedly

    The mechanism is in this one chart. Crypto majors spend most of their time ranging, not trending. Inside a range, every poke above the 20-bar high fires a long — and price falls straight back into the channel. It pokes below, the system flips short, and price rebounds. A rule built to catch trends turns every breakout into a false signal when there’s no trend, and being stop-and-reverse it takes the bait every single time: 94 flips on 4H, 5,268 on the 5-minute. The rule that made legends in the quietly-trending futures of the 1980s gets sawn apart by sideways crypto.

    Axis 1 — Timeframe (gross vs net)

    Fast charts fire too often (fee-bleed); slow charts enter too late. We swept nine buckets on BTC.

    Timeframe Trades Gross (0 fee) Net (real)
    5m 5,268 −69% −100%
    15m 1,666 −60% −95%
    30m 811 −18% −69%
    1h 388 −26% −53%
    2h 190 +8% −14%
    4h 94 −2% −13%
    6h 68 −22% −28%
    12h 36 −18% −22%
    1D 18 −24% −26%

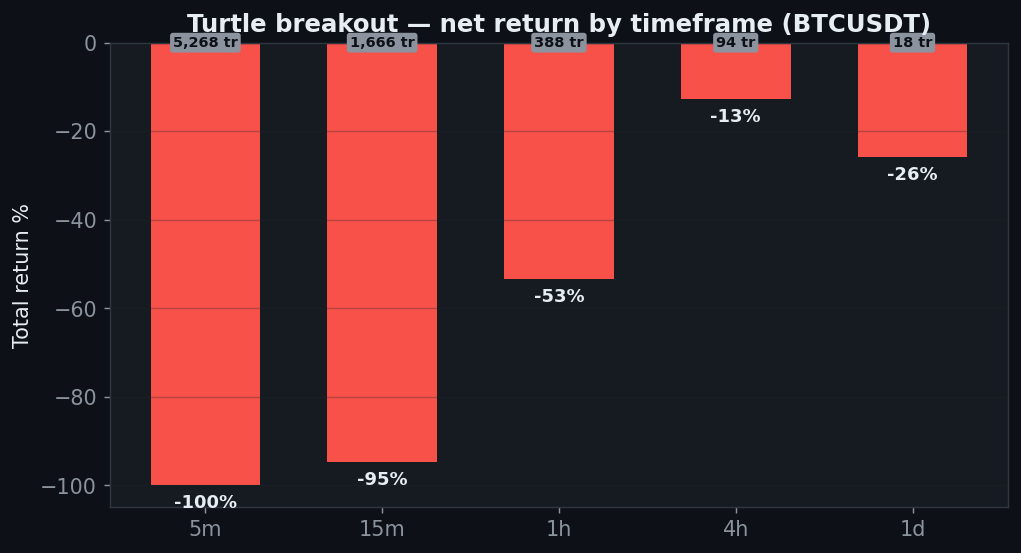
    Zero timeframes are net-positive. The only gross-positive bucket is 2H at +8% — and 190 trades of fees turn that into −14%. Everything else is negative before fees. The 5,268-trade 5-minute is textbook over-trading suicide.

    Turtle breakout net return by timeframe all negative, minus 100 on 5 minute, minus 26 on daily

    Axis 2 — Channel Length (parameter)

    Is the default 20 just an unlucky value? We swept the channel length on BTC 4H.

    Channel length Net PF
    10 −11% 1.09
    15 −13% 1.07
    20 (default) −13% 1.05
    25 −44% 0.83
    30 −29% 0.94
    40 +93% 1.93
    55 +14% 1.29
    80 −43% 0.80

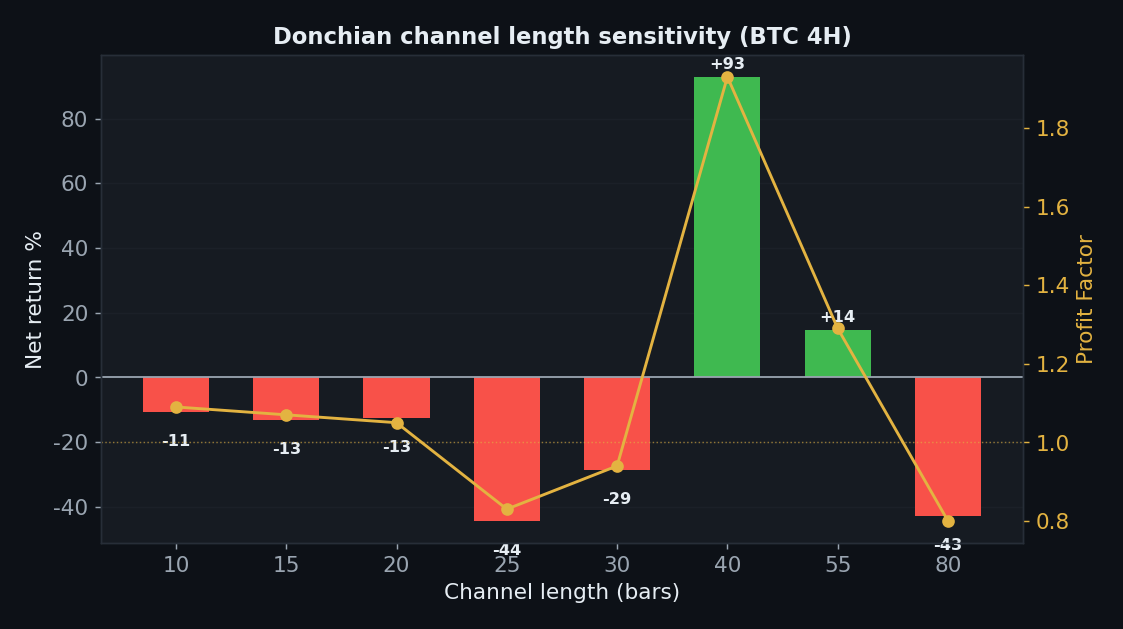
    Here honesty matters. 40 bars prints +93% and 55 bars +14% — but the neighbours collapse: 25 (−44%), 30 (−29%), 80 (−43%). A surface that swings from −44% to +93% between adjacent settings isn’t an edge, it’s over-fitting noise. The 40-bar spike is one channel width that happened to land on a couple of BTC’s big waves; move to another length or coin and it evaporates. That most lengths — the default 20 included — lose is the real signal.

    Donchian channel length sensitivity BTC 4H, chaotic surface, 40-bar spike plus 93 is overfit noise, default 20 loses

    Axis 3 — TP:SL (and the Turtle’s own philosophy, betrayed)

    The Turtle creed is “cut losses short, let winners run.” So what happens when we vary the take-profit? We fixed the stop at 2.5×ATR and swept the TP:SL ratio on BTC 4H.

    TP:SL Net PF
    1:0.5 +21% 1.26
    1:1 +18% 1.16
    1:1.5 +17% 1.14
    1:2 −24% 0.89
    1:2.5 −22% 0.92
    1:3 −12% 0.99
    1:4 −11% 1.01
    1:5 −4% 1.06

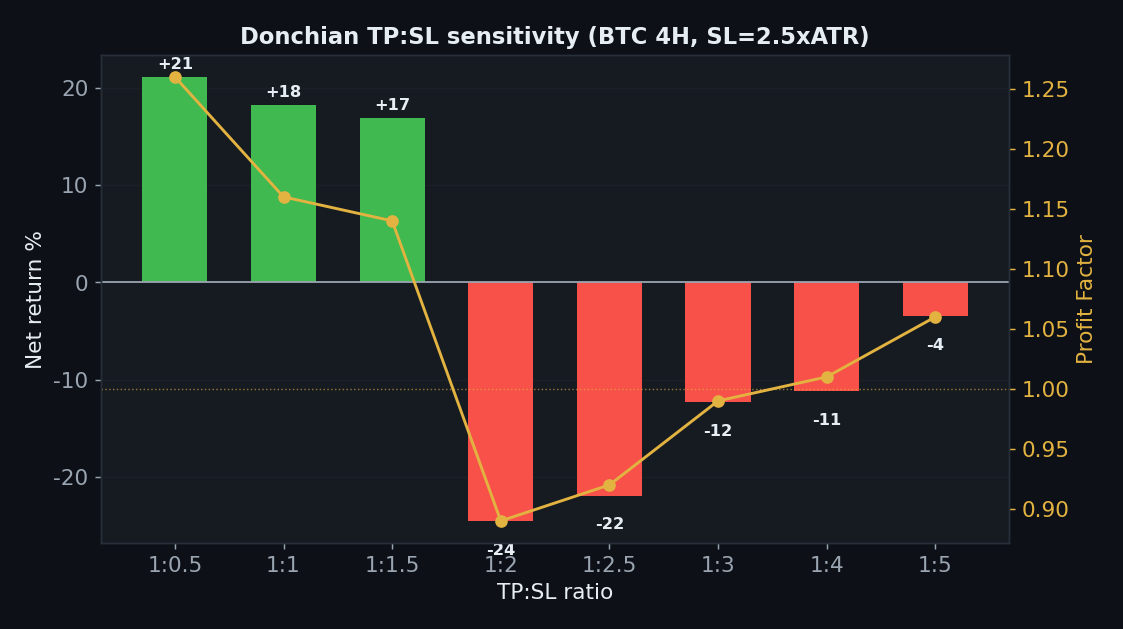
    A stunning reversal: only the tight take-profits (1:0.5 to 1:1.5) are positive (+17% to +21%), while every “let it run” wide target (1:2 and beyond) loses. In other words, the only way this breakout made money was by grabbing a small profit immediately and getting out — scalping the breakout, the exact opposite of the Turtle’s “let winners run.” To profit with the Turtle rule on crypto you’d have to stop being a Turtle. And even that edge is a shallow, single-coin, single-timeframe result.

    Donchian TP:SL sensitivity BTC 4H, only tight take-profit 1 to 0.5 through 1.5 positive, wide let-it-run targets all negative

    Axis 4 — Five Coins (strategy vs buy & hold)

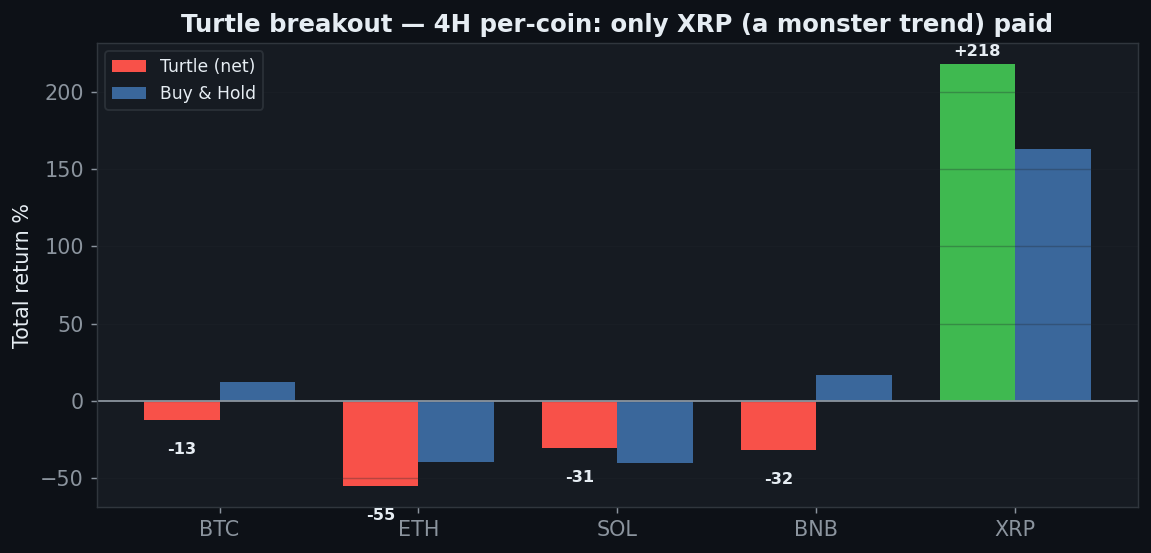
    Coin Turtle net Buy & Hold Excess
    BTC −13% +12% −25pp
    ETH −55% −40% −15pp
    SOL −31% −40% +9pp
    BNB −32% +17% −49pp
    XRP +218% +163% +55pp

    Only one coin (XRP, 1 of 5) ends net-positive, because XRP trended monstrously and the breakout caught the ride. SOL merely lost less than holding; it’s still −31%. A system that only truly profits on the single cleanest trend in the sample isn’t an edge — it’s trend-luck.

    Turtle breakout five coins 4H, only XRP positive plus 218, BTC ETH SOL BNB negative

    Axis 5 — Yearly (regime dependence)

    Year BTC 4H net
    2024 +11%
    2025 −25%
    2026 (to Jul) +5%

    Two of three years are positive — but 2025’s −25% sinks the whole total (−13%). It earns in years with a trend and hemorrhages in the year that ranged. If you can’t know in advance which year will trend, that spread is the risk.

    Axis 6 — Friction & Out-of-Sample

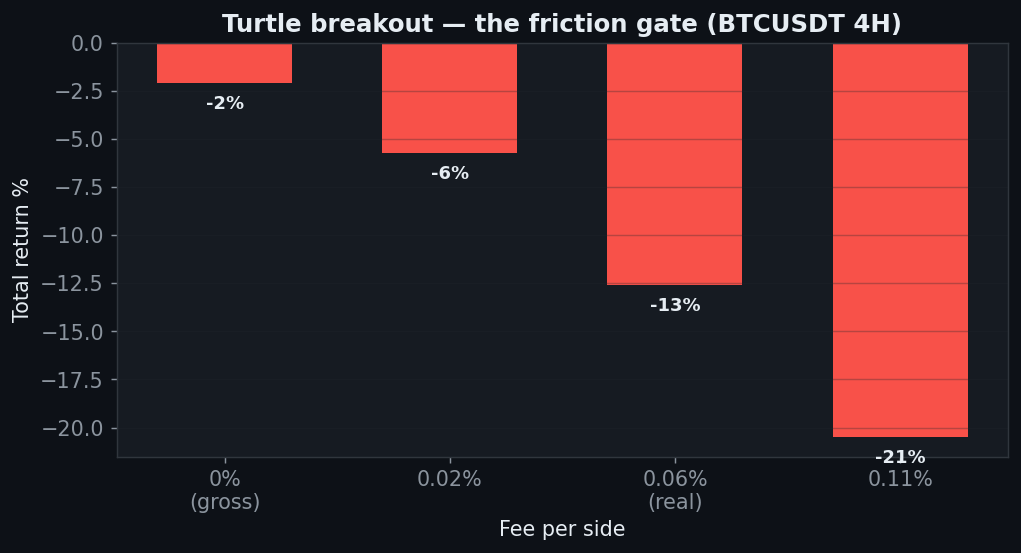
    Turtle breakout friction gate, minus 2 percent gross to minus 13 percent net on BTC 4H

    Friction gate (BTC 4H): −2% at zero fees → −6% at 0.02% → −13% at 0.06% → −21% at 0.11%. As we saw, it’s already negative gross, so fees aren’t even the main culprit — there’s nothing to harvest. Out-of-sample: train on the first 18 months, test on the last 6, and only 1 of 5 coins stays positive out-of-sample. The in-sample winners mostly collapse.

    The Verdict: REJECT

    • Gate 0 — Indicator fidelitypass (standard 20-bar Donchian, the classic Turtle rule, no look-ahead)
    • Gate 1 — Sanitypass (channel from the prior 20 bars; signal on the closed bar)
    • Gate 2 — Frictionfail (already −2% at zero fees on 4H, −13% net; 5m → −100%)
    • Gate 3 — Yearly consistencyfail (2024 +11 / 2025 −25 / 2026 +5 — 2025 sinks the total; regime-dependent)
    • Gate 4 — Out-of-samplefail (1 of 5 coins positive out-of-sample)
    • Gate 5 — Robustnessfail (parameter surface swings wildly; the default 20 loses; the 40-bar +93% is over-fit noise)
    • Gate 6 — Multi-marketfail (1 of 5 coins on 4H — only XRP, a monster trender)
    • Gate 7 — vs Buy & Holdfail (net-positive on total return for only one coin, XRP)

    The Turtle breakout is a trend engine with no trend to ride. Buying 20-bar highs works when a market trends quietly and persistently — the 1980s futures that made the Turtles famous. On 2024–26 crypto majors, which chop far more than they trend, it pokes in and out of a range hundreds of times and bleeds. The sharper lesson is in the sensitivity sweep: the only ways to make money with this rule were to curve-fit one channel length or to scalp tiny profits — a betrayal of the “let winners run” doctrine the Turtle is built on. It isn’t that breakouts are broken; it’s that a naked breakout is only as good as the trend behind it, and the majors didn’t provide one.

    FAQ

    The Turtles used stops, sizing and pyramiding, not just the entry.
    True — the full system layered ATR sizing, stops and unit-adds on top. Those shape the equity curve’s risk, but they can’t create an edge where the entry has none; money-management doesn’t turn a −2%-gross signal into a winner. And the TP:SL sweep above argues for short profits, which directly contradicts pyramiding and trend-riding.

    40 bars made +93% — why not use that?
    That’s the trap. Only 40 is a spike; 25/30/80 are −44/−29/−43%. A single tuned point rather than a smooth plateau is the signature of over-fitting; there’s no reason it repeats out-of-sample or on other coins.

    Breakouts work in stocks and futures, though.
    Often, in markets that trend persistently. The finding is narrow and honest: 2024–26 crypto majors ranged, and a bare 20-bar breakout gets whipsawed by chop. XRP shows what a real trend does for it (+218%).

    Can I replicate this?
    Yes — Donchian(20) channel breakout, public Binance data, 0.06%/side, five coins, nine timeframes. Every table above reproduces with the same method.

    See also: Triple SuperTrend, UT Bot, Range Filter, Parabolic SAR, and the conditional passes VWAP and Ichimoku (daily).


    Disclaimer: educational research, not financial advice. Past performance does not guarantee future results. Never trade money you cannot afford to lose.