After a long run of clean failures, Aroon looks like the exception. Tushar Chande’s 1995 trend indicator — Aroon Up and Aroon Down, measuring how recently price made a new high or low — traded as a simple crossover (long when Up is above Down, short when Down is above Up) produces a genuinely tempting backtest: +18.5% on BTC 4H net of fees, +29% on the daily, beating buy & hold on 3 of 5 coins. It passes the friction gate that kills most strategies. So is this finally a winner? We ran it through all six axes. Verdict: reject — and it’s the most important case on the site, because it shows exactly how a good-looking backtest lies.
Methodology
- Data: Binance spot, Jul 2024–Jul 2026 (2 years), BTC/ETH/SOL/BNB/XRP
- Timeframes: 5m–1D (9 buckets, incl. resampled)
- Execution: Aroon(14) on the closed bar, no look-ahead; long when Aroon Up > Aroon Down, short when Down > Up
- Friction: 0.06%/side (real); 0-fee gross reported too. Benchmark: buy & hold
- Six axes: timeframe, period, TP:SL, multi-coin, yearly, out-of-sample
Gate 0 — Fidelity
Standard Aroon(14): Aroon Up = 100 × (periods since the 14-bar high subtracted from 14) / 14, and the mirror for Down. Long on the Up/Down crossover, short on the reverse. Reproduced exactly (pass).
The Part That Looks Great
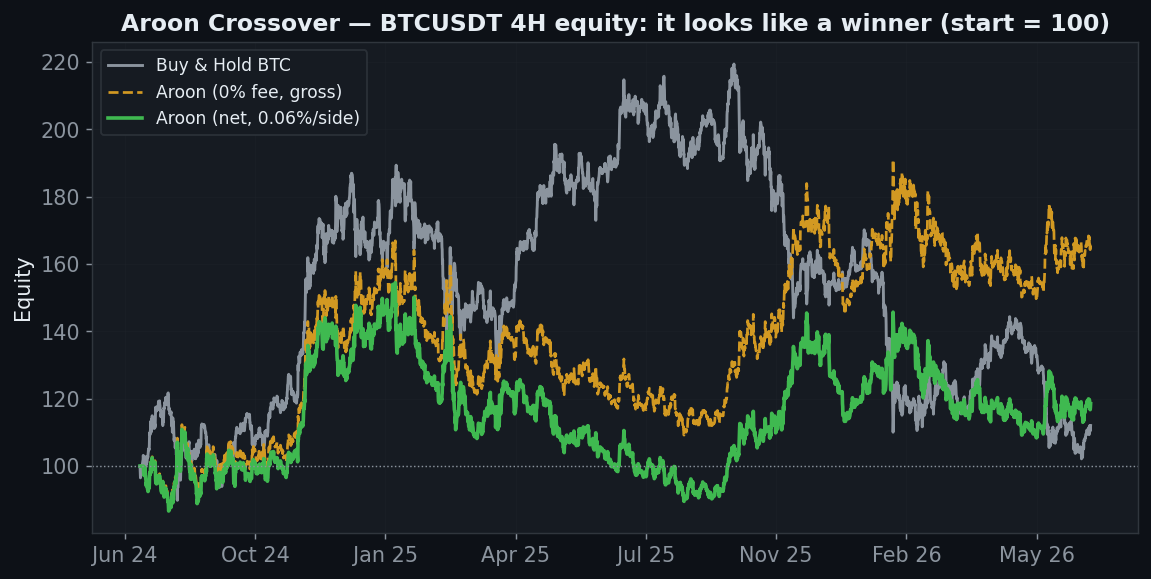
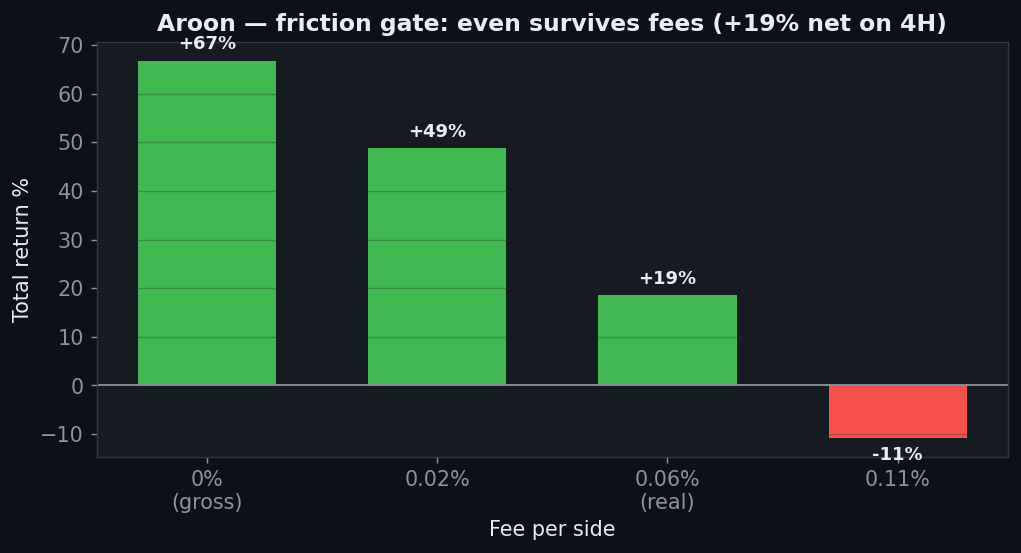
Unlike almost everything else on this site, the BTC 4H equity curve climbs. Net of real fees it ends +18.5%, ahead of buy & hold’s +12%. And the friction gate — the graveyard of momentum strategies — is passed comfortably: +67% gross, +19% net. On the higher timeframes it looks like a real trend-following edge.
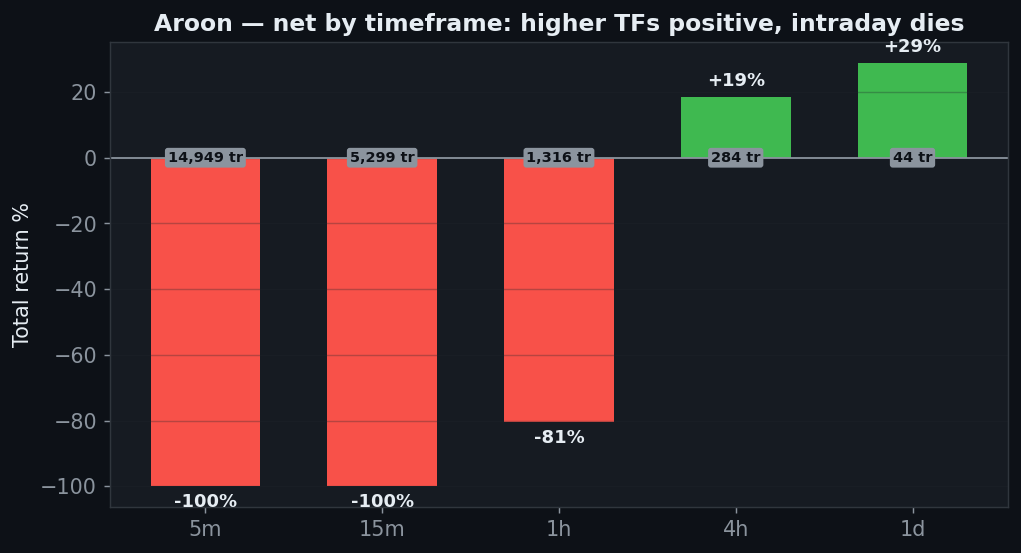
| Timeframe | Gross (0 fee) | Net (real) |
|---|---|---|
| 5m | −62% | −100% |
| 15m | −65% | −100% |
| 30m | −45% | −98% |
| 1h | −6% | −81% |
| 2h | −10% | −57% |
| 4h | +67% | +19% |
| 6h | −38% | −51% |
| 12h | +63% | +45% |
| 1D | +36% | +29% |
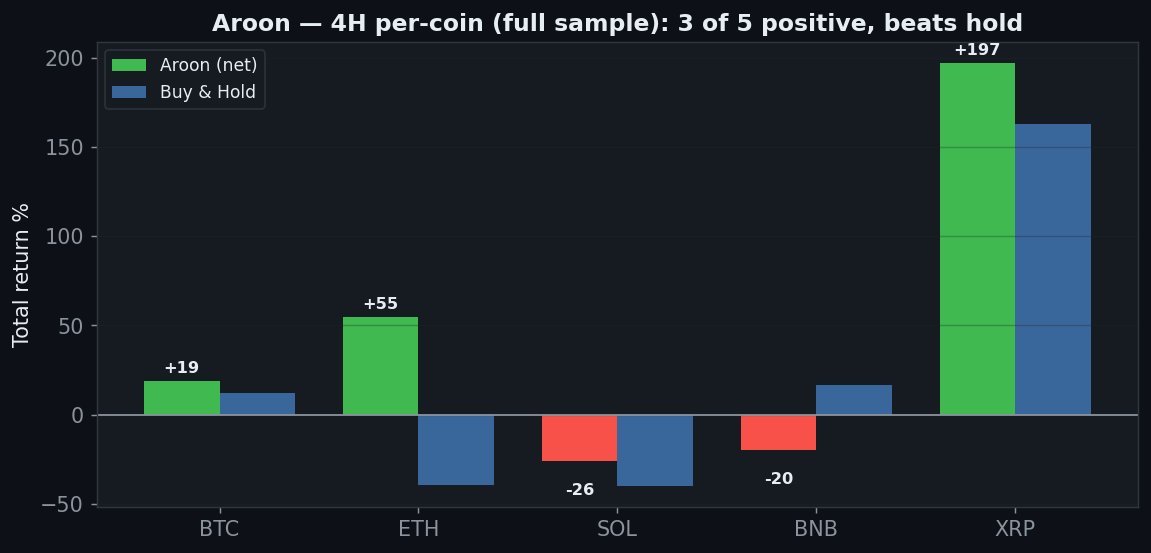
The daily is +29%, the 12-hour +45%. On 4H, three of five coins are net-positive (BTC +18%, ETH +55%, XRP +197%). If we stopped here, we’d call it a conditional pass. But two gates exist precisely to stop us from stopping here.
Kill Shot #1 — The Edge Exists at Exactly One Setting
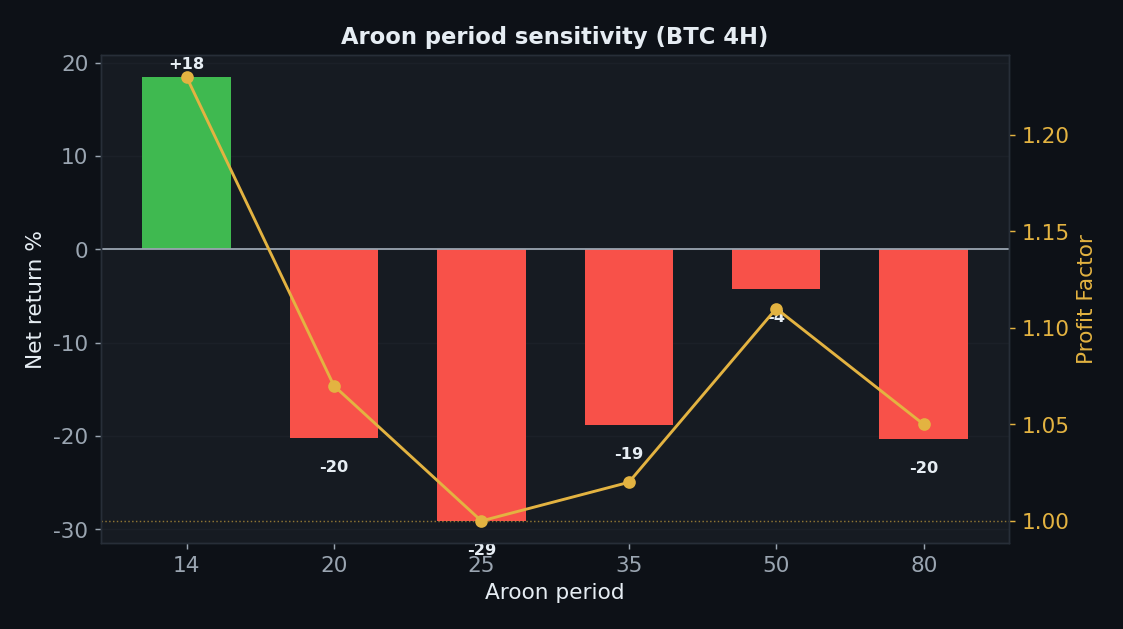
| Aroon period | Net | PF |
|---|---|---|
| 14 (default) | +18.5% | 1.23 |
| 20 | −20% | 1.07 |
| 25 | −29% | 1.00 |
| 35 | −19% | 1.02 |
| 50 | −4% | 1.11 |
| 80 | −20% | 1.05 |
Here is the first crack. That +18.5% is the Aroon period 14. Change it to 20, 25, 35, 50 or 80 and every single one loses. A real edge degrades gracefully as you nudge the parameter — you get a plateau of similar results. An over-fit edge is a lonely spike on one value with losses all around it, which is exactly what this is. The strategy didn’t find a market truth; it found the one number that happened to fit the last two years.
Kill Shot #2 — It Collapses Out-of-Sample
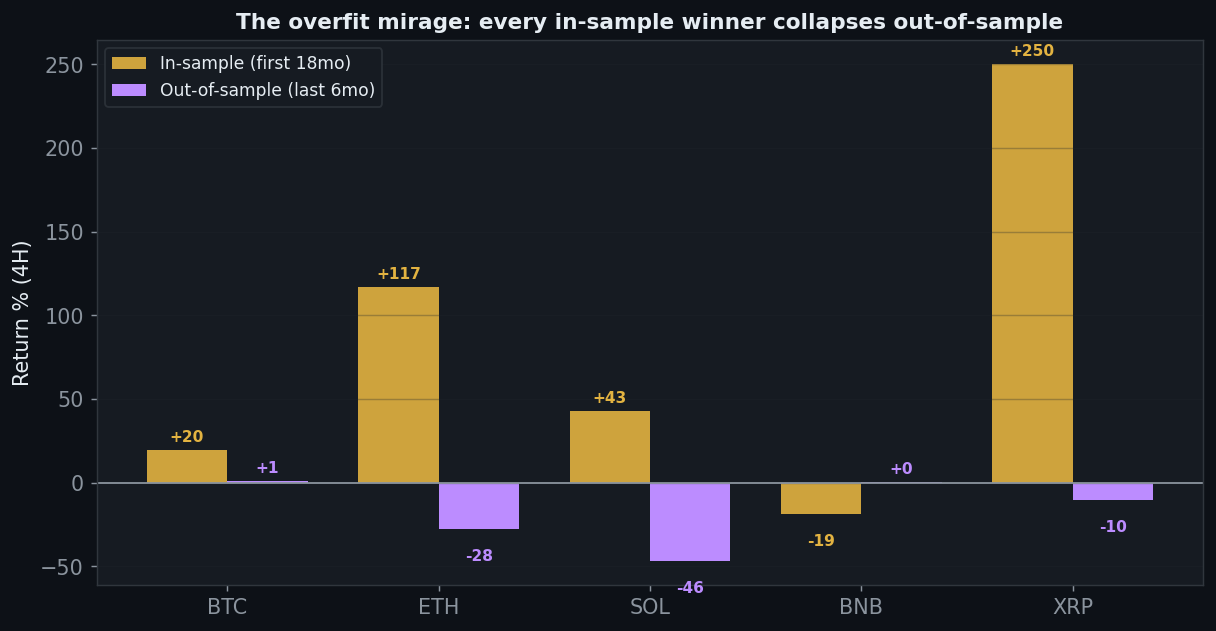
The decisive test. Train on the first 18 months, then look at the last 6 months the strategy never “saw”:
| Coin | In-sample (18mo) | Out-of-sample (6mo) |
|---|---|---|
| BTC | +20% | +1% |
| ETH | +117% | −28% |
| SOL | +43% | −47% |
| BNB | −19% | +1% |
| XRP | +250% | −11% |
Every in-sample winner collapses. ETH goes from +117% to −28%. SOL from +43% to −47%. XRP from +250% to −11%. Only BTC and BNB scrape a fraction of a percent positive out-of-sample. The gorgeous full-sample numbers were the strategy memorising 2024–25, not discovering anything that carries into the future. This is the single clearest picture of overfitting we’ve produced.
The Other Axes
| TP:SL | Net | PF |
|---|---|---|
| 1:0.5 | +11% | 1.07 |
| 1:1 | −2% | 1.03 |
| 1:1.5 | +14% | 1.08 |
| 1:2 | +20% | 1.10 |
| 1:2.5 | +7% | 1.07 |
| 1:3 | +7% | 1.07 |
| 1:4 | −10% | 1.01 |
| 1:5 | +8% | 1.08 |
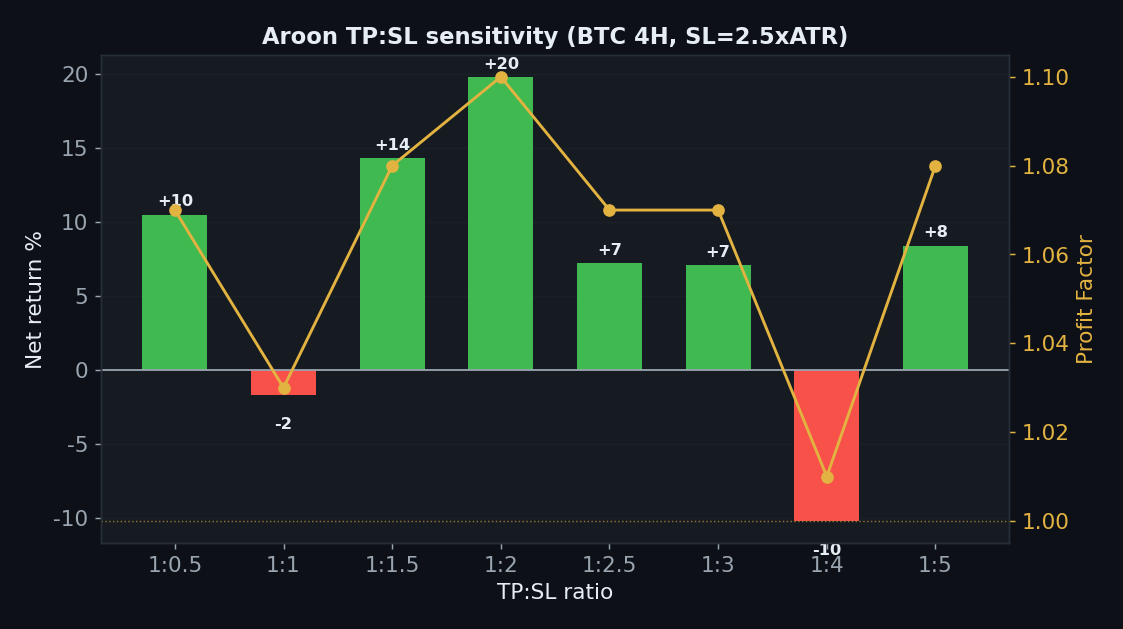
TP:SL variants are mostly mildly positive (a point in its favour), and the yearly split is 2 of 3 positive (2024 +35%, 2026 +3%, 2025 −15%). Those are the crumbs that make an over-fit strategy so seductive — it isn’t random, it genuinely rode 2024’s trends. But “rode the specific past” and “has an edge going forward” are different claims, and the out-of-sample gate is the referee.
| Year | BTC 4H net |
|---|---|
| 2024 | +35% |
| 2025 | −15% |
| 2026 (to Jul) | +3% |
The Verdict: REJECT
- Gate 0 — Indicator fidelity — pass (standard Aroon(14) crossover)
- Gate 1 — Sanity — pass (signal on the closed bar, no look-ahead)
- Gate 2 — Friction — pass (+67% gross, +19% net on 4H — a rare pass)
- Gate 3 — Yearly consistency — partial (2024 +35 / 2025 −15 / 2026 +3)
- Gate 4 — Out-of-sample — fail (in-sample winners collapse: ETH +117→−28, XRP +250→−11)
- Gate 5 — Robustness — fail (profitable at period 14 only; every other period loses — curve-fit)
- Gate 6 — Multi-market — partial (full sample) / fail (out-of-sample) (3/5 in-sample, collapses out)
- Gate 7 — vs Buy & Hold — partial (beats on 4H in-sample; not out-of-sample)
Aroon is the backtest that lied — and the most useful one to study. It passes friction, beats buy & hold on three coins, and posts a +18.5% 4H curve, which is why it’s so easy to fall for. But its edge lives at exactly one parameter value (period 14) and evaporates the moment you test it on unseen data, where every in-sample winner turns negative. A strategy that only works at one setting and can’t repeat out-of-sample hasn’t found an edge; it has memorised the past. That’s the definition of over-fitting, and it’s why out-of-sample and parameter robustness — not the headline return — decide a verdict here.
FAQ
But it beat buy & hold — how is that a reject?
On the full sample and at one parameter, yes. The reject is because that result doesn’t survive the two tests that estimate future performance: change the period and it loses; test on unseen data and it loses. Beating hold on data you fit to is not evidence of a forward edge.
Couldn’t you just trade it on the daily/12H where it’s strongest?
The out-of-sample collapse is measured on the same higher-timeframe logic; the in-sample daily/4H strength is exactly what fails to repeat. Cherry-picking the best in-sample window is how overfitting is done, not how it’s fixed.
Can I replicate this?
Yes — Aroon(14) crossover, public Binance data, 0.06%/side, five coins, nine timeframes, an 18/6-month out-of-sample split. Every table reproduces.
See also: Williams %R, ADX / DMI, Donchian / Turtle, Triple SuperTrend, and the conditional passes VWAP and Ichimoku (daily).
Disclaimer: educational research, not financial advice. Past performance does not guarantee future results. Never trade money you cannot afford to lose.