The True Strength Index is a double-smoothed momentum oscillator — a close cousin of TRIX, which earned a conditional pass. Does TSI clear the same bar? We ran the standard TSI(25,13) through the 7-Gate Protocol. Verdict: reject.
Methodology
- Data: Binance spot, Jul 2024–Jul 2026 (2 years), BTC/ETH/SOL/BNB/XRP
- Timeframes: 5m–1D (9 buckets, incl. resampled)
- Execution: TSI is a double-smoothed ratio of price momentum. Long when TSI crosses above its signal line, short when below. Closed-bar, no look-ahead
- Friction: 0.06%/side (real); 0-fee gross reported too. Benchmark: buy & hold
- Six axes: timeframe, tsi slow, TP:SL, multi-coin, yearly, out-of-sample
Gate 0 — Fidelity
TSI is a double-smoothed ratio of price momentum. Long when TSI crosses above its signal line, short when below. Reproduced exactly (pass).
How It Behaves
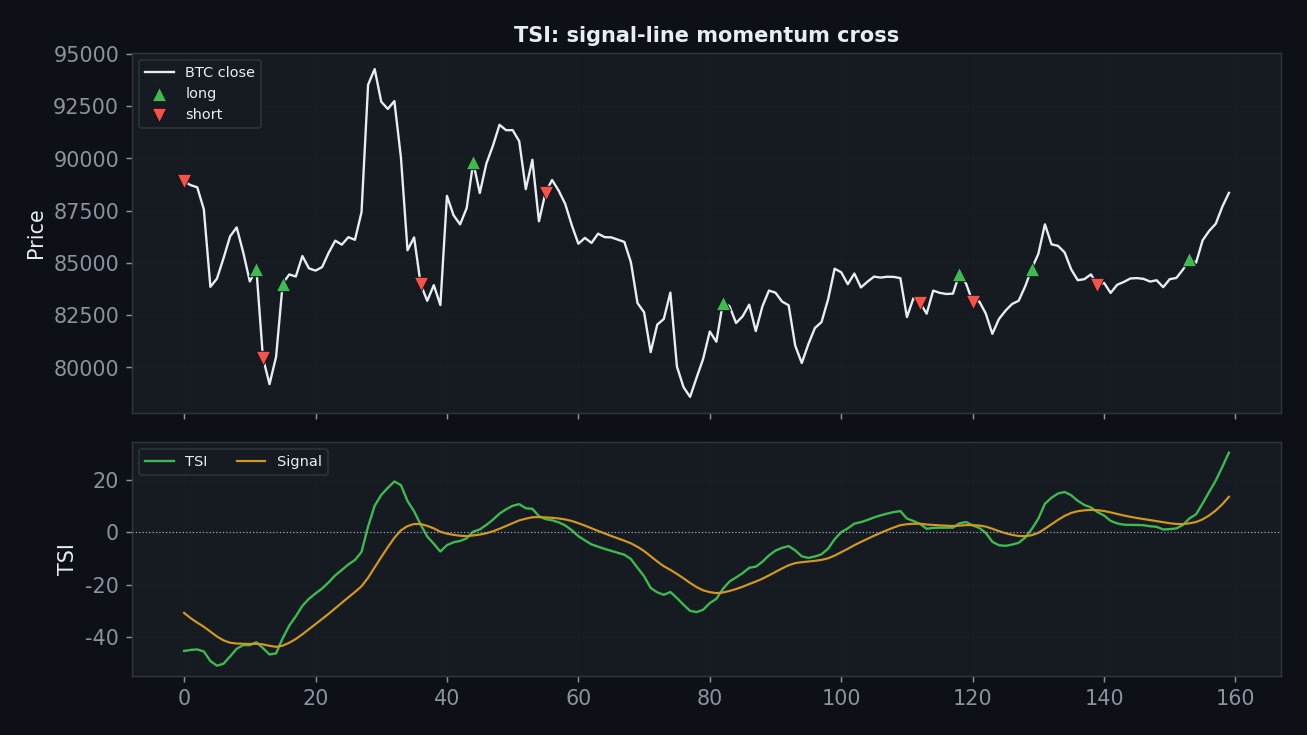
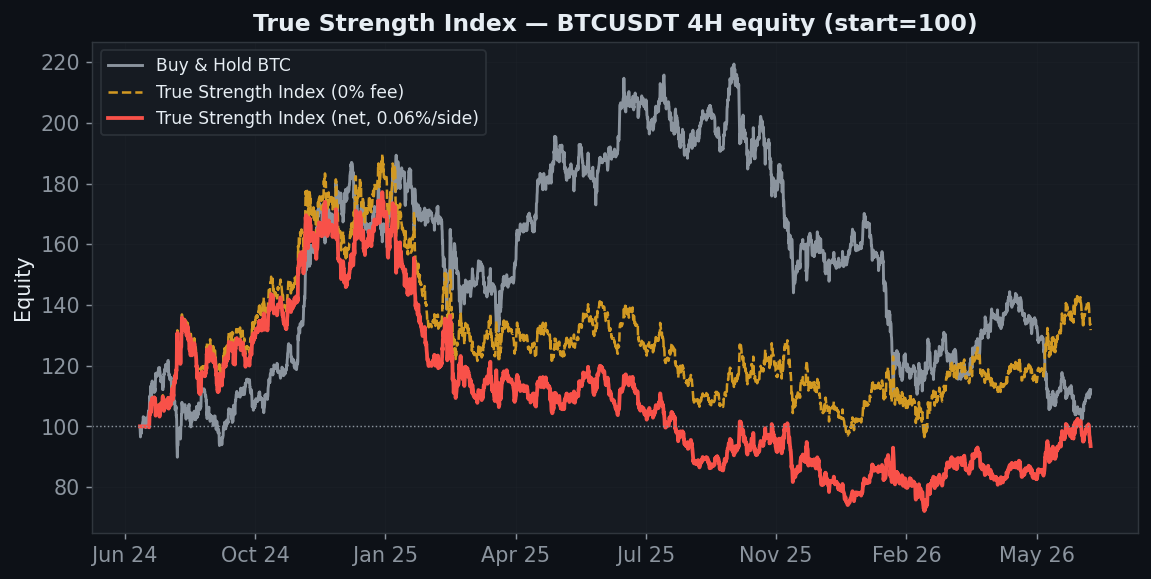
Like TRIX, TSI is heavily smoothed. But the signal-line cross fires more often than TRIX’s, and on the 4H the default settings produce a small net loss — the smoothing isn’t enough to overcome the whipsaw at this speed.
Axis 1 — Timeframe
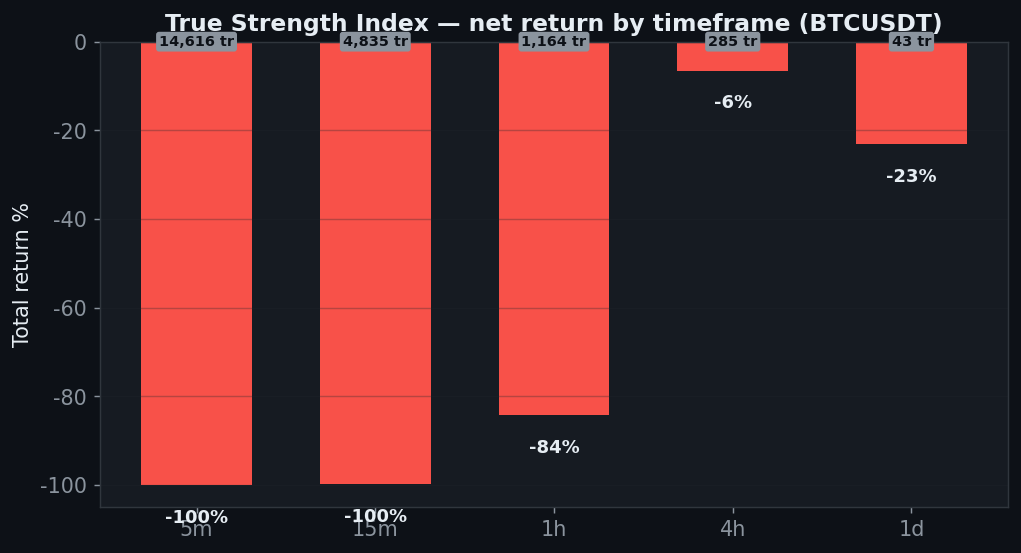
| Timeframe | Trades | Gross (0 fee) | Net (real) |
|---|---|---|---|
| 5분 | 14,616 | −39% | −100% |
| 15분 | 4,835 | −25% | −100% |
| 30분 | 2,286 | +68% | −89% |
| 1시간 | 1,164 | −36% | −84% |
| 2시간 | 568 | +5% | −47% |
| 4시간 | 285 | +32% | −6% |
| 6시간 | 204 | −25% | −41% |
| 12시간 | 79 | +47% | +33% |
| 1일 | 43 | −19% | −23% |
Every timeframe is net-negative, including the 4H (−6.5%) and daily (−23%). Unlike TRIX, TSI has no timeframe where the standard settings pay.
Axis 2 — TSI slow
| TSI slow | Net | PF |
|---|---|---|
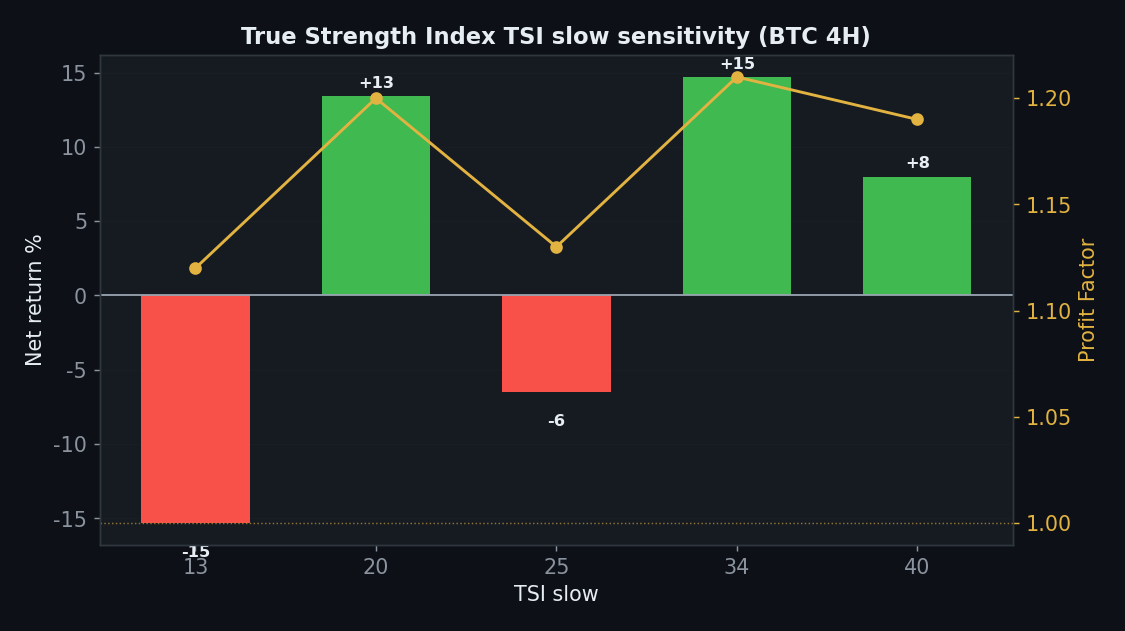
| 13 | −15% | 1.12 |
| 20 | +13% | 1.20 |
| 25 | −6% | 1.13 |
| 34 | +15% | 1.21 |
| 40 | +8% | 1.19 |
Tellingly, the taught slow length (25) loses; only 20, 34 and 40 are positive. The default sits in a losing pocket surrounded by mixed results — the opposite of a stable plateau.
Axis 3 — TP:SL
| TP:SL | Net | PF |
|---|---|---|
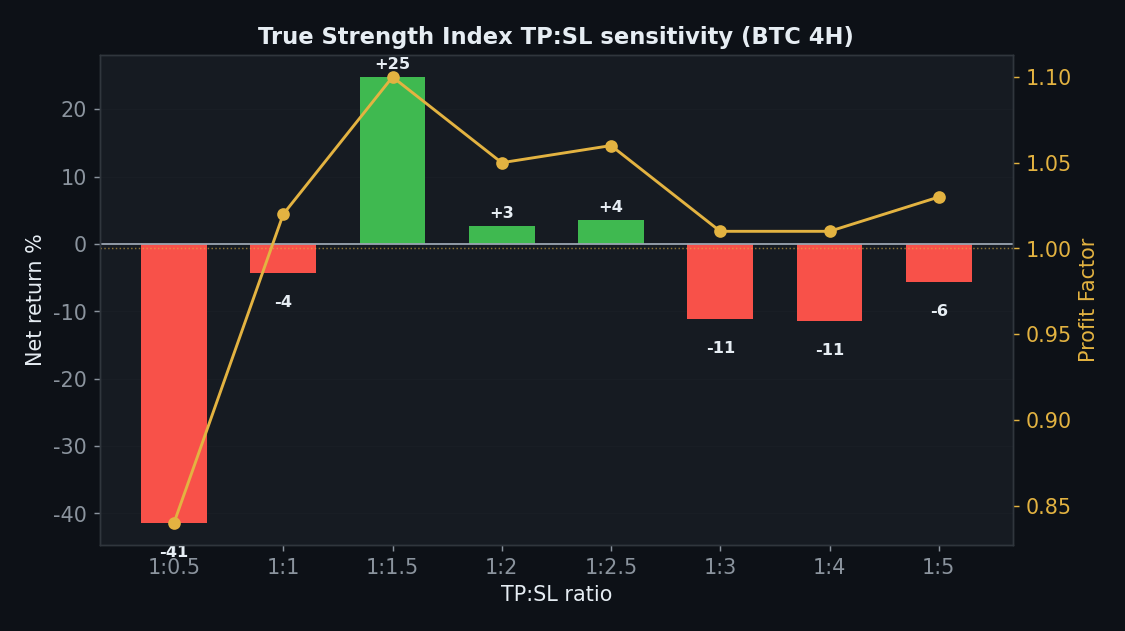
| 1:0.5 | −41% | 0.84 |
| 1:1 | −4% | 1.02 |
| 1:1.5 | +25% | 1.10 |
| 1:2 | +3% | 1.05 |
| 1:2.5 | +4% | 1.06 |
| 1:3 | −11% | 1.01 |
| 1:4 | −11% | 1.01 |
| 1:5 | −6% | 1.03 |
Only 3 of 8 TP:SL ratios are positive. A weak, inconsistent exit surface.
Axis 4 — Five Coins
| Coin | Strategy net | Buy & Hold |
|---|---|---|
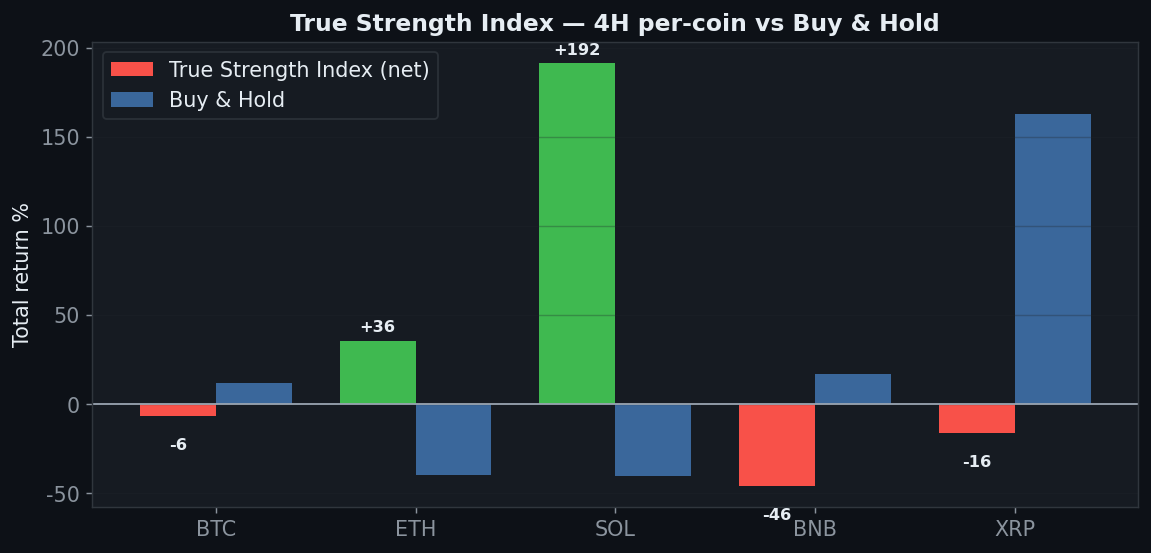
| BTC | −6% | +12% |
| ETH | +36% | −40% |
| SOL | +192% | −40% |
| BNB | −46% | +17% |
| XRP | −16% | +163% |
2 of 5 positive, and the headline (SOL +192%) is a coin that fell 40% — a shorted downtrend, not a beat over a rising benchmark. ETH is the only other winner; BTC, BNB and XRP lose.
Axis 5 — Yearly
| Year | BTC 4H net |
|---|---|
| 2024 | +60% |
| 2025 | −53% |
| 2026 | +24% |
2024 +60%, 2025 −53%, 2026 +24%. A catastrophic chop year, unlike TRIX which stayed positive through 2025.
Axis 6 — Friction
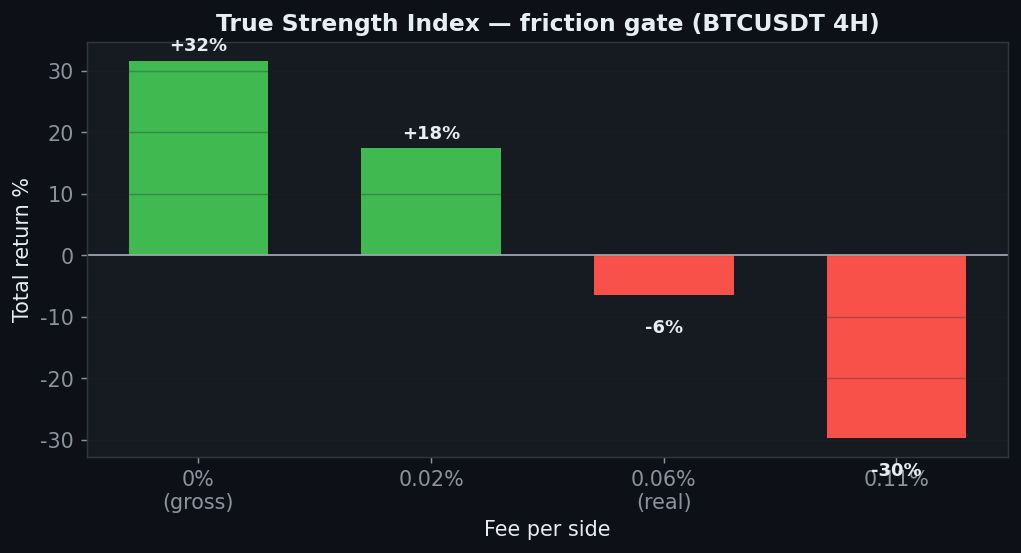
+32% gross → −6.5% net → −30% at 0.11%. The gross edge doesn’t survive real fees at this trade count.
The Verdict: REJECT
- Gate 0 — Indicator fidelity — pass (standard TSI(25,13))
- Gate 1 — Sanity — pass
- Gate 2 — Friction — fail — +32% gross, −6.5% net on 4H
- Gate 3 — Yearly — fail — +60 / −53 / +24
- Gate 4 — Robustness (slow length) — fail — the default 25 loses; wins are non-default
- Gate 5 — Robustness (TP:SL) — fail — 3 of 8 positive
- Gate 6 — Multi-market — fail — 2 of 5, SOL win is a shorted downtrend
- Gate 7 — vs Buy & Hold — fail — negative on every timeframe
TSI is TRIX’s cousin, but it doesn’t clear the same bar. The taught default (25,13) loses on BTC 4H, is negative on all five timeframes, and — damningly — the standard slow length is one of the settings that loses. Its one eye-catching number, SOL +192%, is a shorted downtrend, not a benchmark-beating edge. Where TRIX survived 2025, TSI lost 53%. Reject.
FAQ
Why does TRIX pass but TSI doesn’t?
TRIX’s construction and default happen to land a robust daily edge that held through 2025; TSI’s signal-line cross fires more often, its default setting loses, and its 2025 was −53%. Similar family, different gate results — which is exactly why each indicator gets tested rather than assumed.
SOL made +192% though.
On a coin that fell 40% — that’s shorting a downtrend, not beating a rising market. BTC, BNB and XRP all lose, and the default settings lose on the 4H.
Can I replicate this?
Yes — TSI(25,13) signal cross, public Binance data, 0.06%/side, five coins, nine timeframes. Every table reproduces.
See also its cousin the conditional TRIX, and the rejects Awesome Oscillator and Chande Momentum.
Disclaimer: educational research, not financial advice. Past performance does not guarantee future results. Never trade money you cannot afford to lose.
Leave a Reply