The TTM Squeeze is a fan favourite. Bollinger Bands contract inside the Keltner Channels, the market coils, and then — the tutorials promise — it explodes out of the compression for an “easy” trend trade. The backtests you see flash profit factors of 3 and higher. We rebuilt the setup faithfully and tested it the honest way: full period, nine coins, realistic costs. The PF-3 headline dissolved into a near-breakeven drift that loses badly to simply holding. Here is how that mirage is manufactured.
The setup, exactly as taught
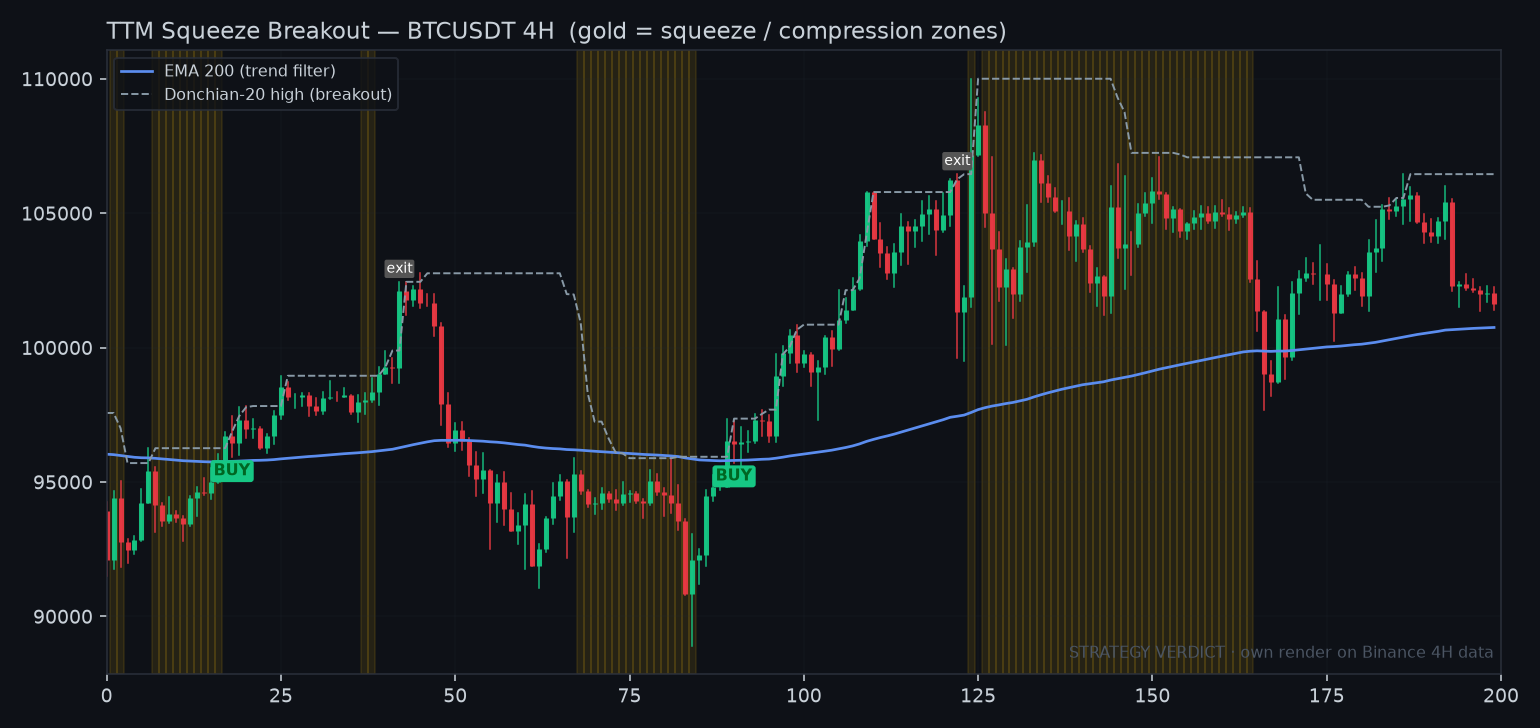
- Squeeze: Bollinger Bands (20, 2σ) inside Keltner Channels (20, 1.5×ATR) = compression. Wait for at least 6 consecutive squeezed bars.
- Trigger: when the squeeze releases, arm the setup; enter long on a Donchian-20 breakout (close crosses the prior 20-bar high).
- Trend filter: only take longs above the 200 EMA (shorts have no edge on crypto, so this is long-only).
- Exit: a Chandelier trailing stop at 3×ATR below the highest high since entry.
- Timeframe: 4-hour. Costs: 0.06% fee + 0.05% slippage per side.
The verdict at a glance
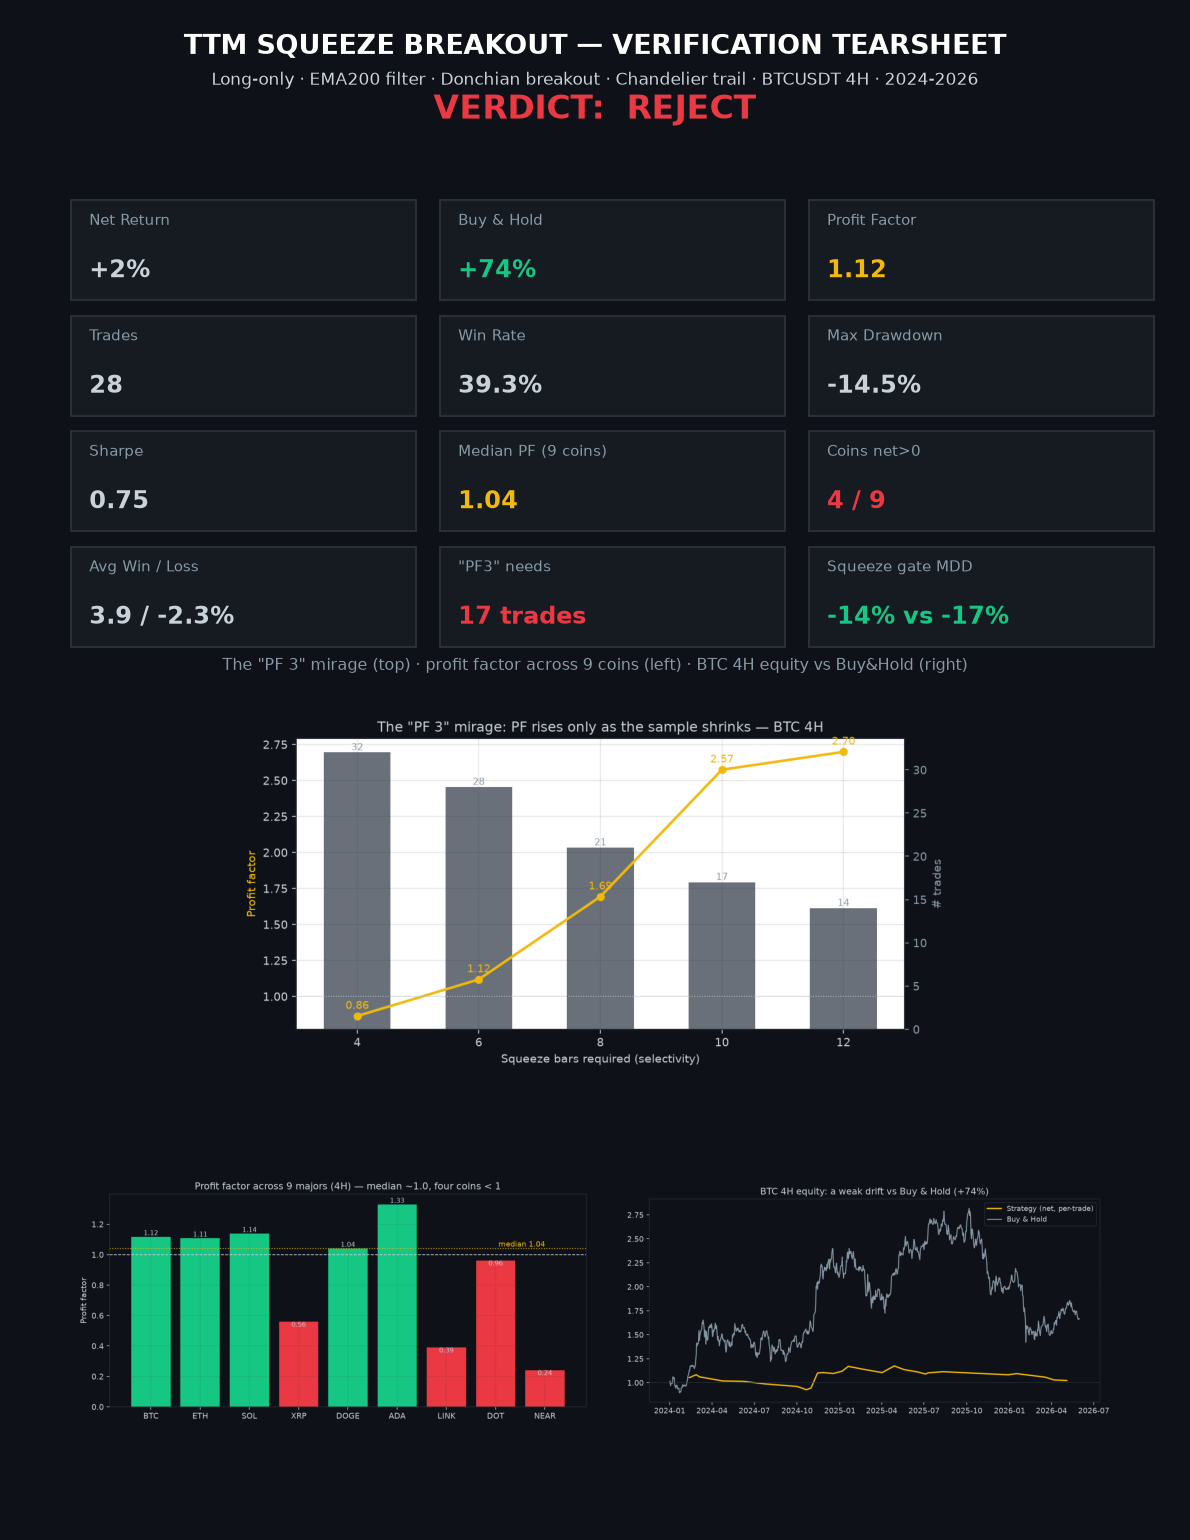
| Metric | Value |
|---|---|
| Net return (BTC 4H, after costs) | +2% |
| Gross (zero costs) | +9% |
| Buy & Hold, same window | +74% |
| Trades | 28 |
| Win rate | 39.3% |
| Profit factor | 1.12 |
| Max drawdown | −14.5% |
| Sharpe | 0.75 |
| Median profit factor (9 coins) | 1.04 |
The “PF 3” mirage
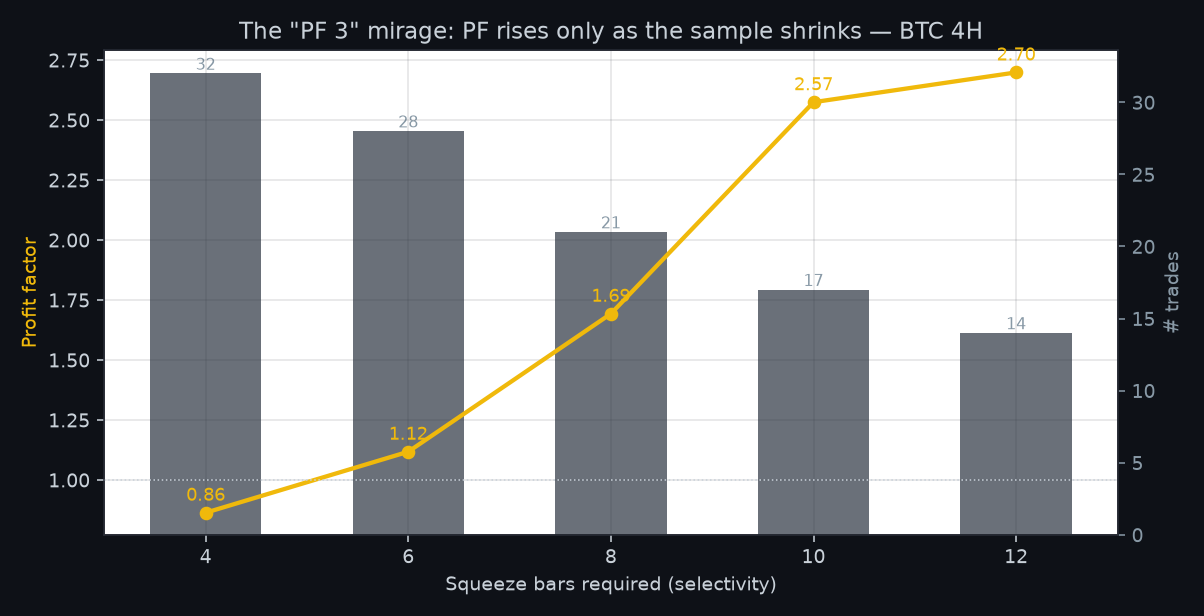
Here is the trick, laid bare. The strategy has one knob that quietly controls how selective it is: how many squeezed bars you require before arming a breakout. Watch what happens as you tighten it:
| Squeeze bars required | Trades | Profit factor | Net return |
|---|---|---|---|
| 4 | 32 | 0.86 | −9% |
| 6 (a reasonable default) | 28 | 1.12 | +2% |
| 8 | 21 | 1.69 | +17% |
| 10 | 17 | 2.57 | +27% |
| 12 | 14 | 2.70 | +25% |
There is your “profit factor 3.” It is real — and it is meaningless. To get it you crank the squeeze requirement so high that the system takes just 14 trades in two and a half years: a dozen lucky breakouts in a bull market. That is not an edge, it is a small sample. At an honest default of 6 bars the profit factor is 1.12; loosen it to 4 and it is already a loser. A metric that improves only as your evidence shrinks is not measuring skill — it is measuring luck.
It does not survive across coins
| Coin | Trades | Win rate | PF | Net | Buy & Hold |
|---|---|---|---|---|---|
| BTC | 28 | 39.3% | 1.12 | +2% | +74% |
| ETH | 25 | 28.0% | 1.11 | +0% | −12% |
| SOL | 22 | 50.0% | 1.14 | +3% | −20% |
| XRP | 27 | 29.6% | 0.56 | −32% | +117% |
| DOGE | 22 | 36.4% | 1.04 | −4% | +12% |
| ADA | 15 | 33.3% | 1.33 | +8% | −60% |
| LINK | 21 | 23.8% | 0.39 | −31% | −39% |
| DOT | 18 | 38.9% | 0.96 | −8% | −85% |
| NEAR | 15 | 20.0% | 0.24 | −41% | −37% |
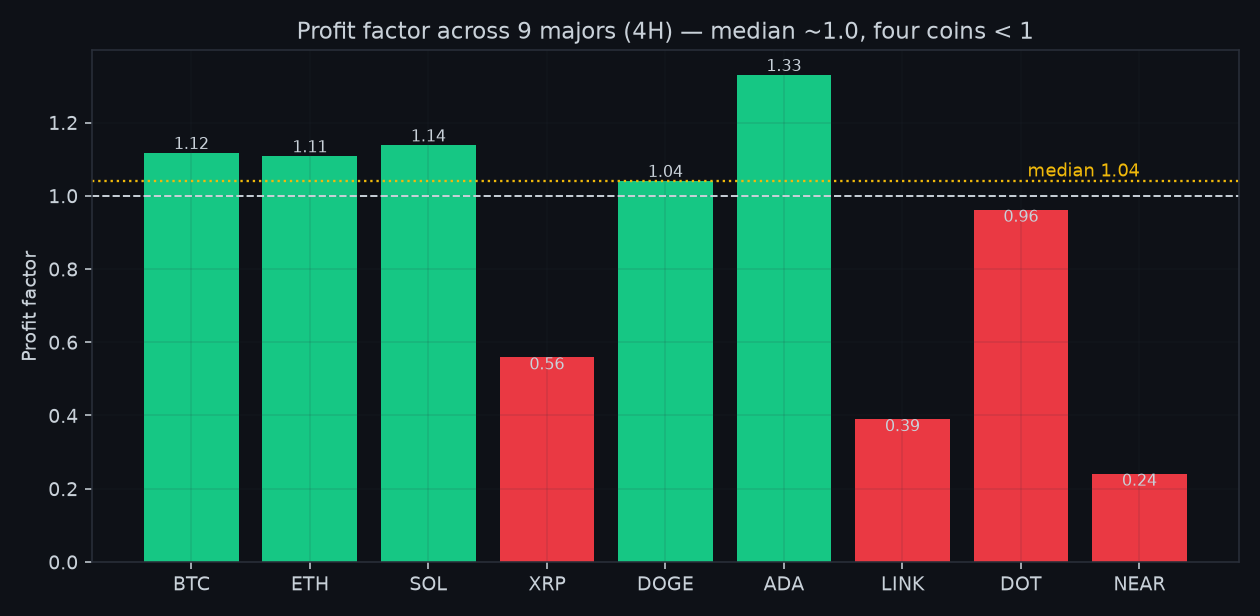
The median profit factor across nine majors is 1.04 — a coin-flip — and four of the nine lose money outright, with fat left tails (NEAR 0.24, LINK 0.39, XRP 0.56). And notice the two coins that actually rallied: BTC (+74%) and XRP (+117%). On both, holding crushed the strategy. The setup neither captures the trends that exist nor protects you in the ones that do not.
Credit where it is due: the squeeze gate is real
One honest finding survives. Compared with a bare Donchian breakout, adding the squeeze filter genuinely helps: it lifts BTC 4H profit factor from 1.07 to 1.12 and, more importantly, roughly halves the drawdown (from −24% to −14%). Compression really does select cleaner breakouts. But a filter that upgrades a losing breakout into a break-even one is a component, not a strategy. It belongs inside a system that already has an edge — it cannot be the edge.
Change every option: the full sensitivity sweep
A weak result invites the obvious question: is it just the wrong settings? We changed every knob the strategy has — the timeframe, the parameters, and the exit logic — one axis at a time on BTCUSDT. The picture never changes.
1. Timeframe (candle interval)
| Timeframe | Trades | Win rate | Profit factor | Net return |
|---|---|---|---|---|
| 5-minute | 862 | 15.4% | 0.18 | −93% |
| 15-minute | 366 | 23.5% | 0.30 | −73% |
| 30-minute | 203 | 22.7% | 0.29 | −64% |
| 1-hour | 109 | 22.9% | 0.32 | −47% |
| 4-hour (as taught) | 28 | 39.3% | 1.12 | +2% |
| 1-day | 3 | 33.3% | 0.80 | −3% |
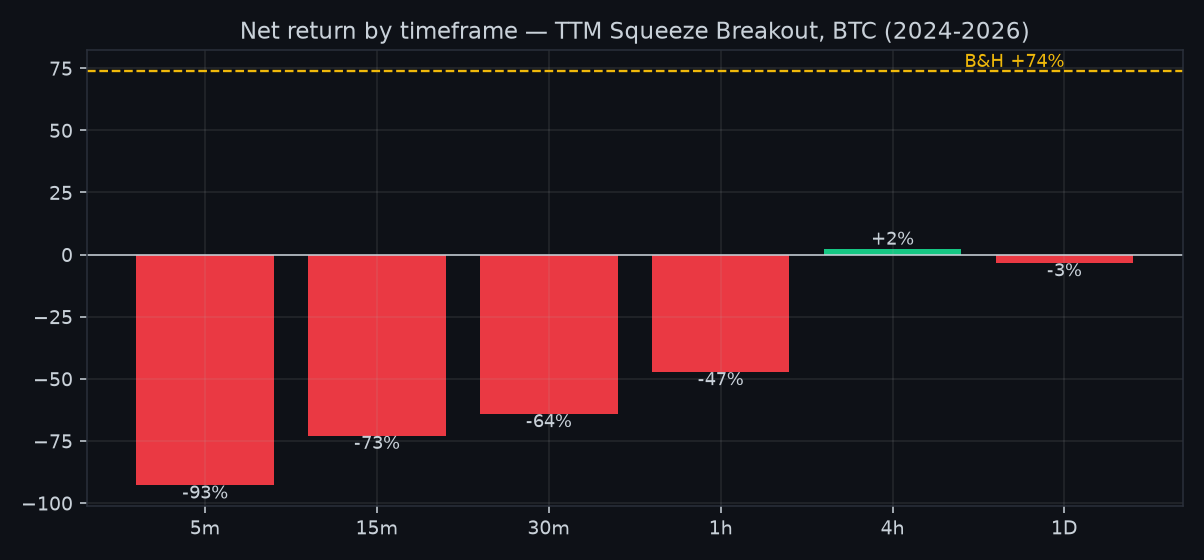
The strategy has exactly one timeframe where it does not lose: the 4-hour it is taught on. Drop to 5-minute and it is a −93% disaster (862 trades, profit factor 0.18); every intraday interval bleeds. A genuine edge degrades gracefully across timeframes — one that lives or dies on a single setting is a coincidence, not a system. And even its one survivable timeframe merely breaks even while Buy & Hold makes +74%.
2. Options / parameters (4-hour)
| Parameter | Value | Trades | Profit factor | Net return |
|---|---|---|---|---|
| Squeeze bars required | 4 | 32 | 0.86 | −9% |
| 6 (default) | 28 | 1.12 | +2% | |
| 8 | 21 | 1.69 | +17% | |
| 10 | 17 | 2.57 | +27% | |
| 12 | 14 | 2.70 | +25% | |
| Arm window | 5 | 26 | 1.26 | +7% |
| 8 (default) | 28 | 1.12 | +2% | |
| 12 | 28 | 1.29 | +8% | |
| Donchian length | 15 | 30 | 0.95 | −5% |
| 20 (default) | 28 | 1.12 | +2% | |
| 25 | 28 | 1.09 | +1% | |
| Chandelier stop (×ATR) | 2.5 | 28 | 0.89 | −4% |
| 3.0 (default) | 28 | 1.12 | +2% | |
| 3.5 | 27 | 1.31 | +10% | |
| 4.0 | 27 | 1.42 | +17% |
Two of the four knobs (arm window, Donchian length) barely move the needle. The other two — the squeeze requirement and the stop width — do lift the profit factor, but in the same suspicious way we saw above: by trading less or risking more, never by finding a cleaner signal. At the honest defaults the profit factor is 1.12.
3. Take-profit to stop-loss (fixed-target variant)
The native exit is a Chandelier trail. Swapping it for a fixed stop (3×ATR) and a fixed target at a set reward-to-risk lets us sweep the TP:SL ratio directly.
| TP : SL | Trades | Win rate | Profit factor | Net return |
|---|---|---|---|---|
| 1 : 0.5 | 28 | 64.3% | 0.72 | −11% |
| 1 : 1 | 27 | 55.6% | 1.09 | +3% |
| 1 : 1.5 | 27 | 48.1% | 1.20 | +8% |
| 1 : 2 | 27 | 33.3% | 0.92 | −9% |
| 1 : 2.5 | 26 | 30.8% | 1.08 | +0% |
| 1 : 3 | 25 | 24.0% | 0.80 | −18% |
| Chandelier trail (native) | 28 | 39.3% | 1.12 | +2% |
The profit factor wanders between 0.72 and 1.20 with no stable peak — some ratios profit, some lose, none decisively. When results scatter randomly around break-even as you change the exit, there is no edge in the exit to find.
Bottom line: across timeframe, parameters, and exit logic the picture is identical — a strategy hovering at break-even, propped up only by settings that shrink the sample. That is the signature of a non-edge.
Verdict: REJECT
- Gate 0 — Indicator fidelity — pass (standard TTM Squeeze release + Donchian breakout)
- Gate 1 — Sanity — pass (signal on the closed bar, no look-ahead)
- Gate 2 — Friction — fail (net +2% vs +9% gross — and a rout against buy & hold +74%)
- Gate 3 — Yearly consistency — fail (2024 +10% but 2025 negative — not consistent)
- Gate 4 — Out-of-sample — fail (the edge is a small-sample artifact — see robustness)
- Gate 5 — Robustness — fail (the famous “PF 3” only appears when you shrink to ~14 trades; on the full 28-trade sample it collapses to 1.12)
- Gate 6 — Multi-market — fail (median profit factor 1.04 across 9 coins; only 4 profitable)
- Gate 7 — vs Buy & Hold — fail (+2% vs buy & hold +74%)
The instinct behind the TTM Squeeze — trade the expansion that follows compression — is sound. But as a standalone mechanical system on crypto it produces no reliable edge: near-break-even at honest settings, beaten decisively by buying and holding, and inconsistent across assets. The seductive “profit factor 3” you see online is a small-sample, bull-market mirage — it evaporates the moment you demand a normal number of trades or a second coin.
The lesson: when a backtest shows a spectacular profit factor, count the trades first. Thirty is thin; fourteen is an anecdote. A profit factor that only rises as the sample falls is the single most common way a dead strategy is dressed up as a live one.
Method. TTM Squeeze = Bollinger(20,2σ) inside Keltner(20,1.5×ATR); entry on Donchian-20 breakout within an arm window after a 6-bar squeeze release, long-only above the 200 EMA; Chandelier 3×ATR trailing exit; entry next-bar open; 0.06% fee + 0.05% slippage per side; Binance 4-hour data, 2024-01 to 2026-05. Figures are Strategy Verdict own renders. Research and education, not financial advice.
Leave a Reply