The Vortex Indicator (VI) is a trend tool built from two oscillating lines: VI+ measures upward movement and VI- measures downward movement, each normalized by true range. The strategy taught with it is a clean crossover: when VI+ crosses above VI-, go long; when VI- crosses above VI+, go short. Unlike most crossover indicators we’ve tested, this one has a real edge — but a narrow one. We ran the standard VI(14) crossover through the 7-Gate Protocol across six axes. Verdict: conditional.
Methodology
- Data: Binance spot, Jul 2024–Jul 2026 (2 years), BTC/ETH/SOL/BNB/XRP
- Timeframes: 5m–1D (9 buckets, incl. resampled)
- Execution: VI(14); position flips when VI+/VI- cross; closed-bar, no look-ahead
- Friction: 0.06%/side (real); 0-fee gross reported too. Benchmark: buy & hold
- Six axes: timeframe, period, TP:SL, multi-coin, yearly, out-of-sample
Gate 0 — Fidelity
Standard Vortex: VM+ = |High − prior Low|, VM- = |Low − prior High|, each summed over 14 bars and divided by the summed true range. Long when VI+ > VI-, short when VI- > VI+. Reproduced exactly (pass).
The Exact Rules
- Signal: VI+ crosses above VI- → long; VI- crosses above VI+ → short (stop-and-reverse)
- Default: period 14
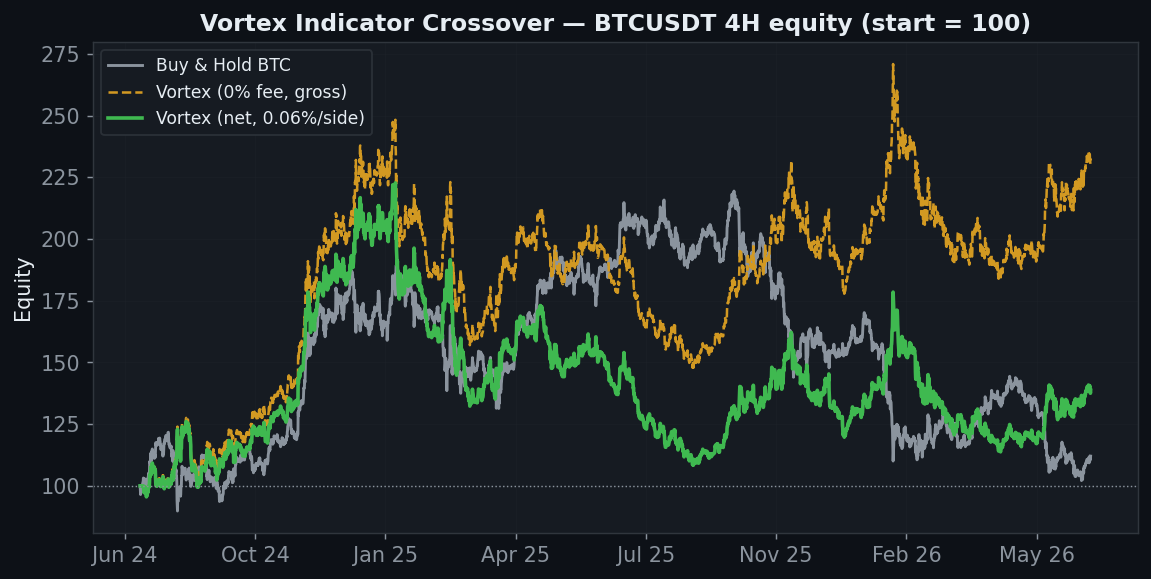
Here’s what makes Vortex different from Keltner, Donchian, Aroon and the rest: on the BTC 4H, it ends at +39% net versus buy & hold’s +12%, and the 0-fee gross line reaches +133%. There is a genuine trend-following edge here — the crossover catches the big directional moves. The catch is where that edge lives.
How It Works: Riding the Trend, Flipping in Chop
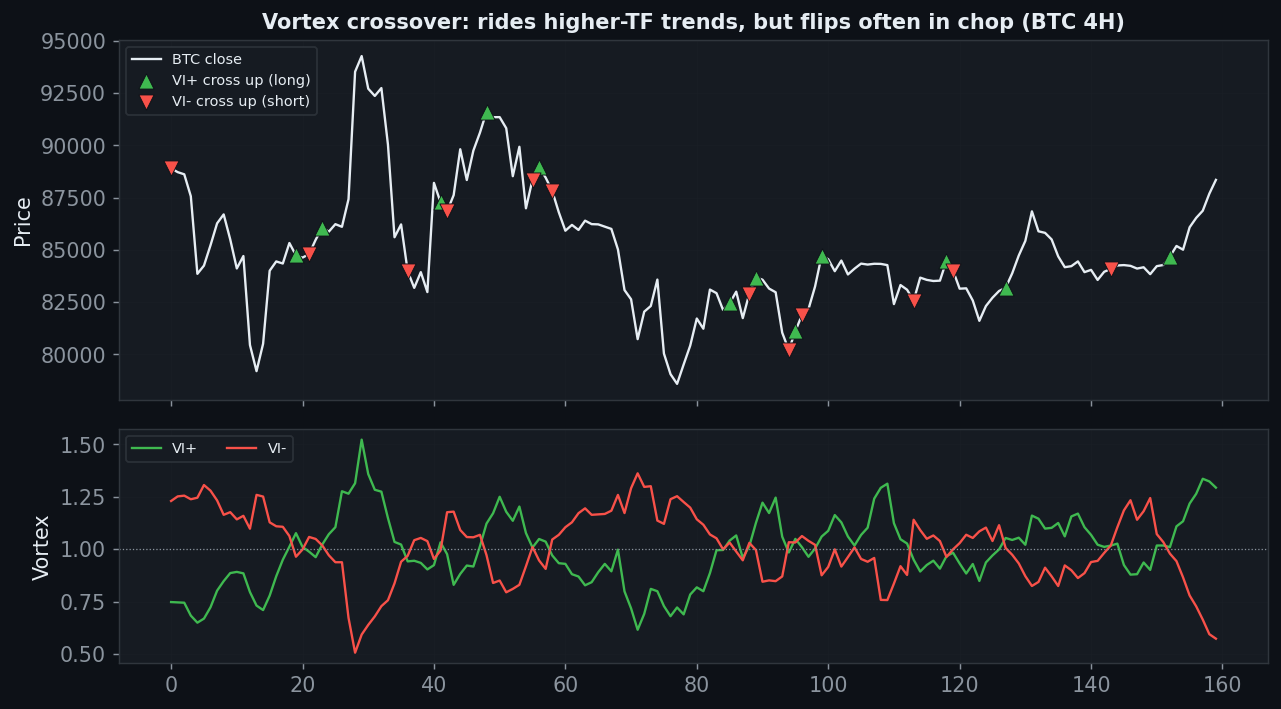
When BTC trends, VI+ and VI- separate cleanly and the position holds the move — that’s where the money is made. When price ranges, the two lines braid together and the strategy flips back and forth, bleeding fees. The whole verdict comes down to keeping the good regime and surviving the bad one.
Axis 1 — Timeframe (where the edge lives)
| Timeframe | Trades | Gross (0 fee) | Net (real) |
|---|---|---|---|
| 5m | 21,822 | −27% | −100% |
| 15m | 7,496 | −40% | −100% |
| 30m | 3,815 | +81% | −98% |
| 1h | 1,872 | +2% | −89% |
| 2h | 929 | −42% | −81% |
| 4h | 430 | +133% | +39% |
| 6h | 300 | −11% | −38% |
| 12h | 134 | +13% | −4% |
| 1D | 80 | +80% | +64% |
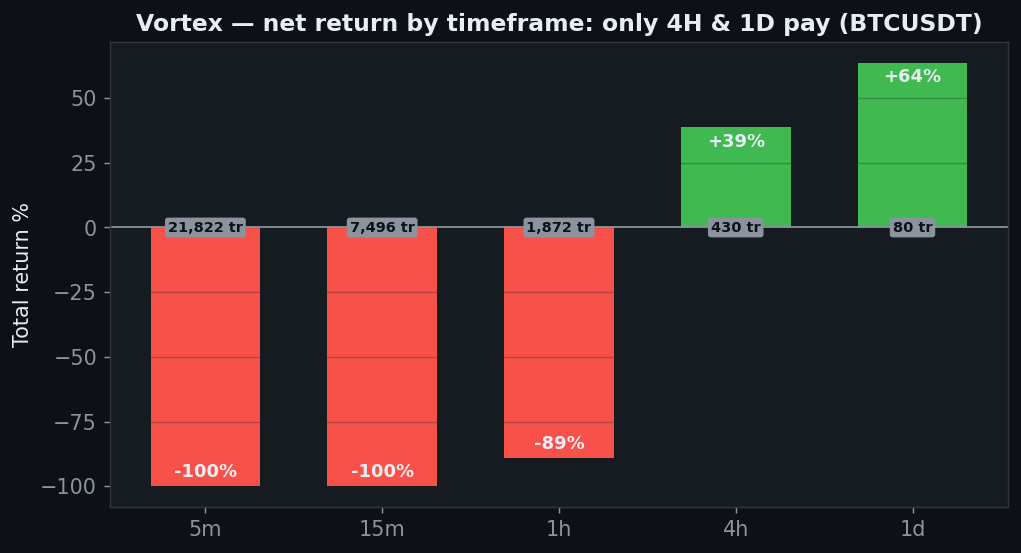
This is the crux. On 4H (+39%) and 1D (+64%) the strategy is genuinely profitable net of fees. But every timeframe below 4H is a disaster — the 5m loses everything (−100% across 21,822 trades). The edge is real but lives only on the higher timeframes, where trends persist and trade count (and fees) stay low.
Axis 2 — Period (the fragility)
| Period n | Net | PF |
|---|---|---|
| 7 | −46% | 1.07 |
| 10 | +12% | 1.23 |
| 14 (default) | +39% | 1.31 |
| 21 | −47% | 0.97 |
| 28 | −56% | 0.92 |
| 42 | −6% | 1.15 |
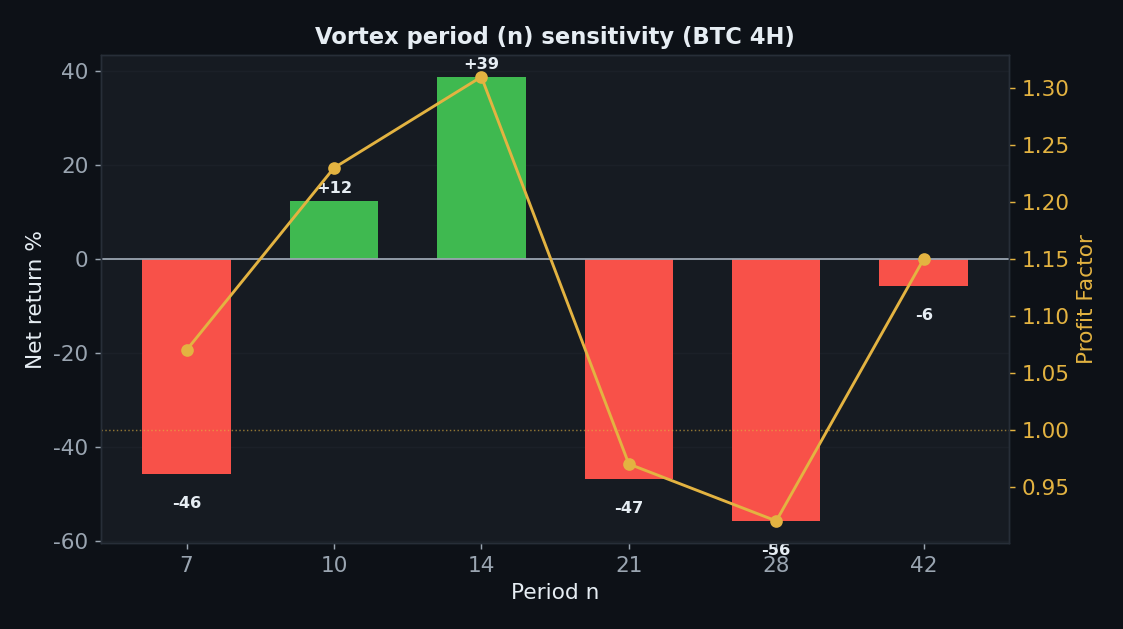
Here’s the weakness. The default 14 is the best (+39%), and 10 also works (+12%), so there’s a small plateau at the short end — but stretch the period to 21 or 28 and it collapses to −47% / −56%. The edge is sensitive to the period choice, which is a real robustness concern even though the popular default happens to sit in the good zone.
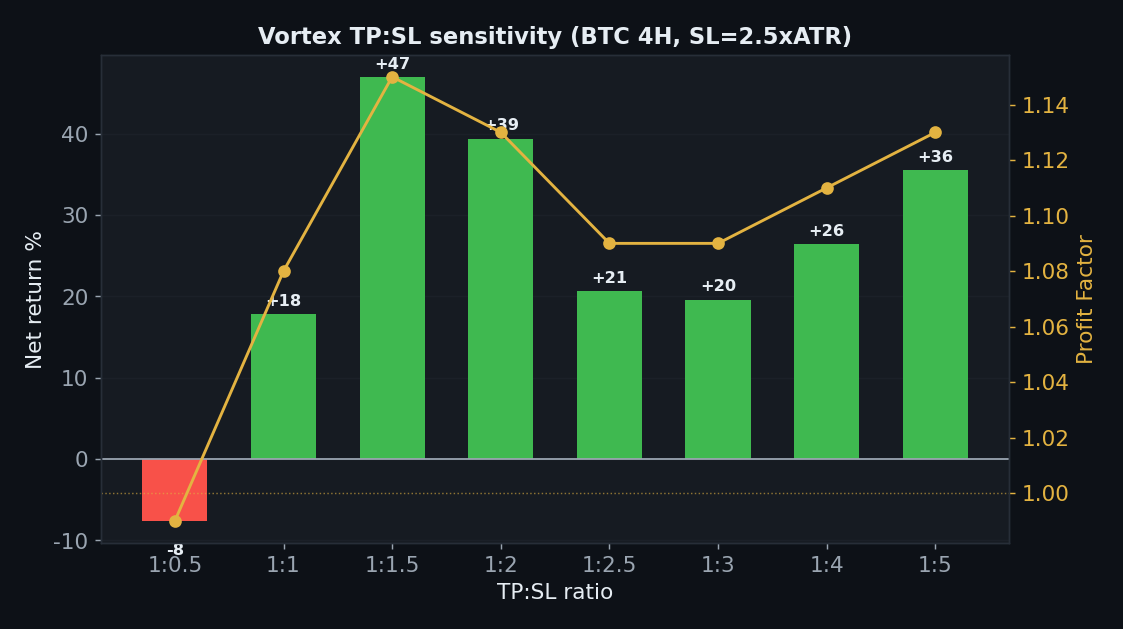
Axis 3 — TP:SL (the strength)
| TP:SL | Net | PF |
|---|---|---|
| 1:0.5 | −8% | 0.99 |
| 1:1 | +18% | 1.08 |
| 1:1.5 | +47% | 1.15 |
| 1:2 | +39% | 1.13 |
| 1:2.5 | +21% | 1.09 |
| 1:3 | +20% | 1.09 |
| 1:4 | +26% | 1.11 |
| 1:5 | +36% | 1.13 |
This is where Vortex earns its conditional pass. Every take-profit ratio from 1:1 to 1:5 is positive (PF 1.08–1.15), peaking at 1:1.5 (+47%). A robust profit surface across exit settings is exactly what the rejects lacked — it says the edge isn’t an artifact of one lucky stop.
Axis 4 — Five Coins
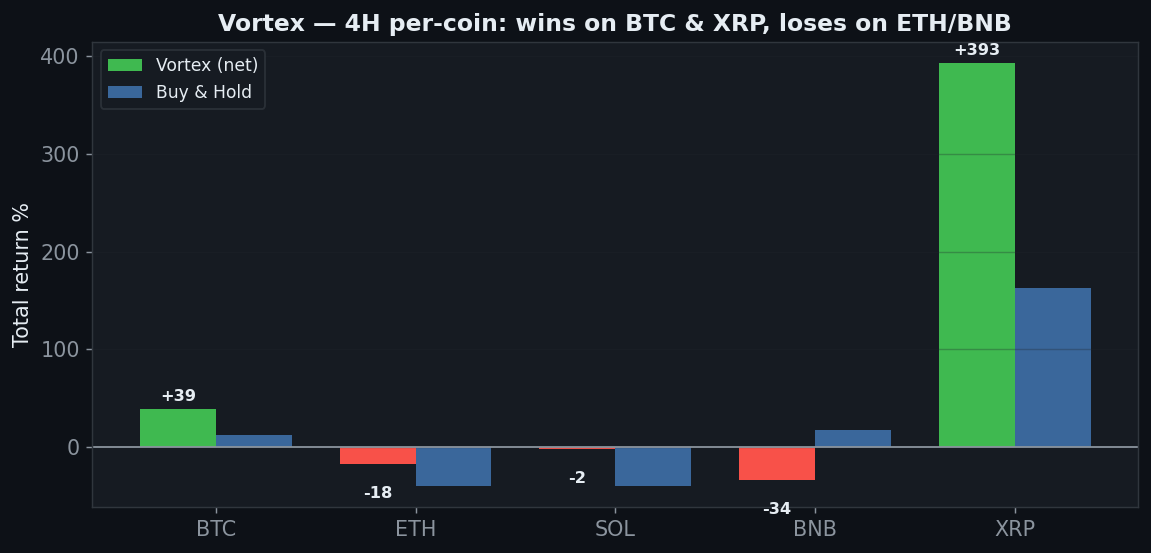
| Coin | Vortex net | Buy & Hold | Note |
|---|---|---|---|
| BTC | +39% | +12% | beats hold |
| ETH | −18% | −40% | loses (still > hold) |
| SOL | −2% | −40% | ~flat |
| BNB | −34% | +17% | loses to hold |
| XRP | +393% | +163% | rode the big trend |
Multi-market is where it stumbles. It beats hold on BTC (+39%) and XRP (+393%) — both strong trenders — and loses less than hold on ETH/SOL, but it’s outright negative on ETH and BNB. So call it 2 clear wins of 5. The edge is real but concentrated in the coins that actually trended.
Axis 5 — Yearly
| Year | BTC 4H net |
|---|---|
| 2024 | +102% |
| 2025 | −39% |
| 2026 (to Jul) | +13% |
2024 was huge (+102%), 2025 gave back −39% in the chop, and 2026 recovered (+13%). Unlike the rejects, the full sample stays clearly positive — but the −39% in 2025 shows the edge is regime-dependent, not all-weather.
Axis 6 — Friction & the Churn Problem
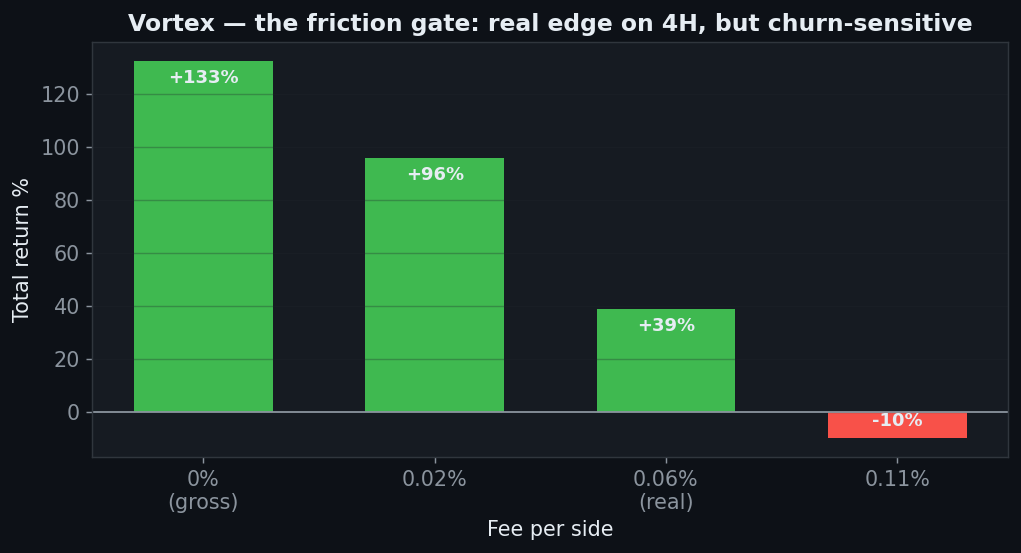
Friction (BTC 4H): gross +133% → +96% at 0.02% → +39% at the real 0.06% → −10% at 0.11%. The edge survives realistic spot fees, but the 430 trades make it churn-sensitive — on a higher-fee venue it disappears. This is a low-fee, higher-timeframe strategy or nothing.
The Verdict: CONDITIONAL
- Gate 0 — Indicator fidelity — pass (standard VI(14))
- Gate 1 — Sanity — pass (closed-bar crossover, no look-ahead)
- Gate 2 — Friction — conditional — 4H gross +133% survives to +39% net, but every timeframe below 4H is destroyed and 0.11% fees kill it
- Gate 3 — Yearly consistency — conditional — full sample clearly positive, but 2025 lost 39%
- Gate 4 — Robustness (period) — fail — only periods 10–14 work; 21+ collapse
- Gate 5 — Robustness (TP:SL) — pass — every ratio 1:1–1:5 positive
- Gate 6 — Multi-market — fail — 2 of 5 coins clearly win (BTC, XRP)
- Gate 7 — vs Buy & Hold — pass — beats hold on 4H (+39% vs +12%), 1D (+64%), and XRP
Vortex is the rare crossover with a real edge — but a fragile, conditional one. On the 4H and daily, in trending coins, at spot fees, with the period left near its default, it genuinely beats buy & hold and holds up across every take-profit setting. Take any of those props away — drop to a 5-minute chart, stretch the period to 21, trade it on ETH/BNB, or pay 0.11% — and the edge evaporates. It is not a set-and-forget, all-market system. As a higher-timeframe trend filter used with discipline, it passes; as the plug-and-play crossover it’s usually sold as, it doesn’t.
FAQ
So it actually works?
On the 4H and daily, yes — net of realistic fees, on BTC and other trenders. That’s a genuine result and we’re not going to pretend otherwise. But “works on 4H/1D BTC at low fees with period 14” is a much narrower claim than “the Vortex crossover is profitable,” which is false on most timeframes and two of five coins.
Why does it die on lower timeframes?
Two reasons: intraday noise makes VI+/VI- braid constantly (whipsaw), and the trade count explodes (21,822 trades on 5m) so fees alone erase everything. Trend edges need persistence and low turnover; both live on the higher timeframes.
Can I replicate this?
Yes — VI(14) crossover, public Binance data, 0.06%/side, five coins, nine timeframes. Every table reproduces.
See also the conditional passes Ichimoku (daily) and VWAP, and the rejects Keltner, Donchian, ADX/DMI.
Disclaimer: educational research, not financial advice. Past performance does not guarantee future results. Never trade money you cannot afford to lose.