Welles Wilder gave technical analysis some of its most enduring tools in his 1978 book — RSI, ATR, Parabolic SAR, and the Directional Movement system: +DI, −DI, and ADX. The idea is elegant. The +DI measures upward directional pressure, the −DI downward, and the ADX measures how strong the trend is regardless of direction. The rule taught to millions is the crossover: when +DI crosses above −DI, go long; when −DI crosses above +DI, go short. So does one of the most respected trend systems in history make money on crypto? We ran it through the 7-Gate Protocol across six robustness axes. Verdict: reject — with one honest twist that points back to how ADX was actually meant to be used.
Methodology
- Data: Binance spot, Jul 2024–Jul 2026 (2 years), BTC/ETH/SOL/BNB/XRP
- Timeframes: 5m–1D (9 buckets, incl. resampled)
- Execution: on the bar close, no look-ahead; Wilder-smoothed +DI/−DI/ADX, period 14
- Friction: 0.06%/side (real); 0-fee gross reported too. Benchmark: buy & hold
- Six axes: timeframe, ADX-filter threshold, TP:SL, multi-coin, yearly, out-of-sample
Gate 0 — Fidelity
Standard Wilder DMI(14): +DI and −DI from smoothed directional movement over the true range, ADX from the smoothed DX. Signal on the closed bar, no look-ahead. Reproduced faithfully (pass).
The Exact Rules
- Signal: +DI crosses above −DI → long; −DI crosses above +DI → short (stop-and-reverse)
- Default: period 14, no ADX filter (the raw taught crossover)
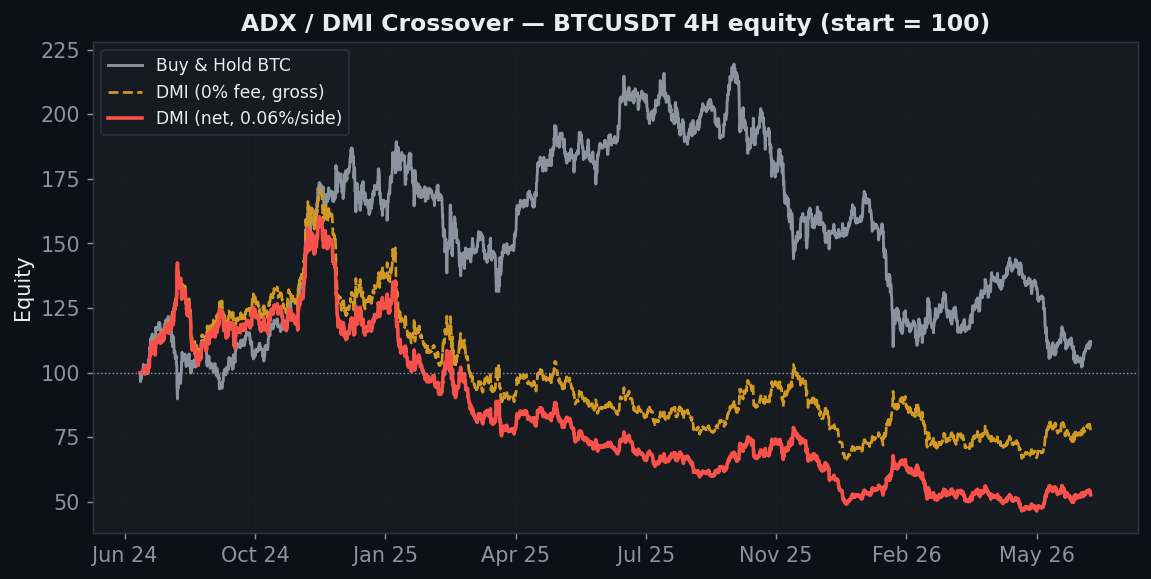
BTC 4H ends at −47% against buy & hold’s +12%. And the gross (0-fee) line finishes at −22% — deeply negative before a single cent of fees. This is the recurring death sentence on this site: no gross edge to erode. But the DI crossover fails for a specific, diagnosable reason.
Why It Bleeds: a 29% Win Rate
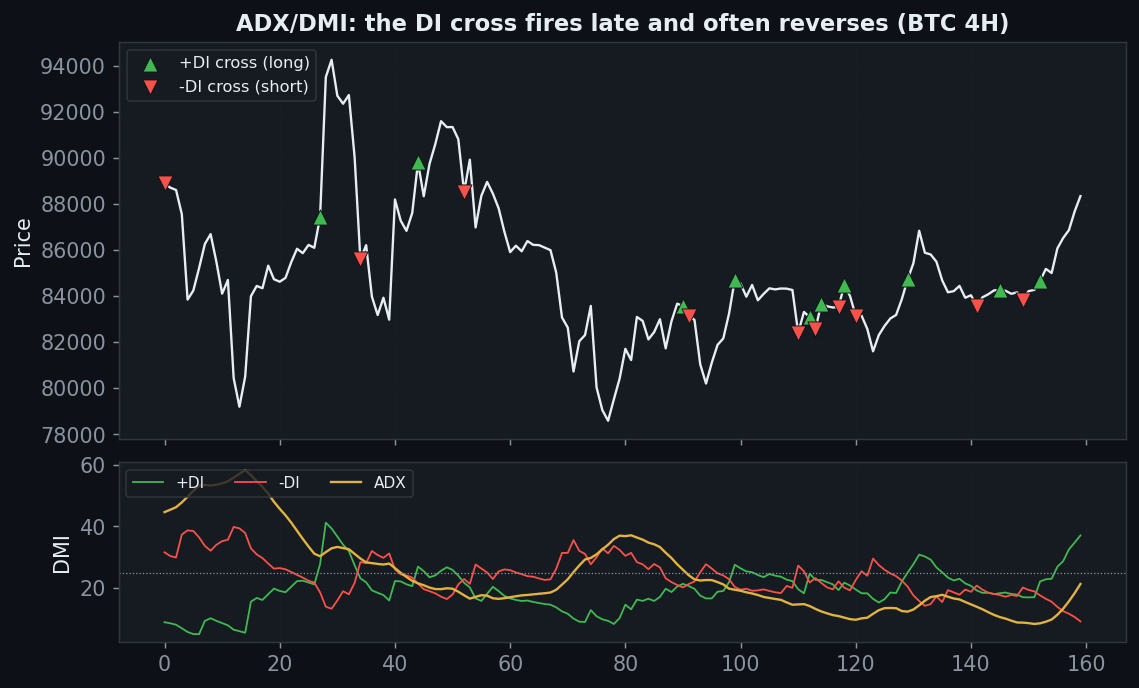
Look at the bottom panel. The +DI and −DI lines cross after a move is already underway — directional movement has to accumulate before the lines swap order. So the entry is chronically late, and in choppy conditions the lines cross back and forth constantly. The result is a win rate of just 29% on 4H: the system is wrong roughly seven times out of ten, entering the direction of a move only once it’s half over and reversing right before it resumes. ADX (gold) tells you the trend is strong — but the crossover tells you the direction far too slowly.
Axis 1 — Timeframe (gross vs net)
| Timeframe | Trades | Gross (0 fee) | Net (real) |
|---|---|---|---|
| 5m | 18,310 | −41% | −100% |
| 15m | 5,822 | −10% | −100% |
| 30m | 2,799 | +25% | −96% |
| 1h | 1,325 | −25% | −85% |
| 2h | 620 | +20% | −43% |
| 4h | 323 | −22% | −47% |
| 6h | 225 | −22% | −40% |
| 12h | 111 | −9% | −20% |
| 1D | 55 | +3% | −4% |
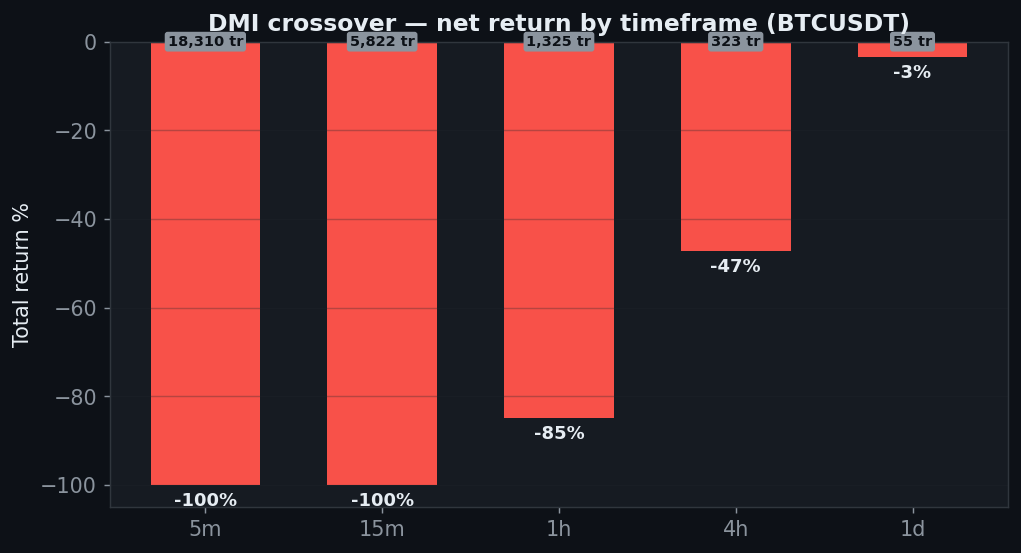
Zero net-positive timeframes. A few buckets are gross-positive (30m +25%, 2h +20%, 1D +3%) — there’s a faint directional signal — but the trade counts are brutal (18,310 on 5m) and fees bury every one of them. The daily is the least-bad at −4%, still behind holding.
Axis 2 — The ADX Filter (the honest twist)
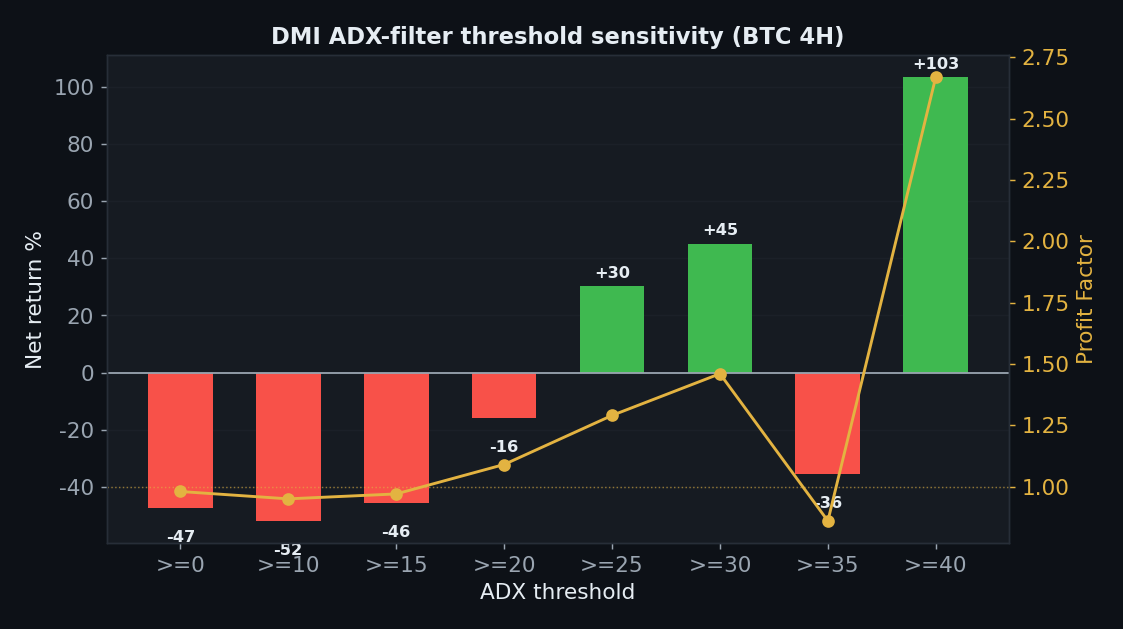
Here is where DMI differs from a plain oscillator. ADX was designed as a filter — “only trade when the trend is strong.” So we swept the minimum-ADX threshold on BTC 4H.
| ADX filter | Trades | Net | PF |
|---|---|---|---|
| ≥0 (raw cross) | 323 | −47% | 0.98 |
| ≥10 | 319 | −52% | 0.95 |
| ≥15 | 261 | −46% | 0.97 |
| ≥20 | 195 | −16% | 1.09 |
| ≥25 | 115 | +30% | 1.29 |
| ≥30 | 64 | +45% | 1.46 |
| ≥35 | 44 | −36% | 0.86 |
| ≥40 | 23 | +103% | 2.67 |
This is the one genuinely interesting result on this site. The raw crossover (ADX≥0) loses 47%, but requiring ADX≥25–30 flips it positive (+30% to +45%) on a still-reasonable 64–115 trades — consistent with the theory that DI crosses only pay inside strong trends. But do not over-read it. The surface is unstable (ADX≥35 drops back to −36%), and the eye-catching ADX≥40 (+103%) rests on just 23 trades — classic over-fit. The filter’s proper use shows a flicker of merit, but the crossover that’s actually taught — unfiltered — has no edge, and even the filtered version is fragile and would still face the yearly problem below.
Axis 3 — TP:SL
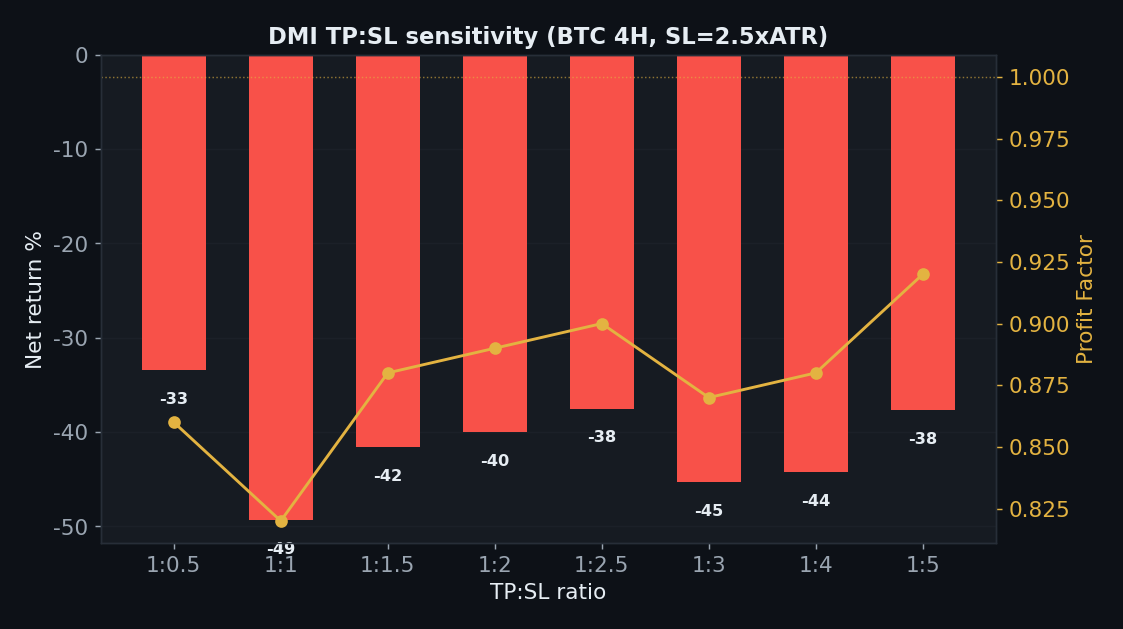
Fixing the stop at 2.5×ATR and sweeping the take-profit ratio on BTC 4H:
| TP:SL | Net | PF |
|---|---|---|
| 1:0.5 | −33% | 0.86 |
| 1:1 | −49% | 0.82 |
| 1:1.5 | −42% | 0.88 |
| 1:2 | −40% | 0.89 |
| 1:2.5 | −38% | 0.90 |
| 1:3 | −45% | 0.87 |
| 1:4 | −44% | 0.88 |
| 1:5 | −38% | 0.92 |
Unlike some strategies, there is no take-profit setting that rescues the DI crossover — every ratio from 1:0.5 to 1:5 loses (−33% to −49%). A signal that’s wrong 71% of the time can’t be fixed by adjusting where you take profit.
Axis 4 — Five Coins
| Coin | DMI net | Buy & Hold | Excess |
|---|---|---|---|
| BTC | −47% | +12% | −59pp |
| ETH | −32% | −40% | +8pp |
| SOL | −39% | −40% | +2pp |
| BNB | −62% | +17% | −79pp |
| XRP | +85% | +163% | −78pp |
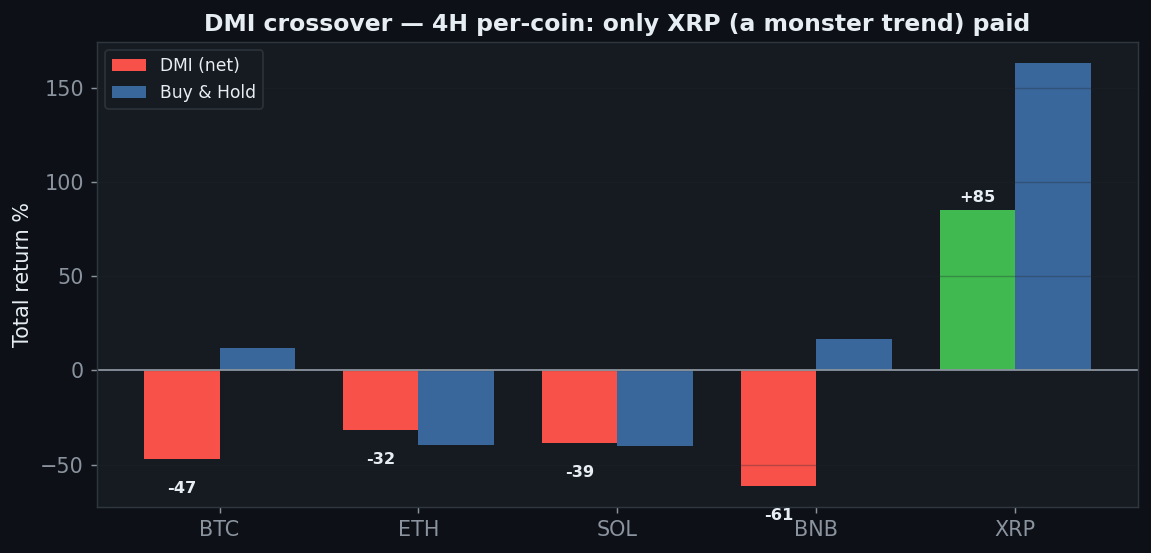
Only XRP (1 of 5) is net-positive, and even it (+85%) badly trails its own buy & hold (+163%). BTC loses 47%, BNB 62%. The one green coin is the one that trended hardest — trend-luck, not edge.
Axis 5 — Yearly
| Year | BTC 4H net |
|---|---|
| 2024 | +16% |
| 2025 | −58% |
| 2026 (to Jul) | +7% |
2024 and 2026 are positive, but 2025’s −58% is catastrophic and sinks everything. This is even more regime-dependent than most: a laggy crossover in a choppy, mean-reverting year gets destroyed.
Axis 6 — Friction & Out-of-Sample
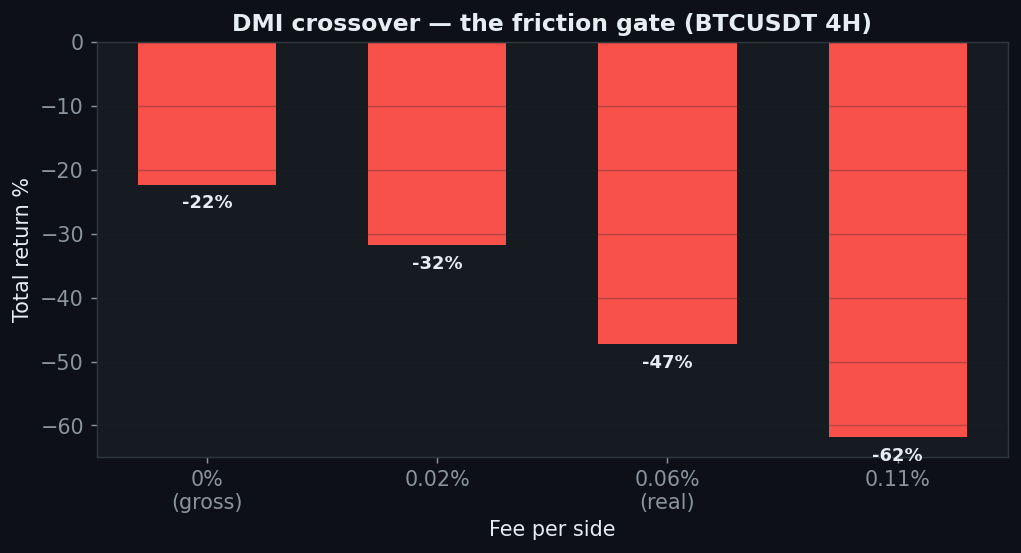
Friction (BTC 4H): −22% gross → −47% net at 0.06%. The out-of-sample split looks green — 4 of 5 coins positive out-of-sample — but don’t be fooled: the full-sample is a 47% wipeout, and a less-bad final six months after that is a window artifact, not evidence of edge. We report it rather than lean on it.
The Verdict: REJECT
- Gate 0 — Indicator fidelity — pass (standard Wilder DMI(14): +DI/−DI/ADX)
- Gate 1 — Sanity — pass (signal on the closed bar, no look-ahead)
- Gate 2 — Friction — fail (−22% at zero fees on 4H, −47% net; 5m → −100%)
- Gate 3 — Yearly consistency — fail (2024 +16 / 2025 −58 / 2026 +7 — 2025 is catastrophic)
- Gate 4 — Out-of-sample — fail (window artifact) (4/5 looks green but the full sample is a −47% wipeout)
- Gate 5 — Robustness — fail (raw crossover loses; the ADX≥25–30 filter helps but is unstable, and ≥40 is 23-trade over-fit)
- Gate 6 — Multi-market — fail (1 of 5 coins; only XRP, a monster trender)
- Gate 7 — vs Buy & Hold — fail (0 of 5 timeframes beat holding; net-positive on one coin)
ADX measures trend strength; the DI crossover measures direction — too late. By the time +DI and −DI swap places a move is half-spent, and a 29% win rate is the arithmetic of always arriving after the party. The one honest bright spot is that ADX used as a filter (≥25–30) nudges the crossover positive — which is exactly how Wilder intended ADX to be used, and an argument against trading the naked cross at all. But that edge is unstable, single-regime, and evaporated in 2025. As the taught crossover, DMI is a reject.
FAQ
You’re supposed to use ADX as a filter, not trade the raw cross.
Agreed — and that’s the point. The raw crossover is what’s taught to beginners, so we tested it; it loses. Filtering to ADX≥25–30 does help, but our sweep shows that edge is fragile (it breaks by ≥35) and the standout ≥40 result is 23 trades of noise. A real ADX-filtered system would still have to clear the yearly and multi-coin gates, where it stumbles.
Why is the win rate so low?
Directional movement has to build before the DI lines cross, so entries lag; in ranges the lines cross repeatedly. Being right on direction but late means small wins and frequent stop-and-reverse losses — 29% winners.
Can I replicate this?
Yes — Wilder DMI(14), +DI/−DI crossover, public Binance data, 0.06%/side, five coins, nine timeframes. Every table reproduces.
See also: Donchian / Turtle Breakout, Triple SuperTrend, UT Bot, Parabolic SAR, and the conditional passes VWAP and Ichimoku (daily).
Disclaimer: educational research, not financial advice. Past performance does not guarantee future results. Never trade money you cannot afford to lose.