A popular trading channel calls it “easy profits.” Stack three SuperTrend indicators on a 5-minute chart, wait for all three to turn green, and go long with a 1.5 risk-to-reward. Short when they all turn red. “Bam — easy profits, guys.” We rebuilt the exact setup, mechanized every rule, and ran it over 2.4 years of 5-minute data across nine major coins with realistic costs. Here is the full autopsy.
The setup, exactly as taught
- Three SuperTrends: (ATR 10, factor 1), (ATR 11, factor 2), (ATR 12, factor 3).
- Long when all three lines are green (uptrend); short when all three are red.
- Stop-loss at the slowest green line (the 12/3 SuperTrend).
- Take-profit at a fixed 1.5 R (1.5× the risk distance).
- Timeframe: 5 minutes; long and short both enabled.
We enter on the next bar’s open after a signal and resolve the stop and target intrabar — no look-ahead. Trading costs are modeled at 0.06% fee plus 0.05% slippage per side.
The verdict at a glance
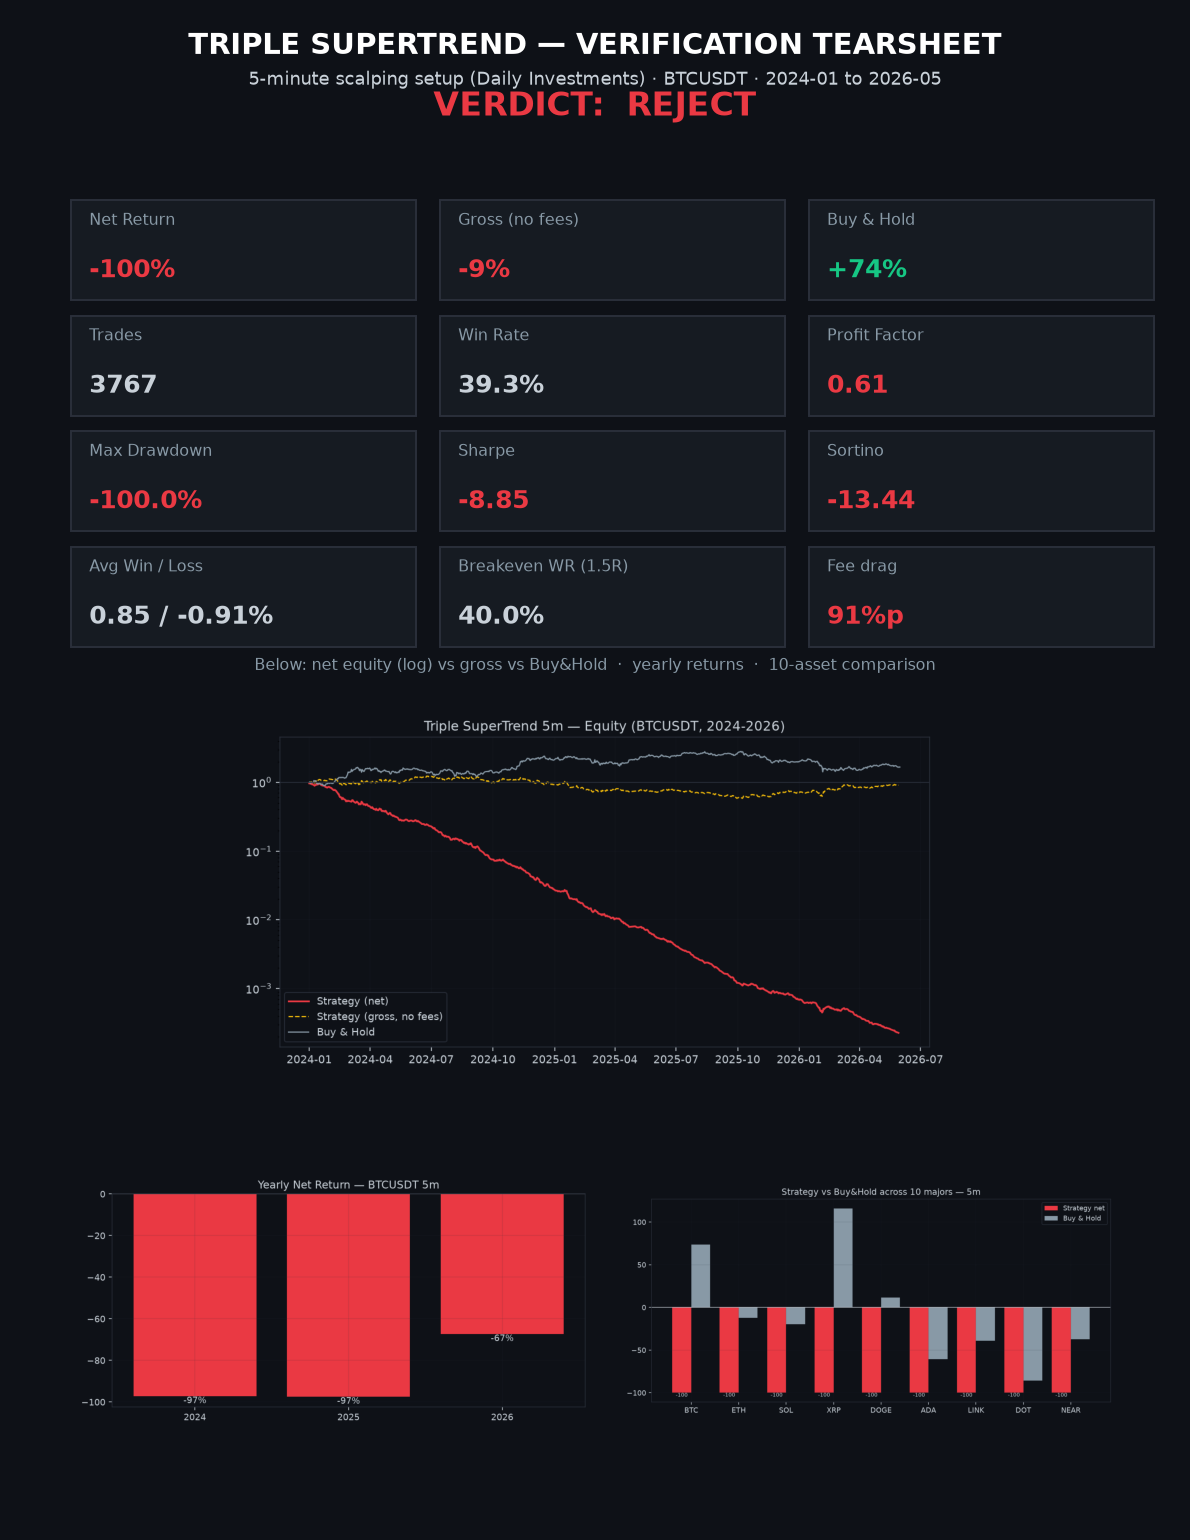
| Metric | Value |
|---|---|
| Net return (after costs) | −100% |
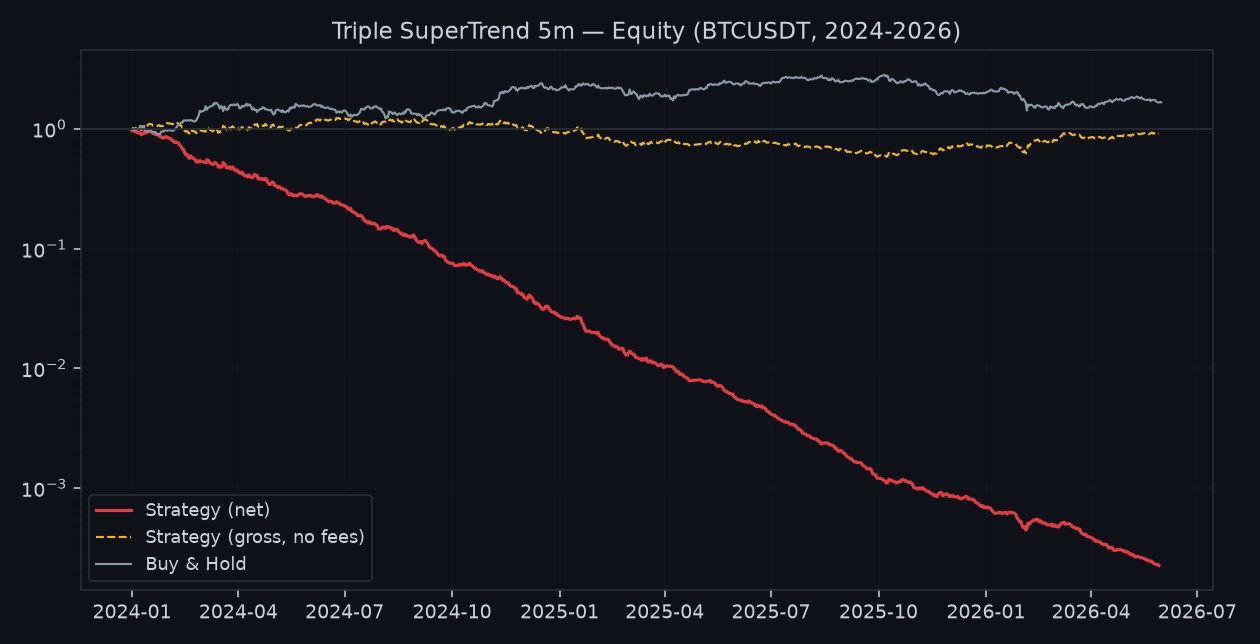
| Gross return (zero costs) | −9% (profit factor 1.01 — no edge) |
| Buy & Hold, same window | +74% |
| Trades | 3,767 |
| Win rate | 39.3% |
| Profit factor (net) | 0.61 |
| Max drawdown | −100% |
| Sharpe / Sortino | −8.85 / −13.44 |
Why it fails — the math the tutorial skips
With a fixed 1.5 reward-to-risk, the break-even win rate is 40% (1 ÷ 2.5). The strategy’s actual win rate is 39.3% — a hair below the line. That one number is decisive: even with zero trading costs the edge is statistically indistinguishable from zero (gross profit factor 1.01), and it compounds to roughly −9%.
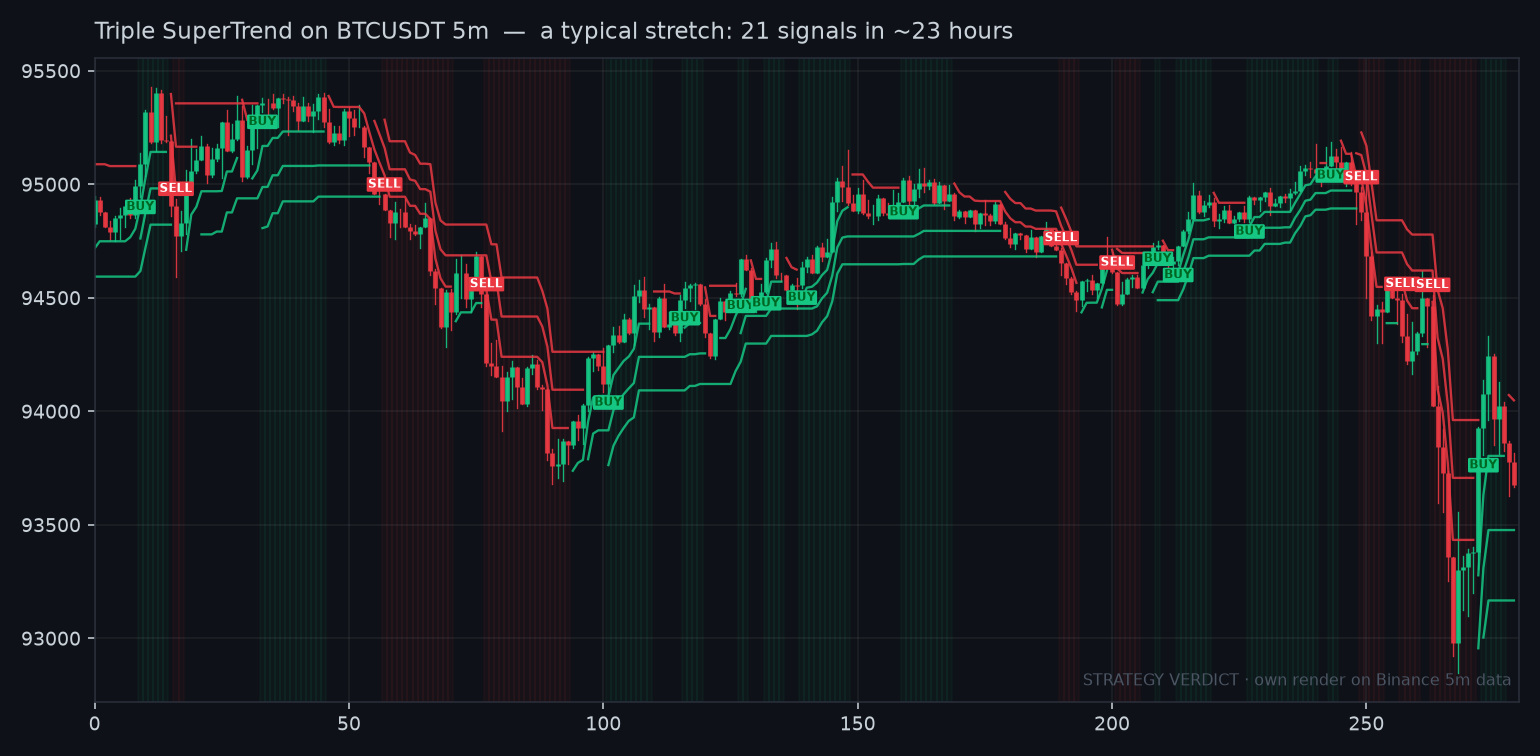
Then reality arrives. A 5-minute signal fires constantly — 3,767 round-trips in 2.4 years. At ~0.11% cost per side, that friction compounds into a −91 percentage-point drag that carries the account from “no edge” all the way to zero. The chop in the chart above — SELL, SELL, then BUY right before the move — is exactly where the money goes.
The equity curve
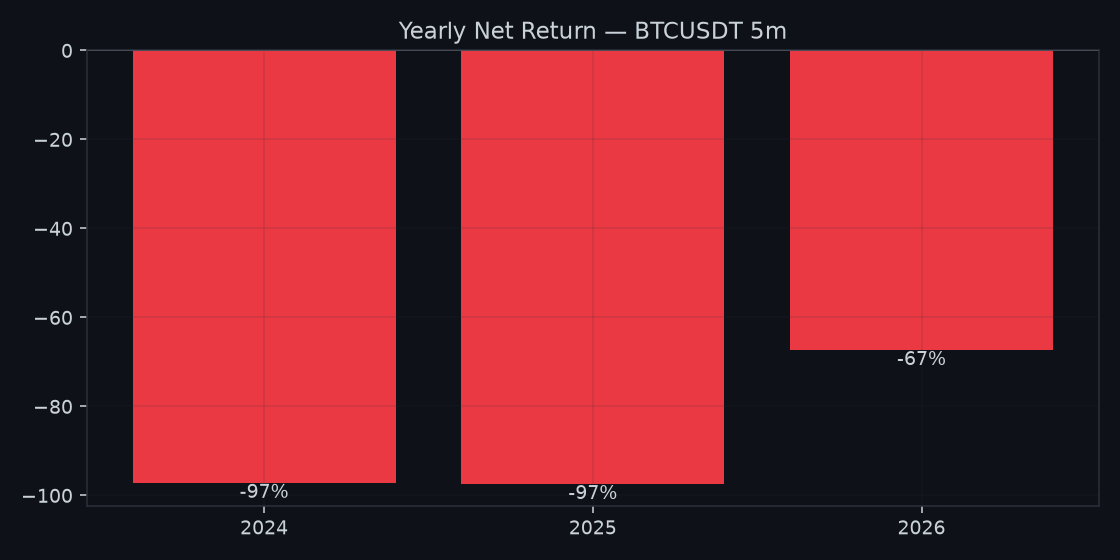
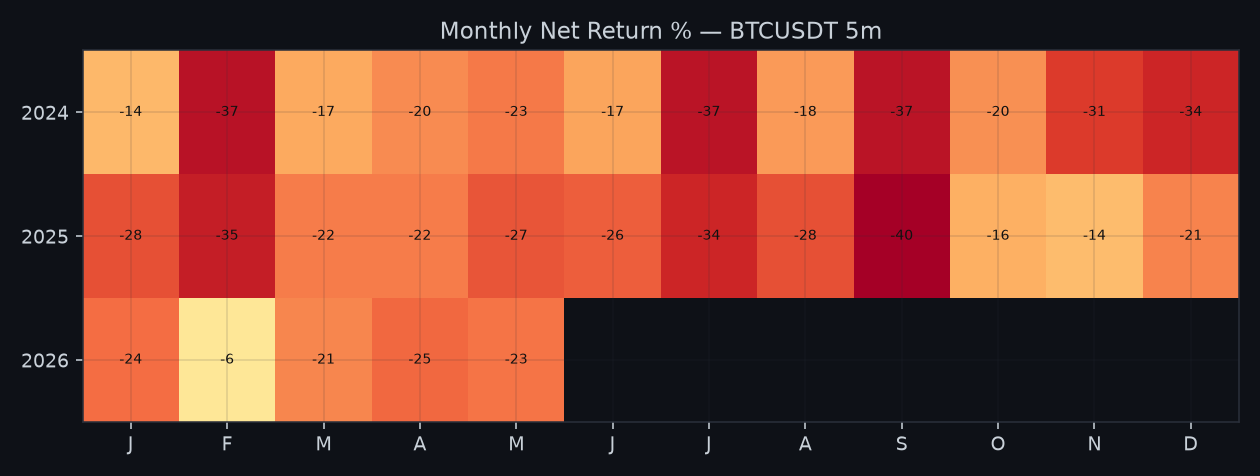
Every year, in and out of sample
| Period | Net return | Win rate |
|---|---|---|
| 2024 | −97.2% | 39.6% |
| 2025 | −97.5% | 38.2% |
| 2026 (to May) | −67.4% | 41.2% |
Out-of-sample changes nothing. Fitting on 2024–2025 and testing on 2026 gives −99.9% and −67.4% respectively — the test window looks “milder” only because it is shorter. There is no hidden regime where the setup works.
Robustness: it is not a tuning problem
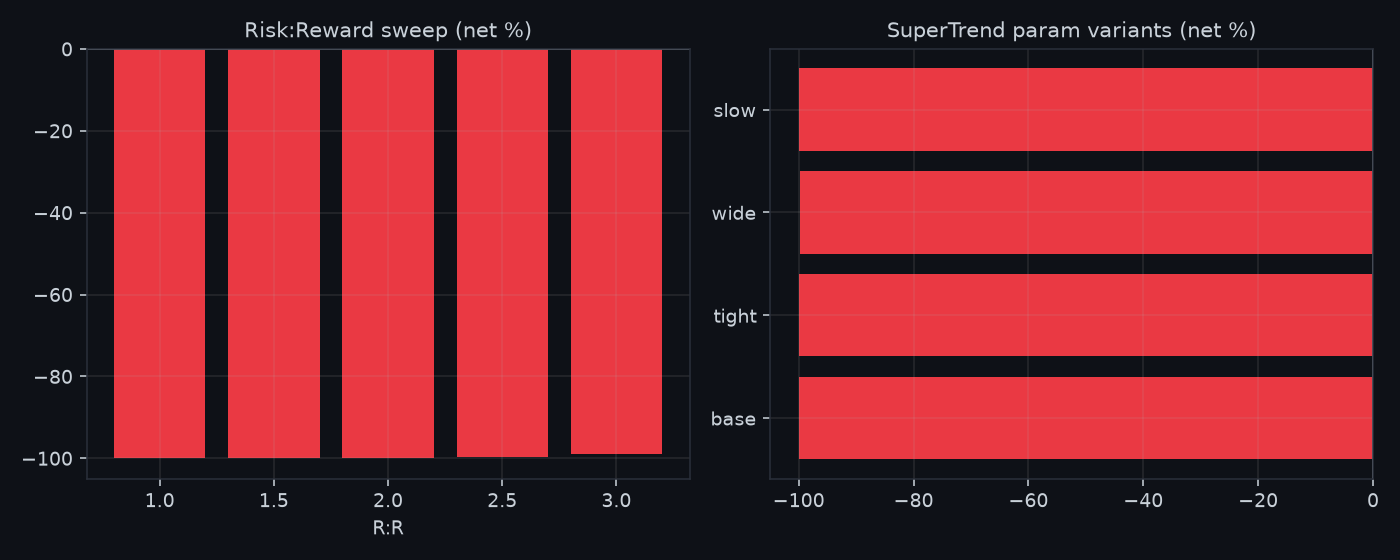
We swept reward-to-risk from 1.0 to 3.0 and tried four different SuperTrend parameter sets. Every single combination loses close to 100%. Tightening R:R to 1.0 lifts the win rate to 47%, but the average win shrinks faster (profit factor falls to 0.52). Widening to 3.0 cuts the win rate to 25%. Nothing rescues it — the flaw is structural, not a knob you failed to turn.
Not just Bitcoin: 9 of 9
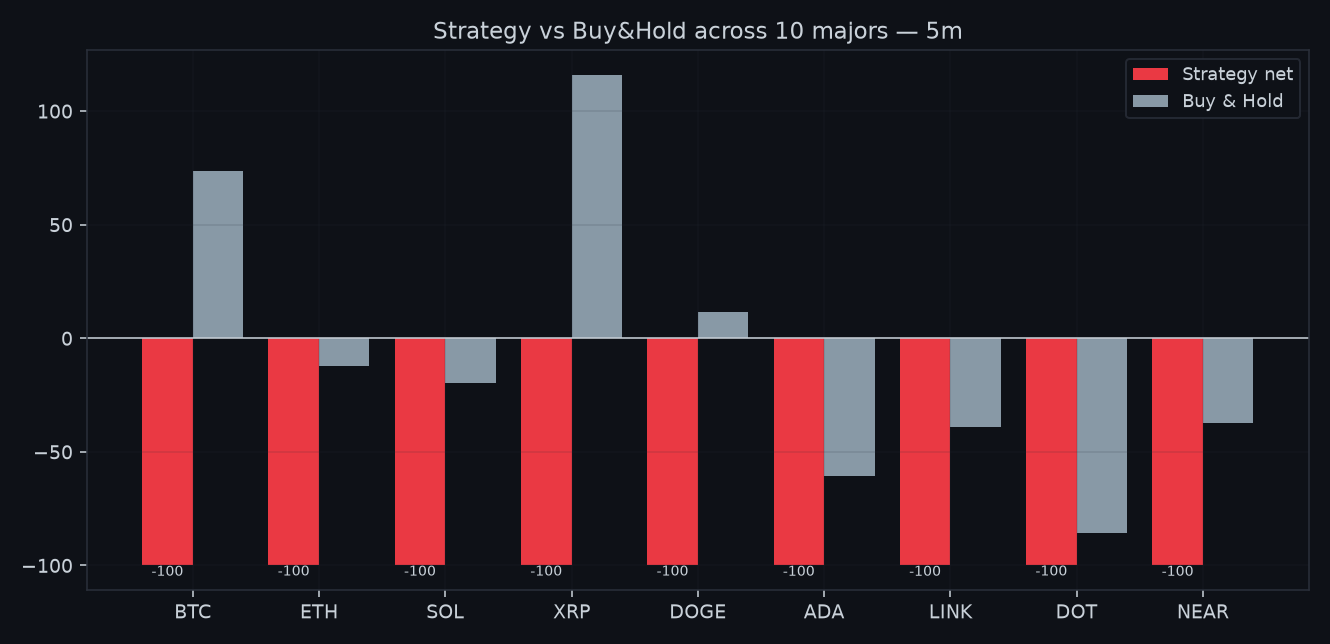
We ran the identical rules on nine liquid majors. All nine wipe the account (net ≈ −100%), whether the coin itself rose or fell. XRP returned +116% over the window by simply being held — the strategy still lost everything trading it.
Change every option: a full sensitivity sweep
The natural objection to any losing backtest is “you used the wrong settings.” So we changed every knob the strategy has — timeframe, reward-to-risk, the SuperTrend periods, trading cost, and trade direction — one axis at a time, on the same BTCUSDT data. Here is the entire grid.
1. Timeframe — the most revealing axis
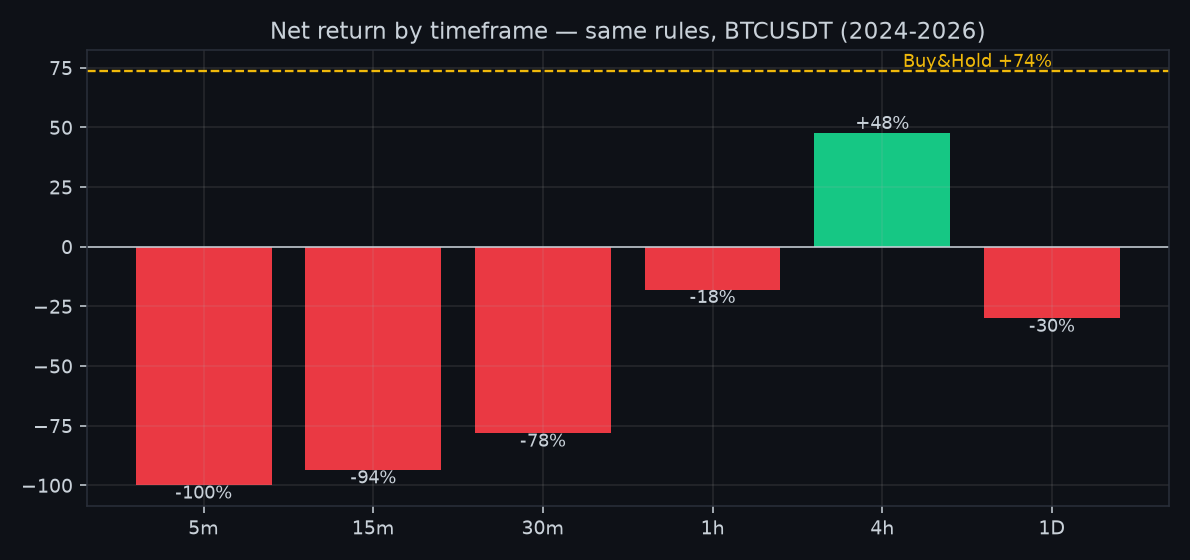
| Timeframe | Trades | Win rate | Profit factor | Net return |
|---|---|---|---|---|
| 5-minute (as taught) | 3,767 | 39.3% | 0.61 | −100% |
| 15-minute | 1,231 | 39.8% | 0.77 | −93.6% |
| 30-minute | 627 | 39.9% | 0.82 | −78.2% |
| 1-hour | 302 | 42.1% | 1.00 | −18.0% |
| 4-hour | 74 | 47.3% | 1.27 | +47.6% |
| 1-day | 12 | 33.3% | 0.75 | −30.1% |
This is the honest, interesting result. On the 5-minute chart it is taught on, the setup loses everything. Slow the chart down and the bleeding slows with it: 1-hour is a near-breakeven −18% (profit factor exactly 1.00), and at 4-hour it actually turns positive, +47.6%. But two facts keep the verdict where it is: (1) even the best timeframe still loses to simply buying and holding Bitcoin (+74% over the same window), and (2) push one step further to the daily chart and it collapses back to −30% on a meaningless 12 trades. There is no timeframe where this is a good strategy — only one where it stops being a catastrophe. And the reason is purely mechanical: fewer bars means fewer trades means less friction. Which is the whole story.
2. Trading cost — the autopsy in six rows
| Cost per side | Net return (5-minute) |
|---|---|
| 0.00% (frictionless) | −9.2% |
| 0.02% | −79.9% |
| 0.04% | −95.5% |
| 0.06% (fee only) | −99.0% |
| 0.08% | −99.8% |
| 0.11% (realistic fee + slippage) | −100% |
Even with zero trading costs the 5-minute version is already a slight loser (−9%) — there is no edge to begin with. Then add cost and it falls off a cliff: at a mere 0.02% per side it is already −80%; at a realistic 0.11% it is a total loss. A strategy that fires ~1,500 times a year cannot survive any meaningful transaction cost, and this one has no gross edge to cushion the blow.
3. Take-profit to stop-loss ratio (TP : SL)
The stop is always the slowest SuperTrend line (12/3); here we vary only the take-profit, from half the risk distance out to five times it.
| TP : SL | Trades | Win rate | Profit factor | Net return |
|---|---|---|---|---|
| 1 : 0.5 | 8,526 | 40.7% | 0.25 | −100% |
| 1 : 0.75 | 6,619 | 48.4% | 0.41 | −100% |
| 1 : 1 | 5,298 | 47.0% | 0.52 | −100% |
| 1 : 1.25 | 4,377 | 42.6% | 0.56 | −100% |
| 1 : 1.5 (as taught) | 3,767 | 39.3% | 0.61 | −100% |
| 1 : 2 | 2,976 | 32.9% | 0.65 | −99.9% |
| 1 : 2.5 | 2,351 | 27.2% | 0.64 | −99.8% |
| 1 : 3 | 1,968 | 24.8% | 0.70 | −98.9% |
| 1 : 4 | 1,569 | 20.4% | 0.73 | −97.2% |
| 1 : 5 | 1,214 | 16.6% | 0.70 | −96.1% |
Not one ratio produces a profit factor above 1.0 — the best, 0.73 at 1:4, is still a loser. Tighten the target to 1:0.75 and the win rate climbs to 48%, but the wins are so small the profit factor collapses to 0.41. Widen it to 1:5 and the payoff per win grows while the win rate is strangled to 17%. There is no sweet spot, because the underlying signal has no edge to redistribute — moving the target only relocates the losses.
4. SuperTrend parameters
| Parameter set | Trades | Net return |
|---|---|---|
| Base — 10/1, 11/2, 12/3 (as taught) | 3,767 | −100% |
| Tight — 7/10/14 | 3,812 | −100% |
| Wide — factors ×1.5 | 2,846 | −99.9% |
| Slow — 14/16/20 | 3,963 | −100% |
5. Trade direction
| Direction | Trades | Win rate | Net return |
|---|---|---|---|
| Long + Short (as taught) | 3,767 | 39.3% | −100% |
| Long only | 2,753 | 40.0% | −99.8% |
| Short only | 2,934 | 39.4% | −99.8% |
It is not a “you traded the wrong way” problem either. Long-only, short-only, and both-directions all wipe out — the signal has no directional edge on this timeframe.
Bottom line: no timeframe, no reward-to-risk, no parameter set, and no direction turns this into something worth trading. The single setting that even stops the bleeding — the 4-hour chart — still loses to doing nothing at all.
Verdict: REJECT
- Gate 0 — Indicator fidelity — pass (our Python SuperTrend matches Pine’s ta.supertrend bar-for-bar)
- Gate 1 — Sanity — pass (signal on the closed bar, no look-ahead)
- Gate 2 — Friction — fail (a −9% gross becomes −100% net on 5m — pure whipsaw plus fees)
- Gate 3 — Yearly consistency — fail (negative in every calendar year of the sample (2024 −97%, 2025 −97%, 2026 −67%))
- Gate 4 — Out-of-sample — fail (both the in-sample and out-of-sample halves are negative)
- Gate 5 — Robustness — fail (every risk-reward and factor combination in the sweep loses)
- Gate 6 — Multi-market — fail (9 of 9 coins wiped out)
- Gate 7 — vs Buy & Hold — fail (the best timeframe, 4H +48%, still trails buy & hold +74%)
The triple-SuperTrend 5-minute setup is a textbook case of a strategy that looks systematic — three confirmations, a fixed stop, a clean 1.5 R target — but carries no positive expectancy before costs and a fatal one after them. A 39% win rate at 1.5 R is a losing bet by arithmetic; trading it roughly 1,500 times a year simply guarantees the outcome.
The lesson: confirmations do not create an edge. Stacking three of the same trend indicator does not triple your accuracy — it delays entries and multiplies whipsaws. Before trusting any “easy profits” setup, compute its break-even win rate and count how many times a year it fires. Those two numbers usually end the conversation.
Method. SuperTrend on Wilder ATR; entry at next-bar open, stop and target resolved intrabar; 0.06% fee + 0.05% slippage per side; Binance 5-minute data, 2024-01 to 2026-05; long and short both enabled. Figures are Strategy Verdict’s own renders on that data, not TradingView screenshots. This is research and education, not financial advice.
Leave a Reply