Tushar Chande’s Momentum Oscillator is a pure momentum zero-cross. It produced a familiar pattern in this series: a genuine gross edge destroyed by turnover. We ran the standard CMO(14) through the 7-Gate Protocol. Verdict: reject.
Methodology
- Data: Binance spot, Jul 2024–Jul 2026 (2 years), BTC/ETH/SOL/BNB/XRP
- Timeframes: 5m–1D (9 buckets, incl. resampled)
- Execution: CMO measures the balance of up-moves versus down-moves over 14 bars, scaled −100 to +100. Long above zero, short below. Closed-bar, no look-ahead
- Friction: 0.06%/side (real); 0-fee gross reported too. Benchmark: buy & hold
- Six axes: timeframe, cmo length, TP:SL, multi-coin, yearly, out-of-sample
Gate 0 — Fidelity
CMO measures the balance of up-moves versus down-moves over 14 bars, scaled −100 to +100. Long above zero, short below. Reproduced exactly (pass).
How It Behaves
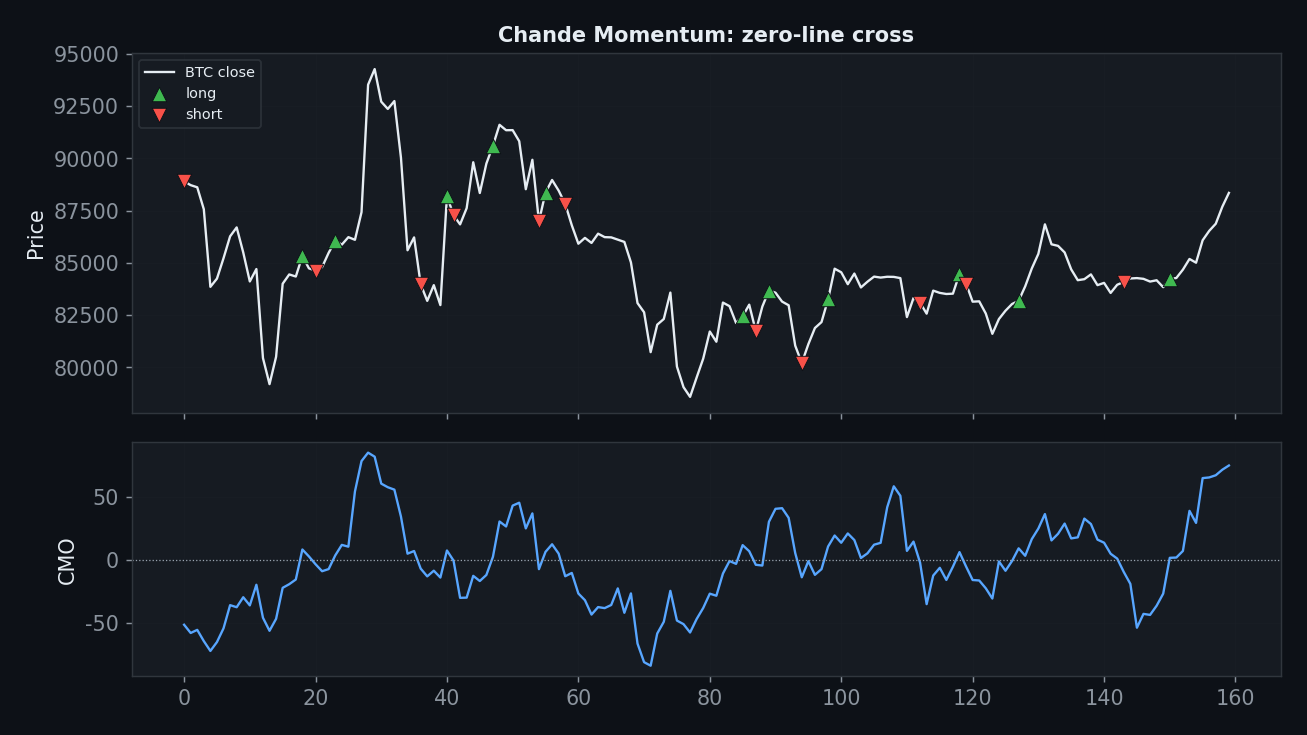
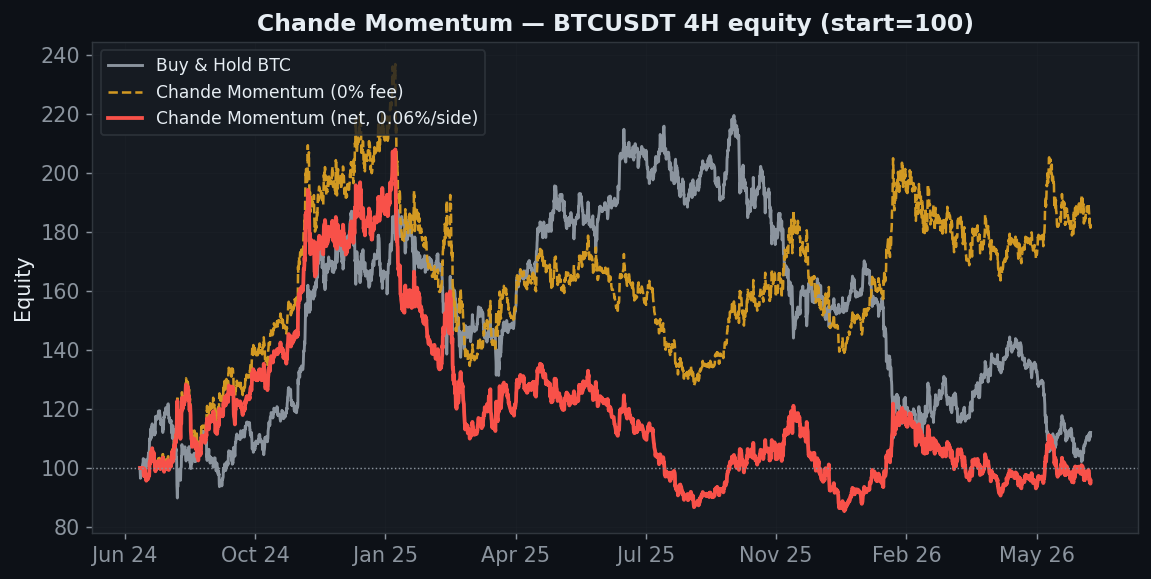
CMO catches momentum — at zero fees the BTC 4H returns +83%. But the zero-line is noisy, so the strategy flips 542 times, and at real fees that churn erases the entire edge.
Axis 1 — Timeframe
| Timeframe | Trades | Gross (0 fee) | Net (real) |
|---|---|---|---|
| 5분 | 26,670 | +4% | −100% |
| 15분 | 9,248 | −52% | −100% |
| 30분 | 4,675 | +11% | −100% |
| 1시간 | 2,271 | −35% | −96% |
| 2시간 | 1,137 | −38% | −84% |
| 4시간 | 542 | +83% | −4% |
| 6시간 | 362 | −31% | −56% |
| 12시간 | 174 | +35% | +9% |
| 1일 | 92 | +78% | +59% |
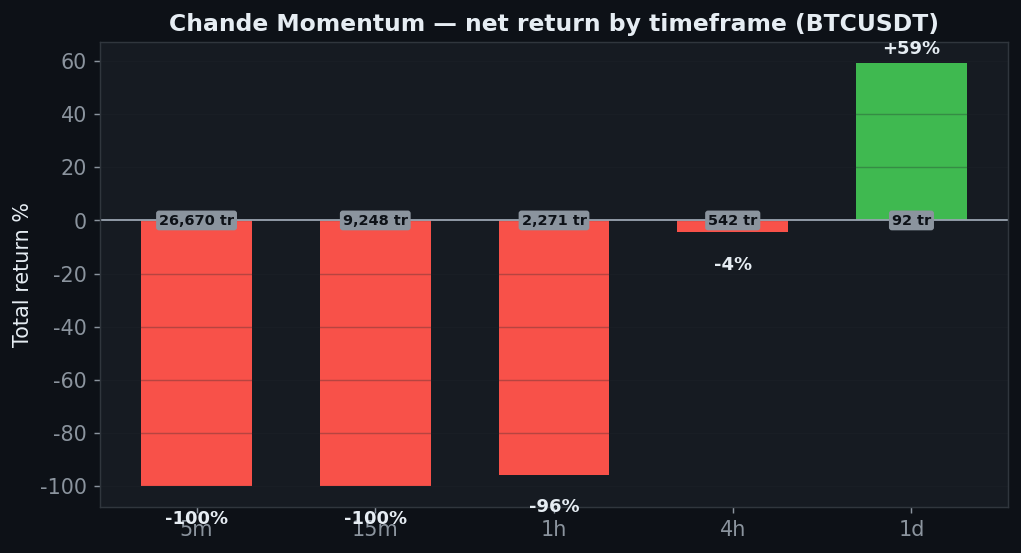
The 4H is +83% gross but −4.5% net; the daily is the lone net-positive timeframe (+59%). Everything else loses. A real signal, buried under transaction costs.
Axis 2 — CMO length
| CMO length | Net | PF |
|---|---|---|
| 9 | −60% | 1.02 |
| 14 | −4% | 1.21 |
| 20 | −50% | 0.98 |
| 28 | −52% | 0.97 |
| 40 | −23% | 1.08 |
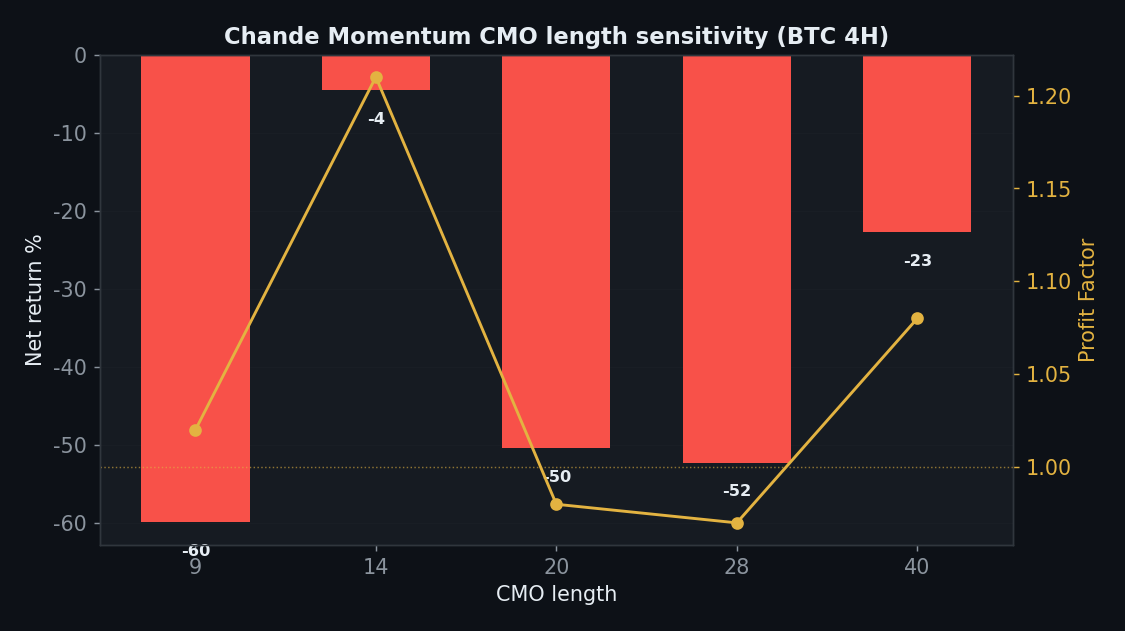
Every period length loses net — including the default 14 (−4.5%). The gross edge exists, but no length converts it to a net profit after the churn.
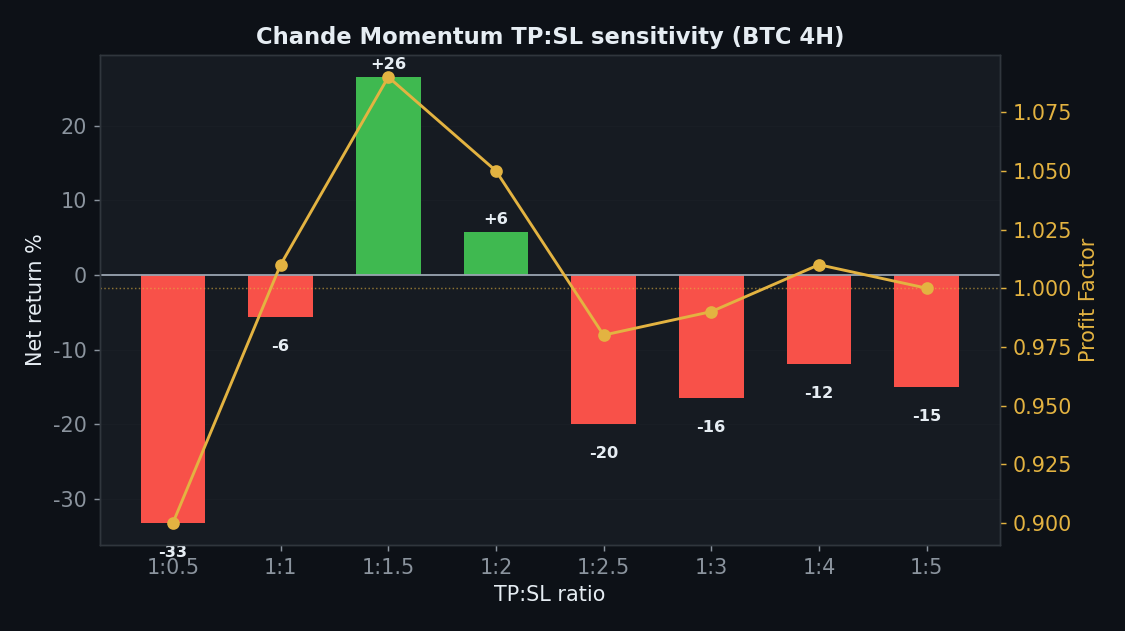
Axis 3 — TP:SL
| TP:SL | Net | PF |
|---|---|---|
| 1:0.5 | −33% | 0.90 |
| 1:1 | −6% | 1.01 |
| 1:1.5 | +26% | 1.09 |
| 1:2 | +6% | 1.05 |
| 1:2.5 | −20% | 0.98 |
| 1:3 | −16% | 0.99 |
| 1:4 | −12% | 1.01 |
| 1:5 | −15% | 1.00 |
Only 2 of 8 TP:SL ratios are positive. Some exits help a little, but not enough to overcome the turnover.
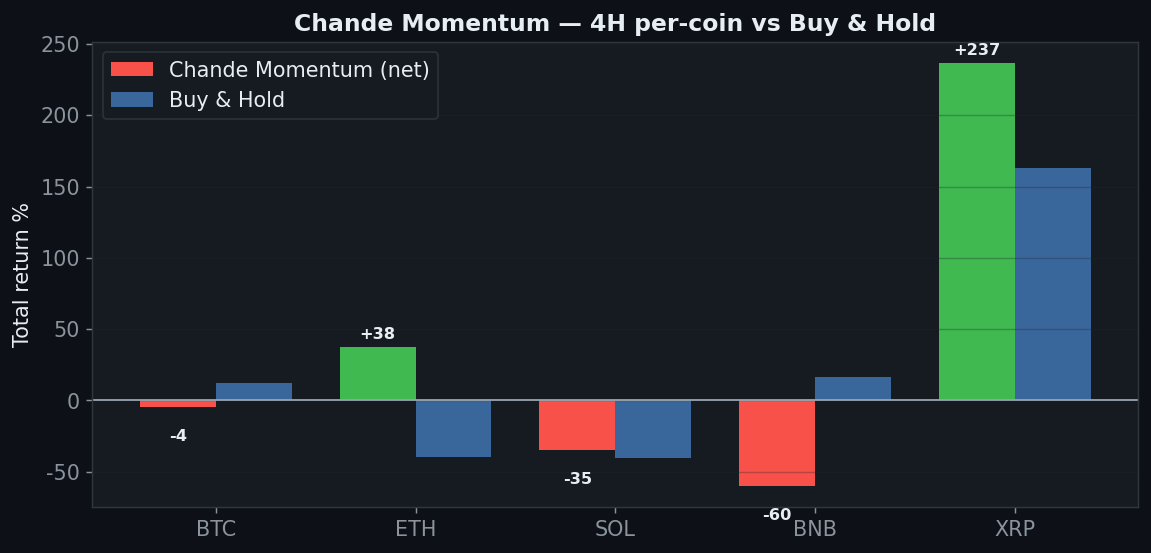
Axis 4 — Five Coins
| Coin | Strategy net | Buy & Hold |
|---|---|---|
| BTC | −4% | +12% |
| ETH | +38% | −40% |
| SOL | −35% | −40% |
| BNB | −60% | +17% |
| XRP | +237% | +163% |
2 of 5 positive (ETH +38%, XRP +237%), but BTC, SOL and BNB lose. As usual the wins concentrate in the big trenders.
Axis 5 — Yearly
| Year | BTC 4H net |
|---|---|
| 2024 | +80% |
| 2025 | −51% |
| 2026 | +9% |
2024 huge (+80%), 2025 −51%, 2026 +9%. Extreme regime dependence with a brutal chop year.
Axis 6 — Friction
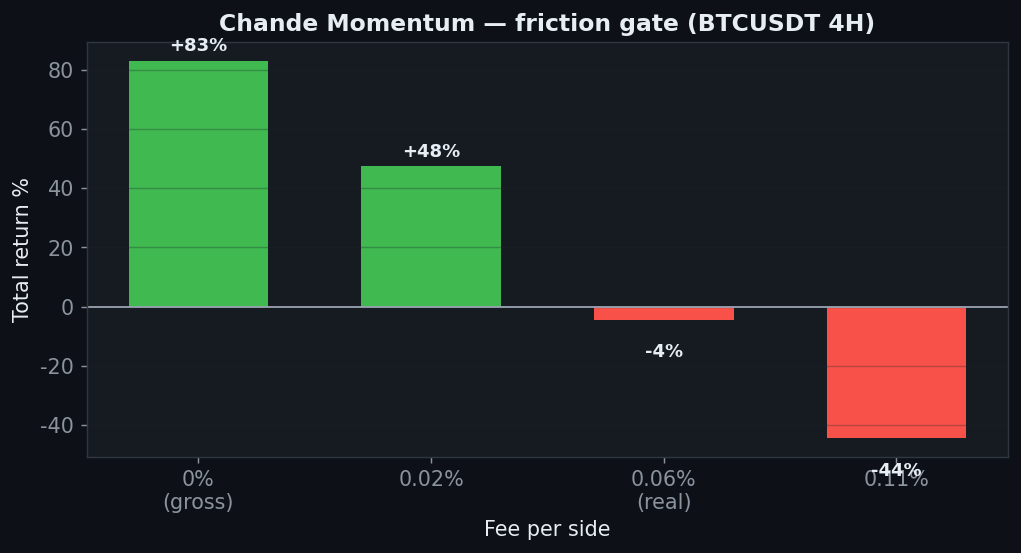
This is the whole story: +83% gross → −4.5% at the real 0.06% → −45% at 0.11%. 542 trades convert one of the largest gross edges in the series into a net loss.
The Verdict: REJECT
- Gate 0 — Indicator fidelity — pass (standard CMO(14))
- Gate 1 — Sanity — pass
- Gate 2 — Friction — fail — +83% gross collapses to −4.5% net; churn wins
- Gate 3 — Yearly — fail — +80 / −51 / +9
- Gate 4 — Robustness (length) — fail — 0 of 5 lengths net-positive
- Gate 5 — Robustness (TP:SL) — fail — 2 of 8 positive
- Gate 6 — Multi-market — fail — 2 of 5 coins
- Gate 7 — vs Buy & Hold — fail — 4H net negative, loses to holding
Chande’s Momentum Oscillator has one of the biggest gross edges in this whole series (+83% on BTC 4H) — and 542 trades of churn turn it into a −4.5% net loss. Every period length loses after fees. Like SSL and CMF, it’s a friction casualty: a real signal you cannot trade because the turnover eats it. Reject.
FAQ
If the gross edge is +83%, can’t I just trade fewer signals?
Only with a filter that cuts turnover without killing the edge — a different, unproven system. As taught (flip on every zero-cross), 542 trades erase it, and every length we tested lands net-negative.
The daily is +59% though.
On one timeframe, while every period length loses net on the 4H and 3 of 5 coins lose. One good timeframe doesn’t offset a signal that fails its friction and robustness gates.
Can I replicate this?
Yes — CMO(14) zero-cross, public Binance data, 0.06%/side, five coins, nine timeframes. Every table reproduces.
See also the fellow friction casualties SSL Channel and Chaikin Money Flow, and the conditional Vortex.
Disclaimer: educational research, not financial advice. Past performance does not guarantee future results. Never trade money you cannot afford to lose.
Leave a Reply