Chaikin Money Flow adds a volume dimension to momentum — the promise is that ‘smart money’ accumulation shows up before price. We ran the standard CMF(20) zero-cross through the 7-Gate Protocol to see whether volume adds a real edge. Verdict: reject.
Methodology
- Data: Binance spot, Jul 2024–Jul 2026 (2 years), BTC/ETH/SOL/BNB/XRP
- Timeframes: 5m–1D (9 buckets, incl. resampled)
- Execution: CMF sums volume weighted by where each close lands in its range, over 20 bars. Long when CMF is above zero (accumulation), short below (distribution). Closed-bar, no look-ahead
- Friction: 0.06%/side (real); 0-fee gross reported too. Benchmark: buy & hold
- Six axes: timeframe, cmf length, TP:SL, multi-coin, yearly, out-of-sample
Gate 0 — Fidelity
CMF sums volume weighted by where each close lands in its range, over 20 bars. Long when CMF is above zero (accumulation), short below (distribution). Reproduced exactly (pass).
How It Behaves
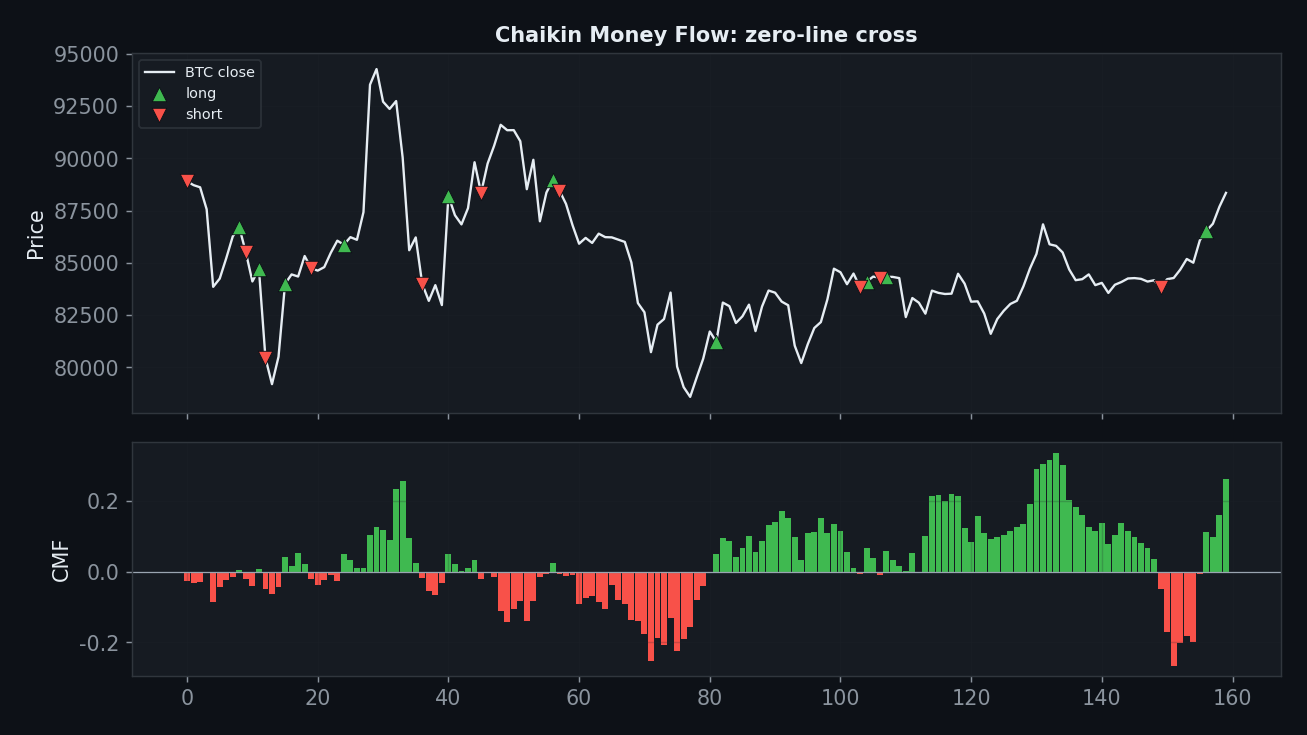
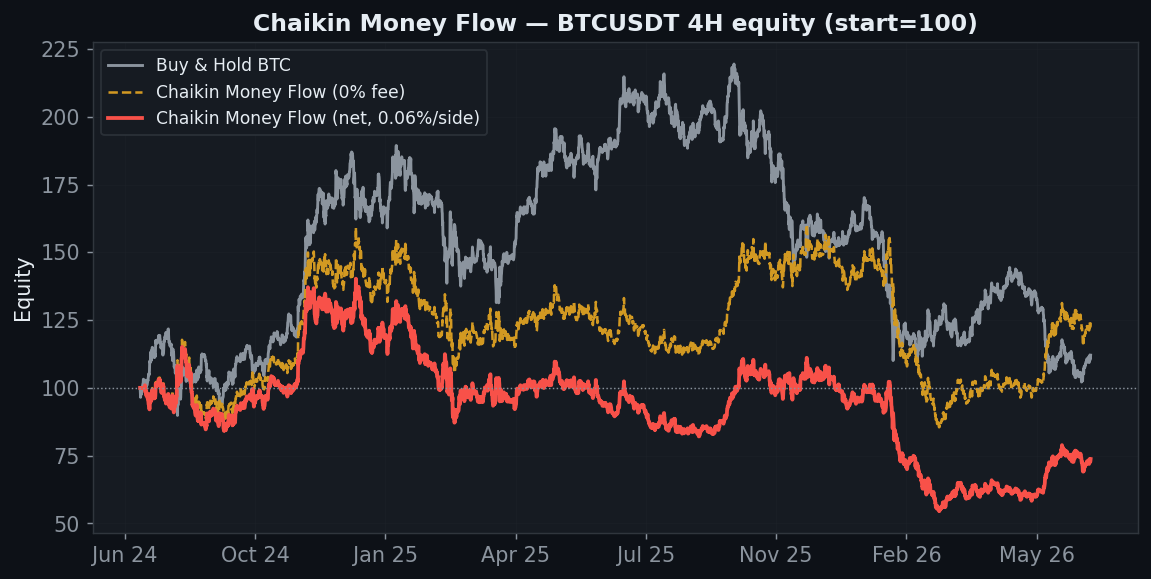
CMF is a zero-line oscillator, and zero-line crosses whipsaw in ranges just like price-based ones — the volume weighting doesn’t change that. It flips 434 times on the 4H, turning a small gross figure into a real loss.
Axis 1 — Timeframe
| Timeframe | Trades | Gross (0 fee) | Net (real) |
|---|---|---|---|
| 5분 | 22,627 | −81% | −100% |
| 15분 | 8,070 | −84% | −100% |
| 30분 | 4,004 | −79% | −100% |
| 1시간 | 1,956 | −55% | −96% |
| 2시간 | 1,064 | −71% | −92% |
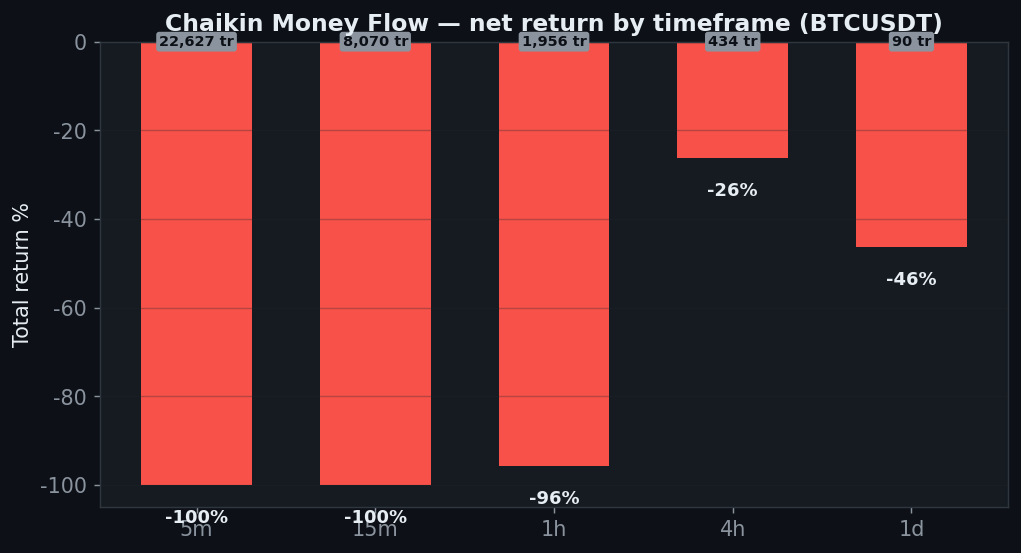
| 4시간 | 434 | +24% | −26% |
| 6시간 | 322 | −52% | −67% |
| 12시간 | 178 | −67% | −73% |
| 1일 | 90 | −40% | −46% |
Not one timeframe is positive. The 4H loses 26% net (and the daily 46%), so the volume signal doesn’t carry a directional edge on any horizon.
Axis 2 — CMF length
| CMF length | Net | PF |
|---|---|---|
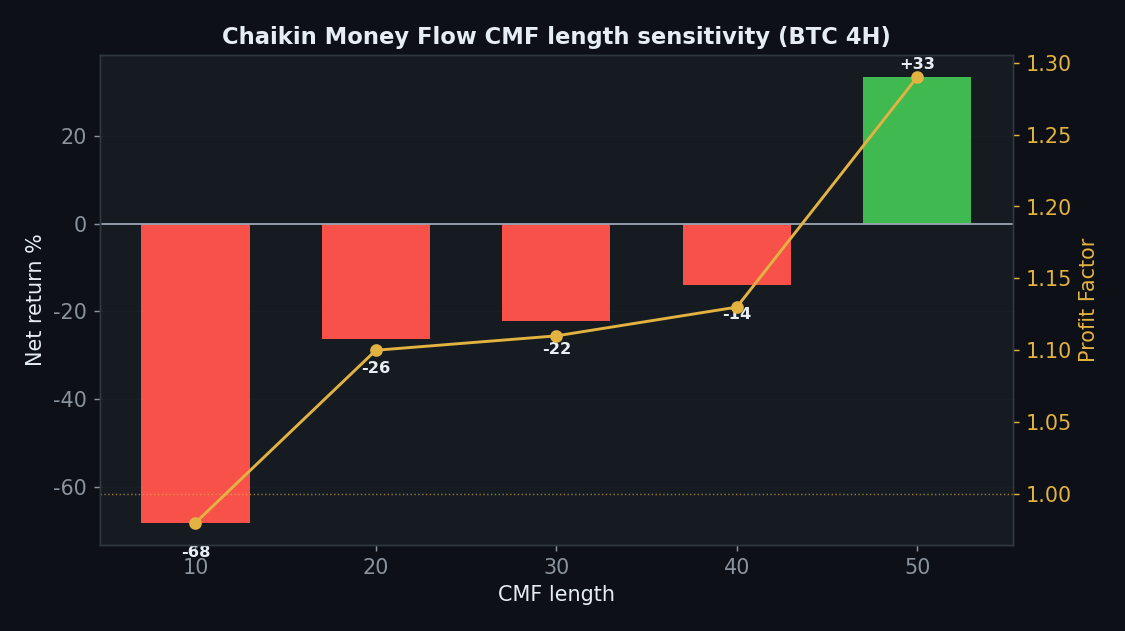
| 10 | −68% | 0.98 |
| 20 | −26% | 1.10 |
| 30 | −22% | 1.11 |
| 40 | −14% | 1.13 |
| 50 | +33% | 1.29 |
Only the longest length (50) is positive, the shorter ones all lose — a single outlier at the far end, not a robust setting.
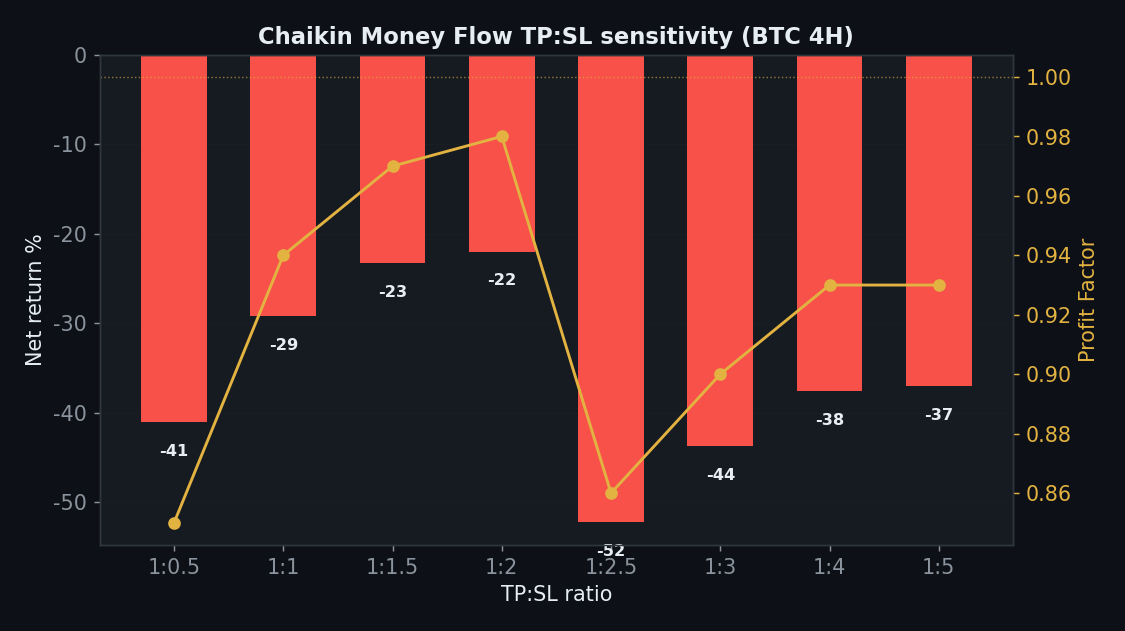
Axis 3 — TP:SL
| TP:SL | Net | PF |
|---|---|---|
| 1:0.5 | −41% | 0.85 |
| 1:1 | −29% | 0.94 |
| 1:1.5 | −23% | 0.97 |
| 1:2 | −22% | 0.98 |
| 1:2.5 | −52% | 0.86 |
| 1:3 | −44% | 0.90 |
| 1:4 | −38% | 0.93 |
| 1:5 | −37% | 0.93 |
All eight TP:SL ratios lose. With no gross edge worth protecting, no exit scheme helps.
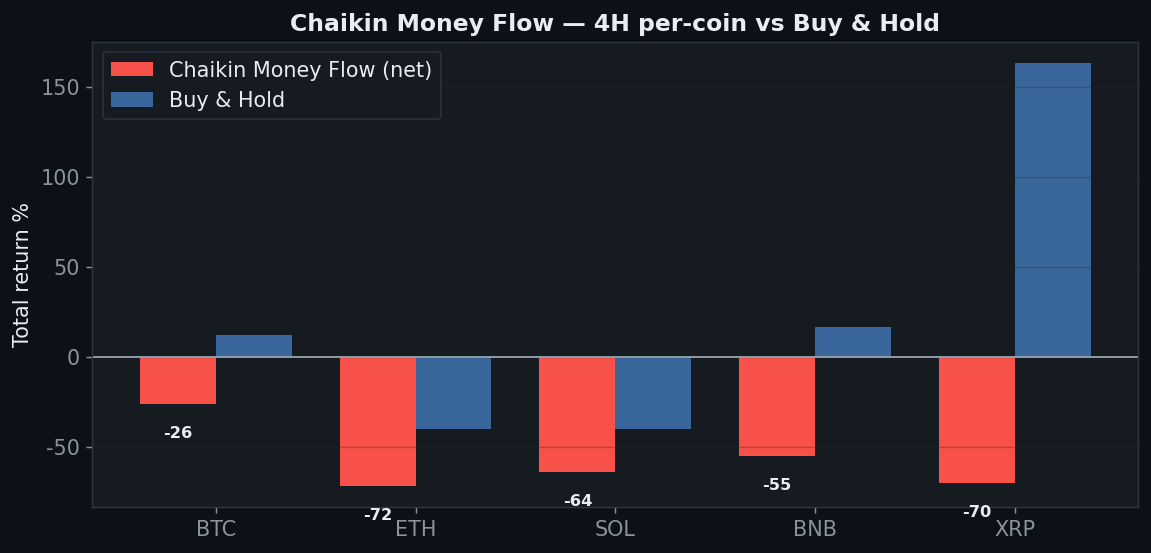
Axis 4 — Five Coins
| Coin | Strategy net | Buy & Hold |
|---|---|---|
| BTC | −26% | +12% |
| ETH | −72% | −40% |
| SOL | −64% | −40% |
| BNB | −55% | +17% |
| XRP | −70% | +163% |
0 of 5 coins positive. CMF loses on every market, including the ones that trended hard — missing XRP’s +163% entirely (−70%). Volume didn’t help pick direction anywhere.
Axis 5 — Yearly
| Year | BTC 4H net |
|---|---|
| 2024 | +14% |
| 2025 | −17% |
| 2026 | −21% |
2024 +14%, then 2025 (−17%) and 2026 (−21%) both lost. Net-negative and fading.
Axis 6 — Friction
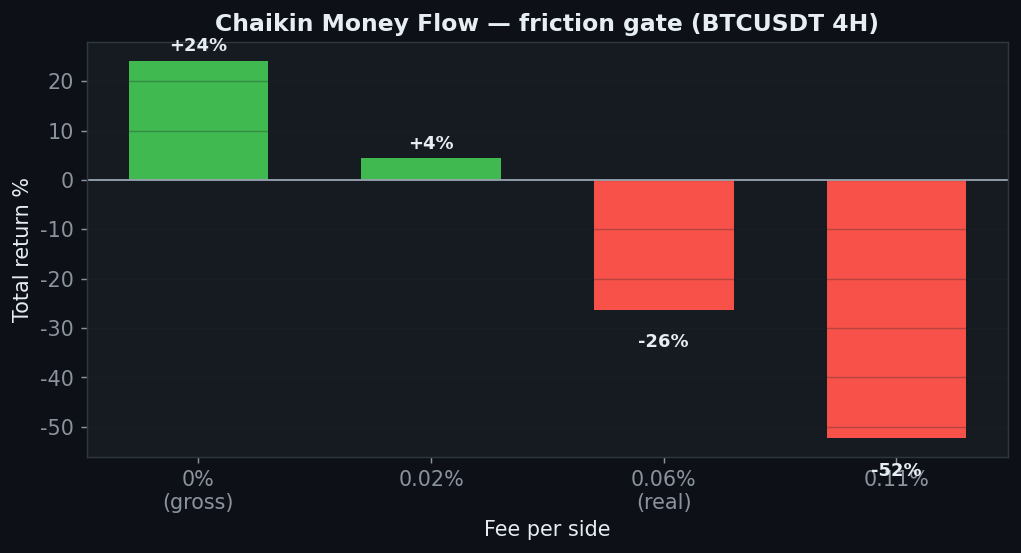
+24% gross → −26% net → −52% at 0.11%. 434 trades of churn convert a small gross number into a clear loss.
The Verdict: REJECT
- Gate 0 — Indicator fidelity — pass (standard CMF(20))
- Gate 1 — Sanity — pass
- Gate 2 — Friction — fail — +24% gross, −26% net on 4H
- Gate 3 — Yearly — fail — +14 / −17 / −21
- Gate 4 — Robustness (length) — fail — only 1 of 5 positive
- Gate 5 — Robustness (TP:SL) — fail — 0 of 8 positive
- Gate 6 — Multi-market — fail — 0 of 5 coins
- Gate 7 — vs Buy & Hold — fail — negative on every timeframe
Chaikin Money Flow tests the popular idea that volume reveals direction before price. It doesn’t — not as a zero-cross. CMF is net-negative on every timeframe, loses on all 5 coins, and every TP:SL ratio loses. The volume weighting adds nothing a plain zero-cross oscillator didn’t already fail at. Reject.
FAQ
Isn’t volume supposed to lead price?
That’s the theory, and it’s appealing. But as a mechanical zero-cross the volume weighting produces the same whipsaw as any oscillator, with no directional payoff on any timeframe or coin here.
Would CMF work as a filter instead?
Possibly as a confirmation layer on another entry — a different, unproven system. The standalone zero-cross we tested fails outright.
Can I replicate this?
Yes — CMF(20) zero-cross, public Binance data, 0.06%/side, five coins, nine timeframes. Every table reproduces.
See also the rejects Awesome Oscillator and Hull MA, and the conditional Vortex.
Disclaimer: educational research, not financial advice. Past performance does not guarantee future results. Never trade money you cannot afford to lose.
Leave a Reply