QQE is a favourite of crypto ‘free signal’ channels — a smoothed-RSI trailing system that fires clean-looking long/short arrows. We ran the standard QQE(14) through the 7-Gate Protocol. Verdict: reject.
Methodology
- Data: Binance spot, Jul 2024–Jul 2026 (2 years), BTC/ETH/SOL/BNB/XRP
- Timeframes: 5m–1D (9 buckets, incl. resampled)
- Execution: QQE smooths RSI, then wraps it in an ATR-of-RSI trailing line. Long when the smoothed RSI is above the trailing line, short when below. Closed-bar, no look-ahead
- Friction: 0.06%/side (real); 0-fee gross reported too. Benchmark: buy & hold
- Six axes: timeframe, rsi length, TP:SL, multi-coin, yearly, out-of-sample
Gate 0 — Fidelity
QQE smooths RSI, then wraps it in an ATR-of-RSI trailing line. Long when the smoothed RSI is above the trailing line, short when below. Reproduced exactly (pass).
How It Behaves
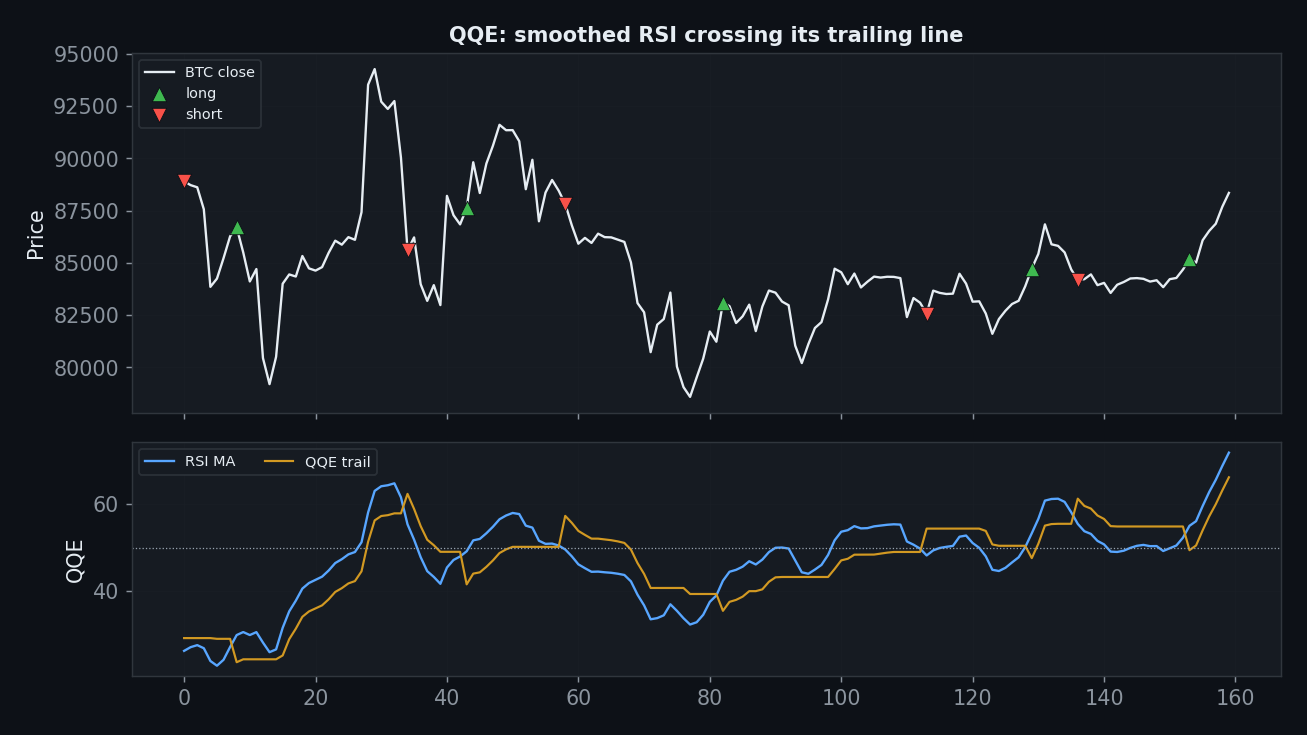
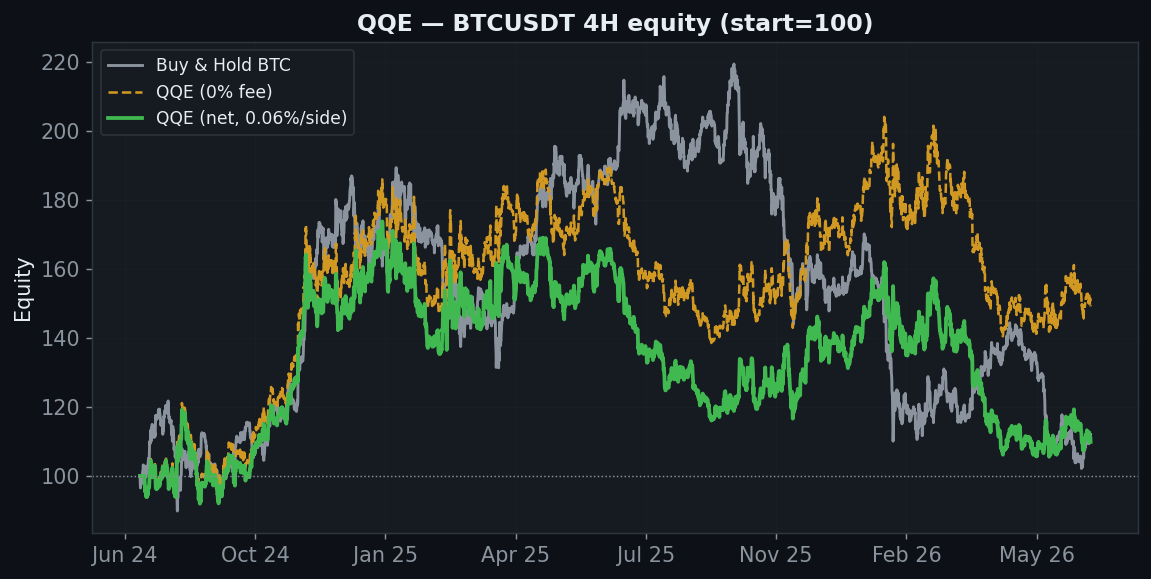
QQE is essentially a slower, smoothed RSI trend-follower. It holds through trends but, like every oscillator cross, flips during consolidations. On BTC 4H the smoothing keeps trades down (254) but the net still lands just under buy & hold.
Axis 1 — Timeframe
| Timeframe | Trades | Gross (0 fee) | Net (real) |
|---|---|---|---|
| 5분 | 12,936 | −73% | −100% |
| 15분 | 4,225 | −49% | −100% |
| 30분 | 2,053 | −17% | −93% |
| 1시간 | 1,057 | −66% | −91% |
| 2시간 | 525 | −52% | −75% |
| 4시간 | 254 | +49% | +10% |
| 6시간 | 169 | +28% | +4% |
| 12시간 | 86 | +16% | +5% |
| 1일 | 45 | −19% | −23% |
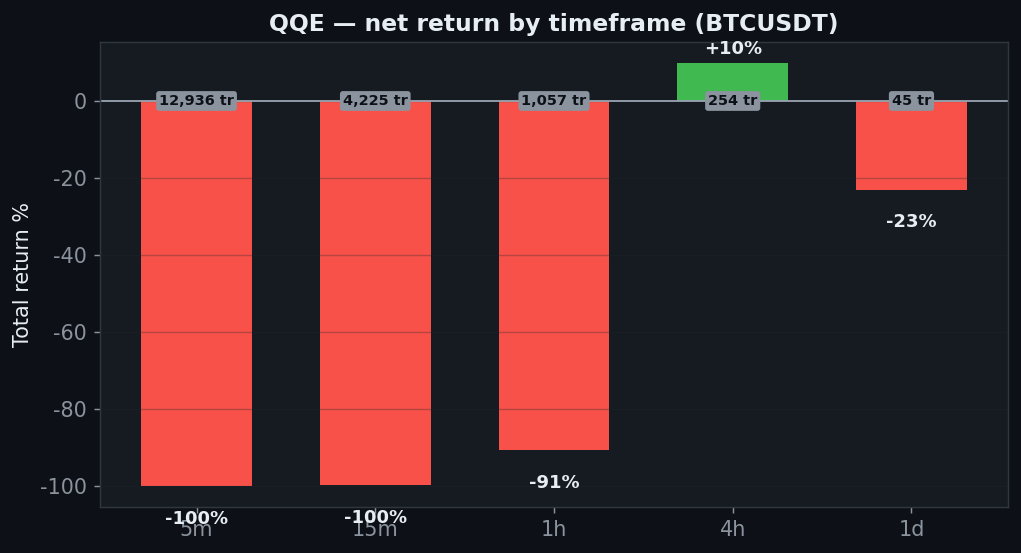
Only the 4H is positive (+10% net), and it sits just under buy & hold’s +12%. The daily loses 23%. One barely-positive timeframe is not an edge.
Axis 2 — RSI length
| RSI length | Net | PF |
|---|---|---|
| 8 | +28% | 1.23 |
| 14 | +10% | 1.18 |
| 21 | −19% | 1.09 |
| 28 | −38% | 0.97 |
| 35 | −40% | 0.96 |
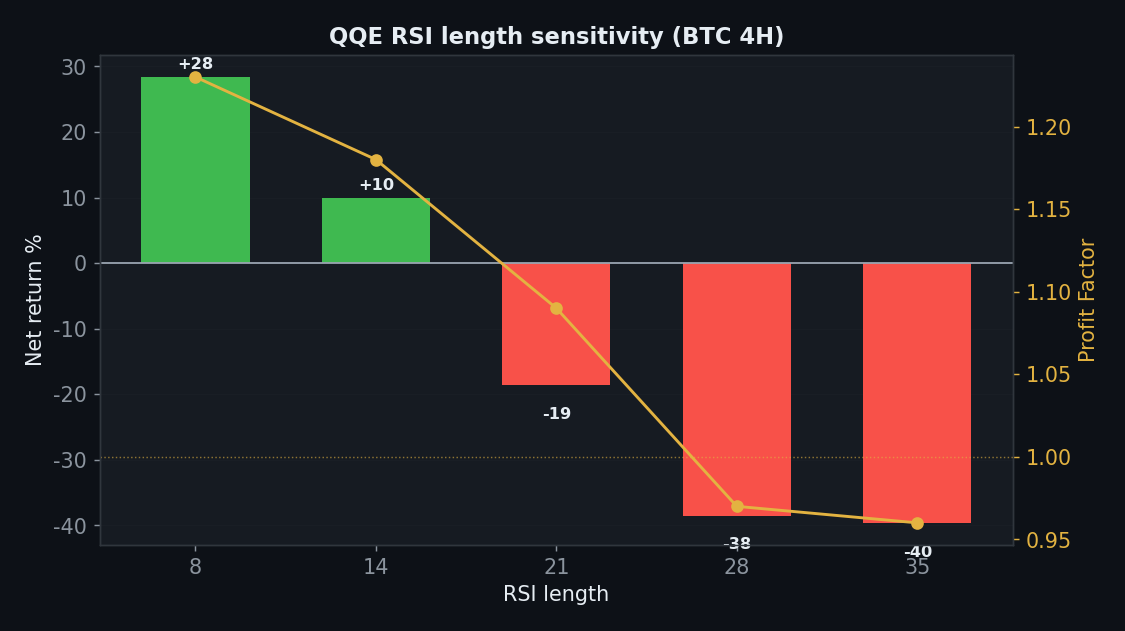
Only the short RSI lengths (8, 14) work; 21, 28 and 35 all lose. The taught default sits at the edge of the working zone, and the profit falls off a cliff just past it.
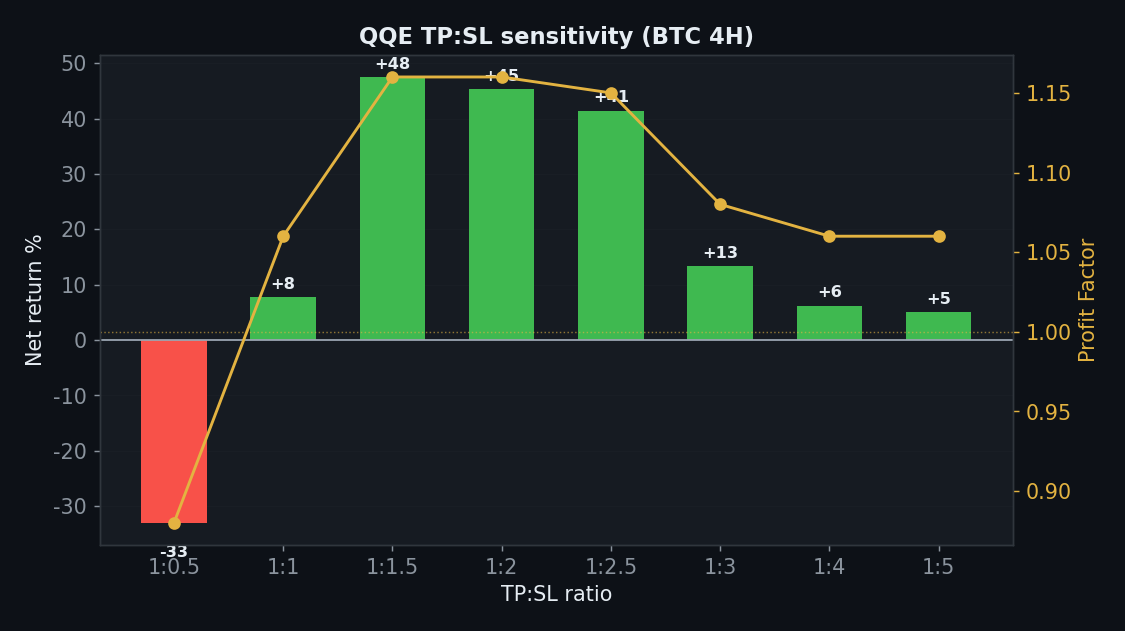
Axis 3 — TP:SL
| TP:SL | Net | PF |
|---|---|---|
| 1:0.5 | −33% | 0.88 |
| 1:1 | +8% | 1.06 |
| 1:1.5 | +48% | 1.16 |
| 1:2 | +45% | 1.16 |
| 1:2.5 | +41% | 1.15 |
| 1:3 | +13% | 1.08 |
| 1:4 | +6% | 1.06 |
| 1:5 | +5% | 1.06 |
7 of 8 take-profit ratios are positive — the one genuinely robust axis. But a good exit bolted onto a base that underperforms holding doesn’t create an edge.
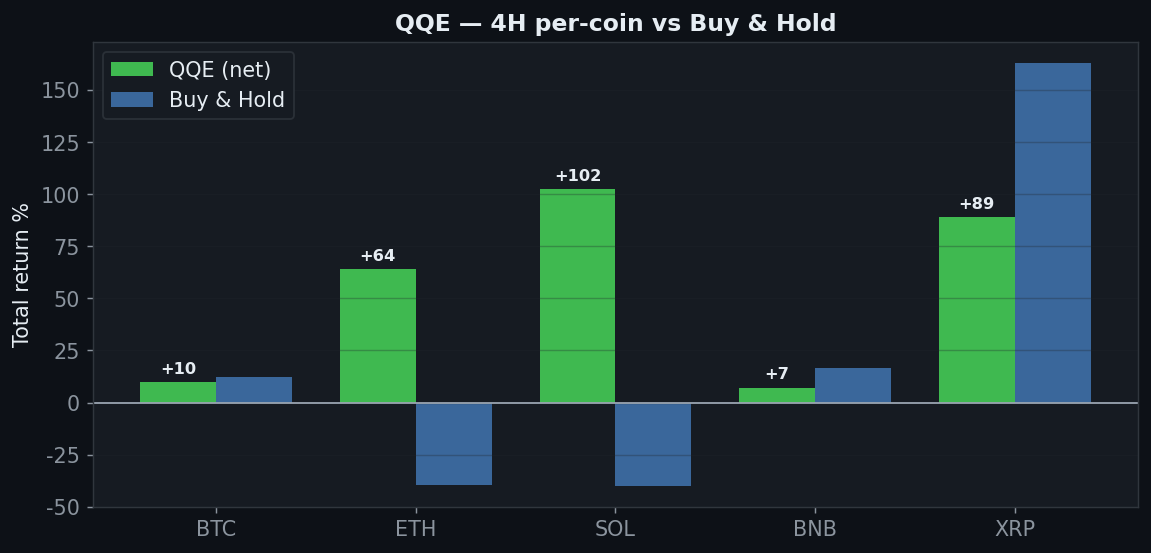
Axis 4 — Five Coins
| Coin | Strategy net | Buy & Hold |
|---|---|---|
| BTC | +10% | +12% |
| ETH | +64% | −40% |
| SOL | +102% | −40% |
| BNB | +7% | +17% |
| XRP | +89% | +163% |
Here’s the trap. All 5 coins are ‘positive’, but look closer: on BTC (+10% vs +12%), BNB (+7% vs +17%) and XRP (+89% vs +163%) QQE loses to buy & hold. Its only outperformance is ETH and SOL — both of which fell 40%, so QQE ‘won’ by shorting their downtrends. Versus the benchmark, it beats holding on exactly the two coins that dropped.
Axis 5 — Yearly
| Year | BTC 4H net |
|---|---|
| 2024 | +57% |
| 2025 | −15% |
| 2026 | −18% |
2024 carried it (+57%); 2025 (−15%) and 2026 (−18%) both lost. A single good year fading into two losers.
Axis 6 — Friction
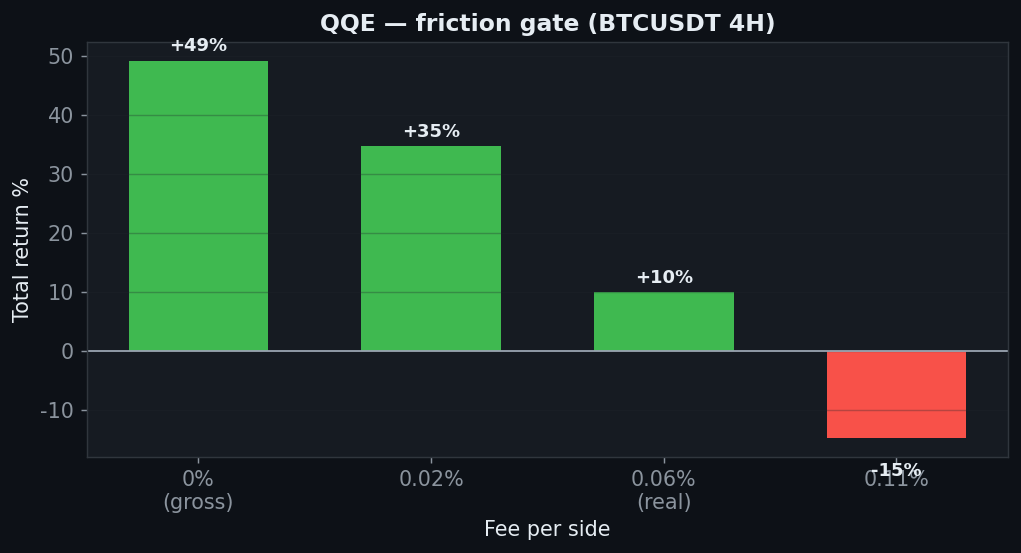
+49% gross → +10% net → −15% at 0.11%. The 254 trades make it churn-sensitive; the edge is gone on a higher-fee venue.
The Verdict: REJECT
- Gate 0 — Indicator fidelity — pass (standard QQE(14))
- Gate 1 — Sanity — pass
- Gate 2 — Friction — conditional — 4H survives to +10%, but only there and it dies at 0.11%
- Gate 3 — Yearly — fail — +57 / −15 / −18
- Gate 4 — Robustness (period) — fail — only 8 and 14 positive
- Gate 5 — Robustness (TP:SL) — pass — 7 of 8 positive
- Gate 6 — Multi-market — fail vs benchmark — 5/5 ‘positive’ but beats hold only on the two coins that fell (shorting)
- Gate 7 — vs Buy & Hold — fail — 4H +10% loses to +12%; daily loses
QQE looks great on the coin table — 5 of 5 positive — until you compare it to the benchmark: it beats buy & hold only on ETH and SOL, the two coins that dropped 40%, by shorting them. On BTC, BNB and XRP it underperforms holding, the daily loses, and only the default period works. The ‘positive everywhere’ headline is shorting-downtrends luck, not an edge that beats holding. Reject.
FAQ
But it’s positive on all five coins — isn’t that robust?
Positive isn’t the bar; beating buy & hold is. QQE only outperforms holding on the two coins that fell (by shorting), and loses to holding on the three that rose. That’s the opposite of a robust long-biased edge.
The signals look so clean on the chart.
Smoothed RSI produces tidy-looking arrows, which is why these channels love it. Measured forward, the 4H merely ties holding and every other timeframe loses.
Can I replicate this?
Yes — QQE(14), public Binance data, 0.06%/side, five coins, nine timeframes. Every table reproduces.
See also the conditional passes Vortex and TRIX, and the rejects Keltner and Awesome Oscillator.
Disclaimer: educational research, not financial advice. Past performance does not guarantee future results. Never trade money you cannot afford to lose.
Leave a Reply