The SSL Channel is a popular crypto trend tool: two smoothed bands of highs and lows, with a flip when price closes through one. It looks clean on the chart. We ran the standard SSL(10) through the 7-Gate Protocol — and it produced the most interesting failure in this batch. Verdict: reject.
Methodology
- Data: Binance spot, Jul 2024–Jul 2026 (2 years), BTC/ETH/SOL/BNB/XRP
- Timeframes: 5m–1D (9 buckets, incl. resampled)
- Execution: SSL builds two SMAs — one of highs, one of lows. Close above the high-SMA flips long; close below the low-SMA flips short. Closed-bar, no look-ahead
- Friction: 0.06%/side (real); 0-fee gross reported too. Benchmark: buy & hold
- Six axes: timeframe, ssl length, TP:SL, multi-coin, yearly, out-of-sample
Gate 0 — Fidelity
SSL builds two SMAs — one of highs, one of lows. Close above the high-SMA flips long; close below the low-SMA flips short. Reproduced exactly (pass).
How It Behaves
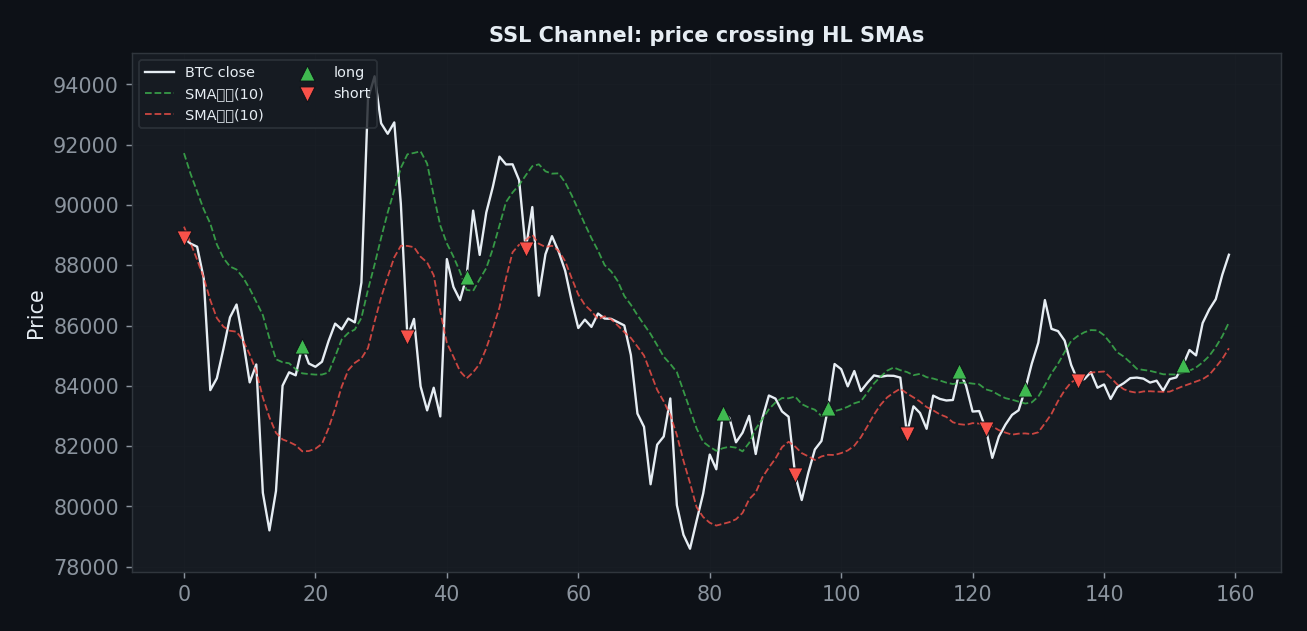
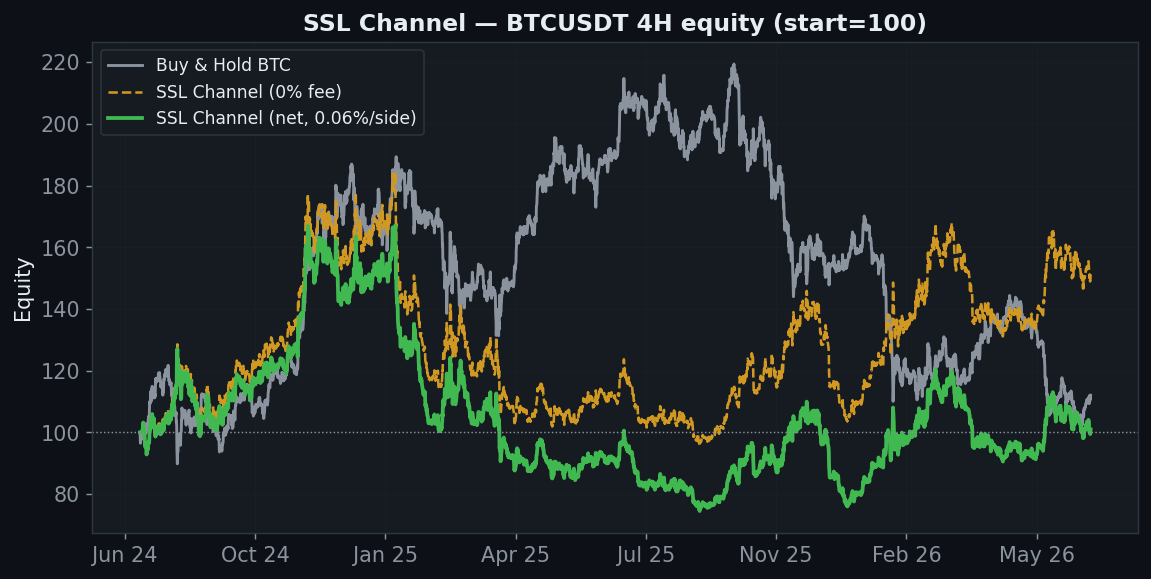
SSL genuinely catches trends: at zero fees the BTC 4H returns +51%. The problem is turnover. Price closes back and forth across the bands during consolidations, generating 336 trades — and at real fees those crossings eat the entire edge.
Axis 1 — Timeframe
| Timeframe | Trades | Gross (0 fee) | Net (real) |
|---|---|---|---|
| 5분 | 19,529 | −66% | −100% |
| 15분 | 6,256 | −32% | −100% |
| 30분 | 3,072 | −45% | −99% |
| 1시간 | 1,533 | −60% | −94% |
| 2시간 | 740 | −33% | −73% |
| 4시간 | 336 | +51% | +1% |
| 6시간 | 214 | +121% | +71% |
| 12시간 | 116 | −12% | −23% |
| 1일 | 54 | +22% | +15% |
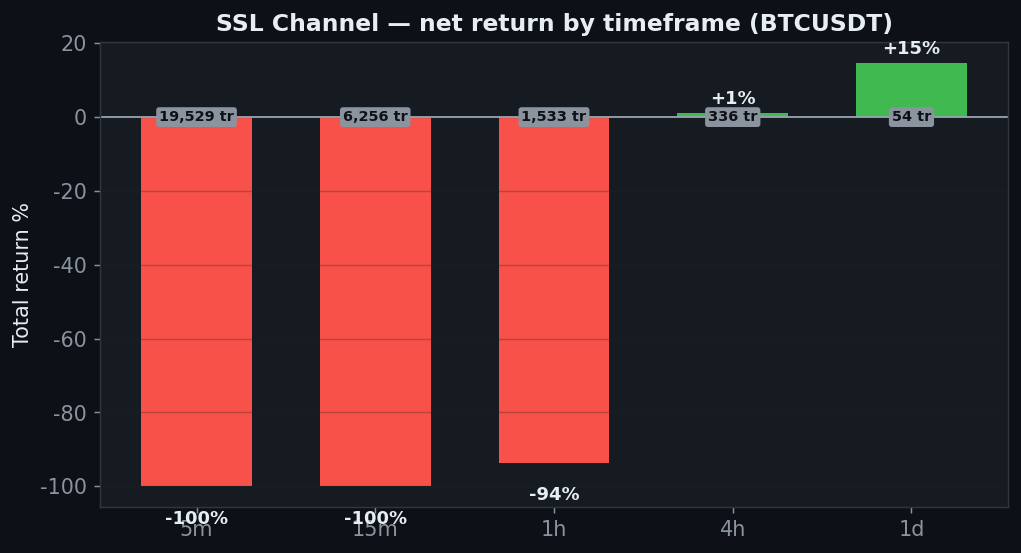
The 4H nets a mere +1% (from +51% gross), and the daily +15%. Every lower timeframe is deeply negative. There’s a real signal buried here, but only the daily keeps any of it after costs.
Axis 2 — SSL length
| SSL length | Net | PF |
|---|---|---|
| 7 | −49% | 1.00 |
| 10 | +1% | 1.17 |
| 14 | +39% | 1.28 |
| 21 | −3% | 1.13 |
| 28 | −46% | 0.92 |
| 40 | −40% | 0.93 |
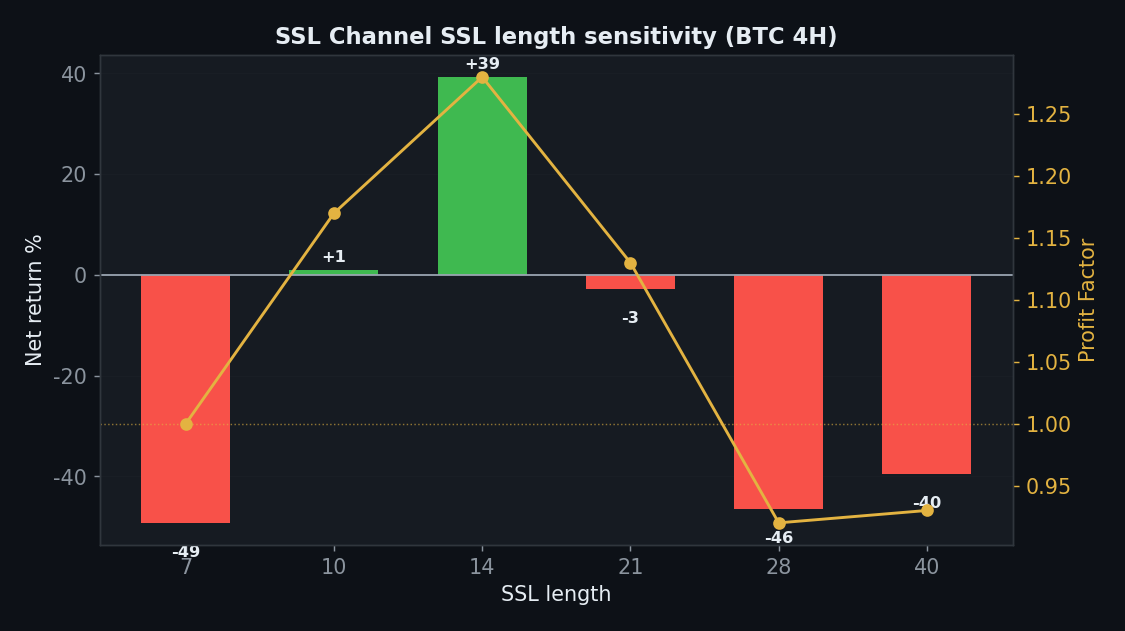
Length 14 is the sweet spot (+39%), 10 barely positive, and everything else negative. A narrow, fragile band of working settings around the default.
Axis 3 — TP:SL
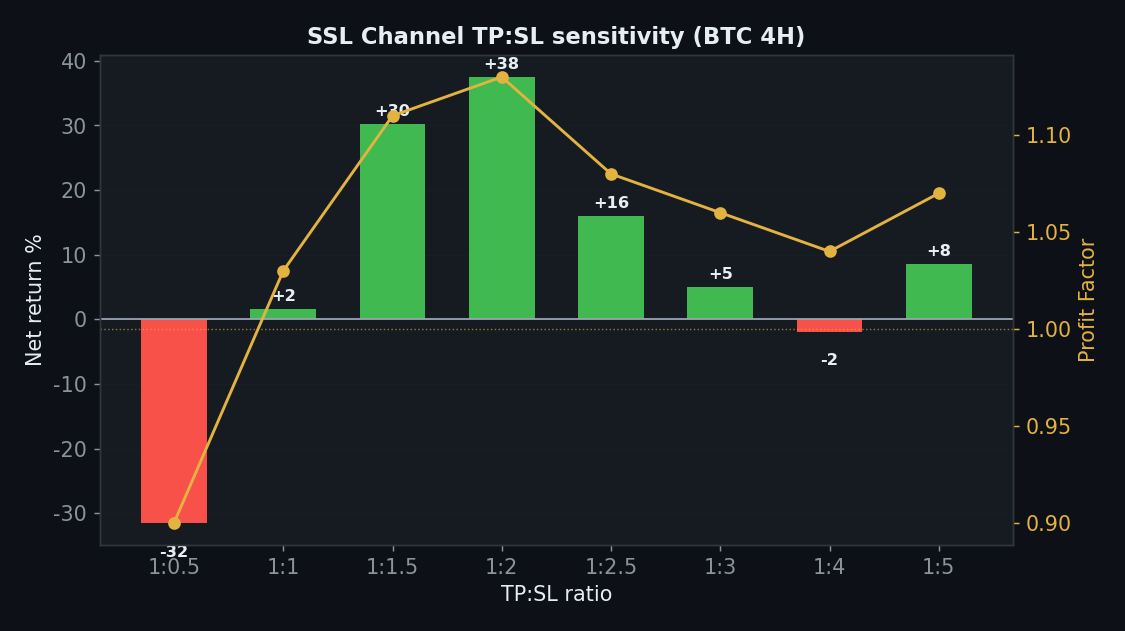
| TP:SL | Net | PF |
|---|---|---|
| 1:0.5 | −32% | 0.90 |
| 1:1 | +2% | 1.03 |
| 1:1.5 | +30% | 1.11 |
| 1:2 | +38% | 1.13 |
| 1:2.5 | +16% | 1.08 |
| 1:3 | +5% | 1.06 |
| 1:4 | −2% | 1.04 |
| 1:5 | +8% | 1.07 |
6 of 8 TP:SL ratios are positive — more evidence the underlying signal has merit. But a good exit can’t fix a strategy whose base version nets +1% after fees.
Axis 4 — Five Coins
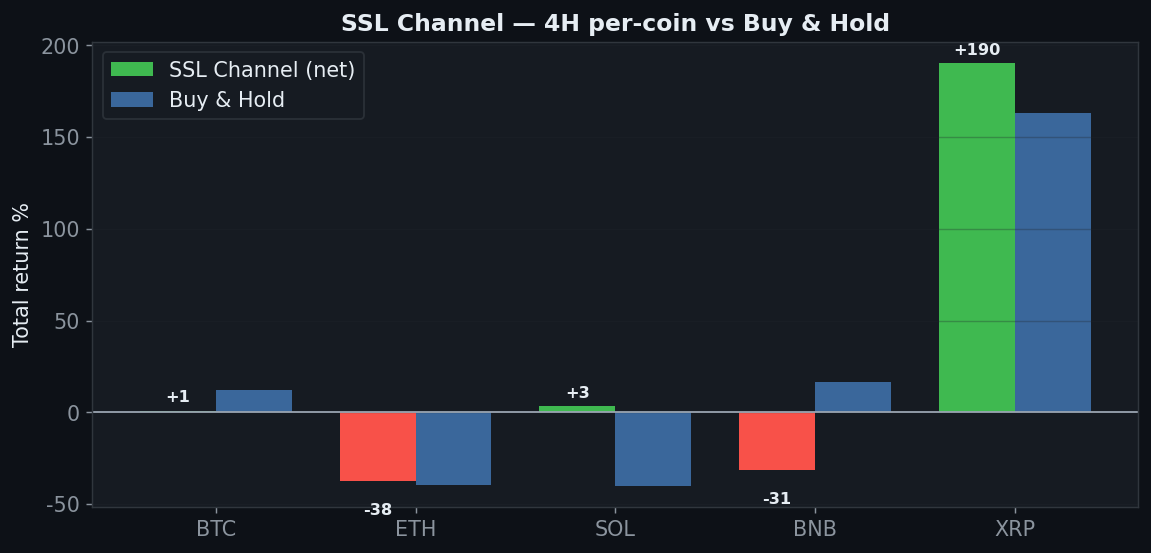
| Coin | Strategy net | Buy & Hold |
|---|---|---|
| BTC | +1% | +12% |
| ETH | −38% | −40% |
| SOL | +3% | −40% |
| BNB | −31% | +17% |
| XRP | +190% | +163% |
3 of 5 positive, but driven almost entirely by XRP (+191%). BTC nets +1%, SOL +3%, while ETH and BNB lose. Strip out the one big trender and there’s nothing left.
Axis 5 — Yearly
| Year | BTC 4H net |
|---|---|
| 2024 | +47% |
| 2025 | −48% |
| 2026 | +32% |
2024 strong (+47%), 2025 −48%, 2026 +32%. Net positive over the sample but with a brutal chop year — the classic trend-follower profile, without enough edge to justify it after costs.
Axis 6 — Friction
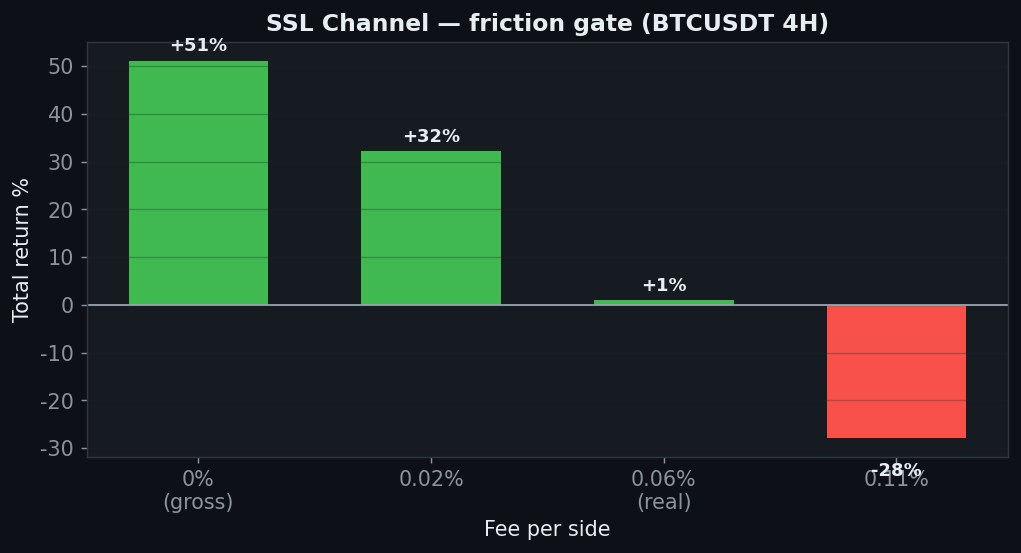
This is the whole story: +51% gross → +1% at the real 0.06% → −28% at 0.11%. The 336 trades convert a real edge into breakeven. SSL is a friction casualty.
The Verdict: REJECT
- Gate 0 — Indicator fidelity — pass (standard SSL(10))
- Gate 1 — Sanity — pass
- Gate 2 — Friction — fail — +51% gross collapses to +1% net; the edge is entirely eaten by churn
- Gate 3 — Yearly — fail — +47 / −48 / +32, too dependent on the trending years
- Gate 4 — Robustness (length) — fail — only 10 and 14 positive
- Gate 5 — Robustness (TP:SL) — pass — 6 of 8 positive
- Gate 6 — Multi-market — fail — 3 of 5, but driven by XRP alone
- Gate 7 — vs Buy & Hold — fail — 4H +1% loses to holding’s +12%
SSL is the honest tragedy of the batch: a real +51% gross edge on BTC 4H, dragged to +1% net by 336 trades of churn — below buy & hold. Only the daily keeps any edge after fees, and the multi-coin result leans entirely on XRP. A signal with merit and a turnover problem it can’t out-earn. On real spot fees, reject.
FAQ
If the gross edge is real, isn’t it worth trading?
Only if you can slash the turnover. As taught — flip on every band cross — the 336 trades convert +51% gross into +1% net. A confirmation filter or a higher timeframe (the daily kept +15%) is the only way it survives, and that’s a different, unproven system.
Why does it beat on XRP but not BTC?
XRP had one enormous clean trend the channel rode; BTC chopped more, so the crossings piled up. Profiting only where a giant trend happened to exist isn’t a repeatable edge.
Can I replicate this?
Yes — SSL(10) crossover, public Binance data, 0.06%/side, five coins, nine timeframes. Every table reproduces.
See also the conditional passes Vortex and Ichimoku, and the rejects Keltner and Donchian.
Disclaimer: educational research, not financial advice. Past performance does not guarantee future results. Never trade money you cannot afford to lose.