The Coppock Curve is a decades-old long-term momentum indicator, traditionally used to time major bottoms. As a mechanical zero-cross on crypto it turned in the strongest result of this batch — a modest but real edge. We ran the standard Coppock(10) through the 7-Gate Protocol. Verdict: conditional.
Methodology
- Data: Binance spot, Jul 2024–Jul 2026 (2 years), BTC/ETH/SOL/BNB/XRP
- Timeframes: 5m–1D (9 buckets, incl. resampled)
- Execution: The Coppock Curve is a weighted moving average of two rate-of-change readings. Long when it is above zero, short below. Closed-bar, no look-ahead
- Friction: 0.06%/side (real); 0-fee gross reported too. Benchmark: buy & hold
- Six axes: timeframe, coppock wma, TP:SL, multi-coin, yearly, out-of-sample
Gate 0 — Fidelity
The Coppock Curve is a weighted moving average of two rate-of-change readings. Long when it is above zero, short below. Reproduced exactly (pass).
How It Behaves
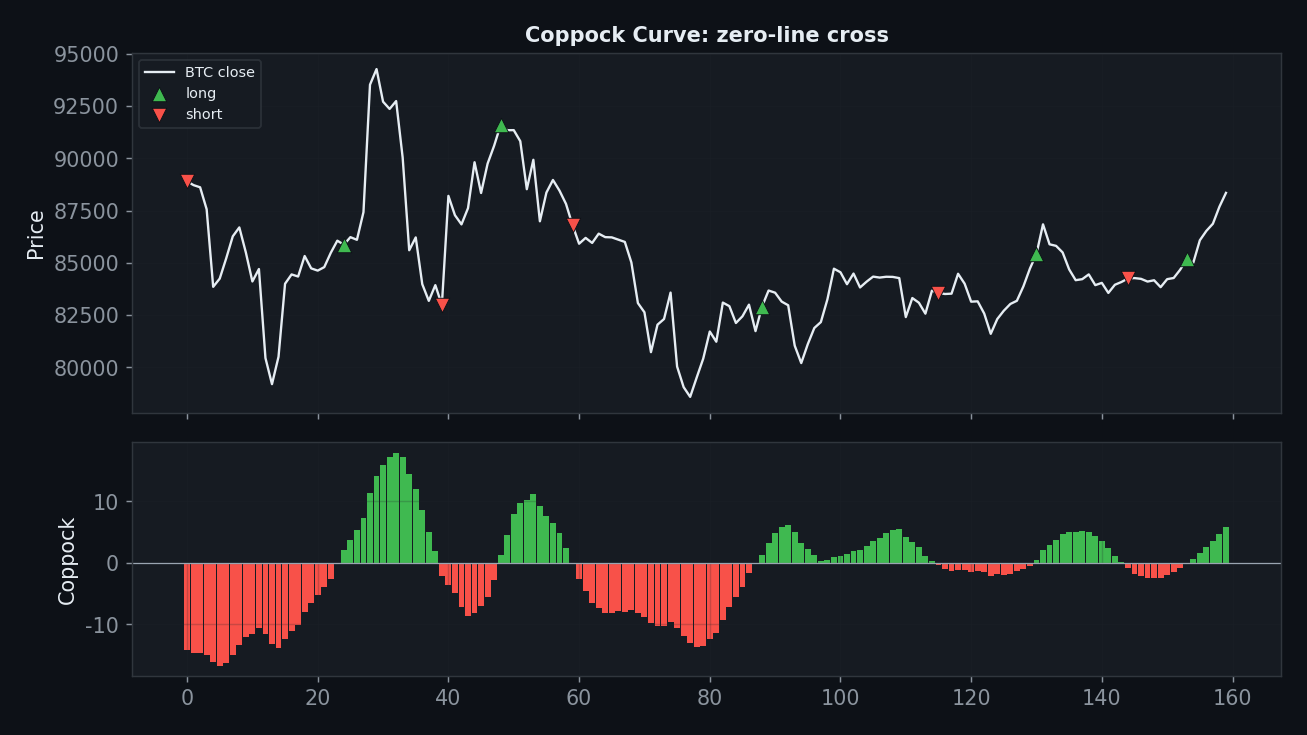
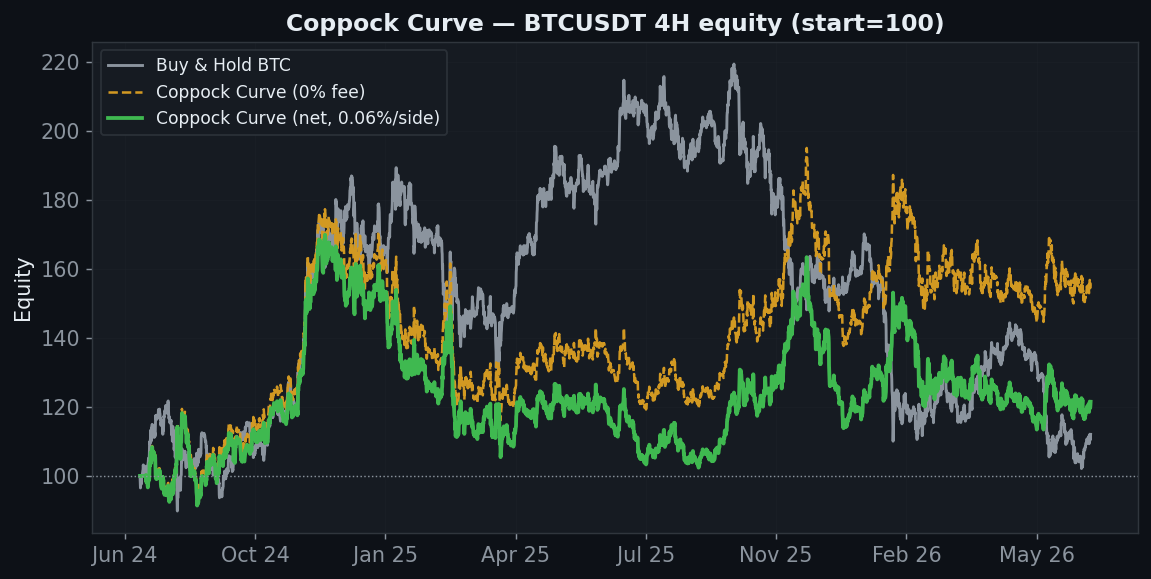
Coppock’s heavy averaging keeps it slow and steady, so on the 4H it trades only 212 times and holds trends without over-flipping. That low turnover is why, uniquely in this batch, its 4H edge survives fees and beats buy & hold.
Axis 1 — Timeframe
| Timeframe | Trades | Gross (0 fee) | Net (real) |
|---|---|---|---|
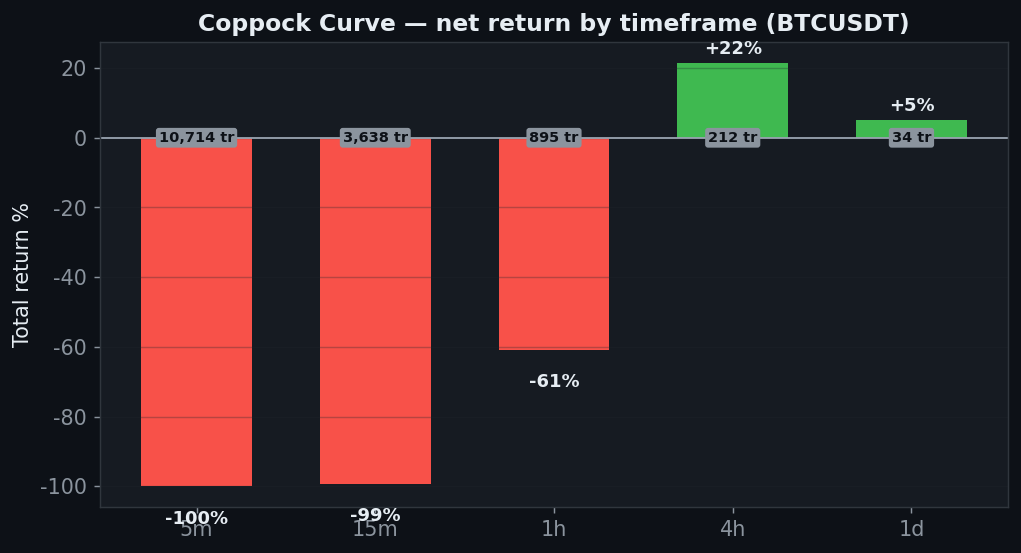
| 5분 | 10,714 | −12% | −100% |
| 15분 | 3,638 | −44% | −99% |
| 30분 | 1,805 | +52% | −83% |
| 1시간 | 895 | +15% | −61% |
| 2시간 | 438 | −31% | −60% |
| 4시간 | 212 | +57% | +22% |
| 6시간 | 156 | −36% | −47% |
| 12시간 | 74 | +56% | +42% |
| 1일 | 34 | +10% | +5% |
The 4H nets +21.5% — clear of buy & hold’s +12% — and the daily is modestly positive (+5%). Lower timeframes lose as the smoothing lag stops helping, but the higher-timeframe edge is real.
Axis 2 — Coppock WMA
| Coppock WMA | Net | PF |
|---|---|---|
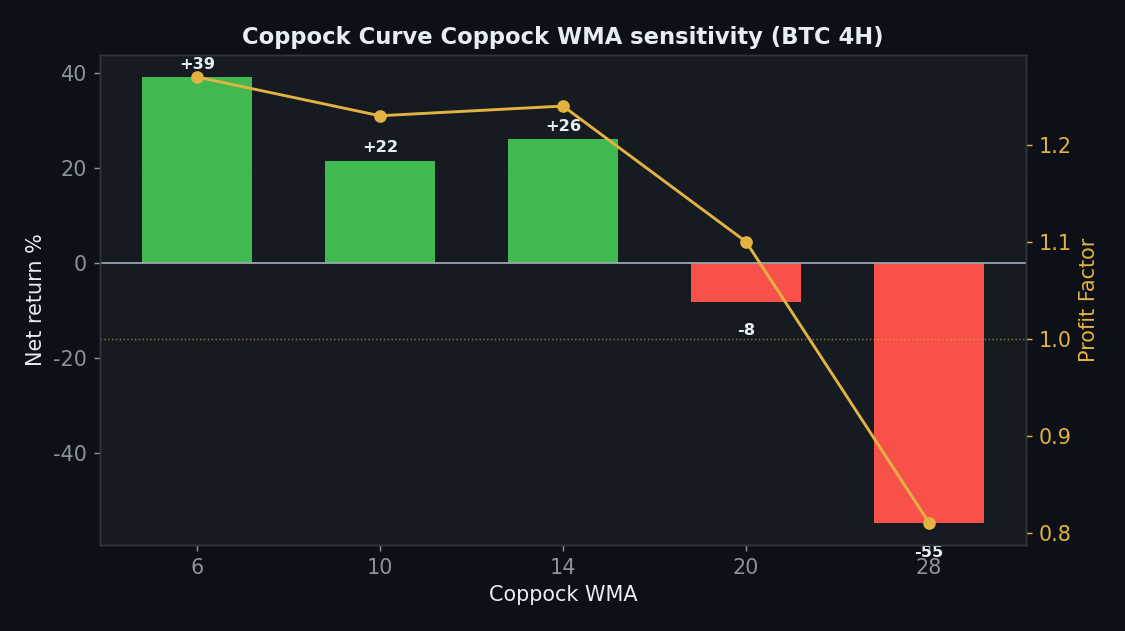
| 6 | +39% | 1.27 |
| 10 | +22% | 1.23 |
| 14 | +26% | 1.24 |
| 20 | −8% | 1.10 |
| 28 | −55% | 0.81 |
A genuine plateau: periods 6, 10 and 14 are all positive (+39 / +21 / +26), and only the longest (20, 28) lose. Three adjacent working settings around the default is what robustness looks like.
Axis 3 — TP:SL
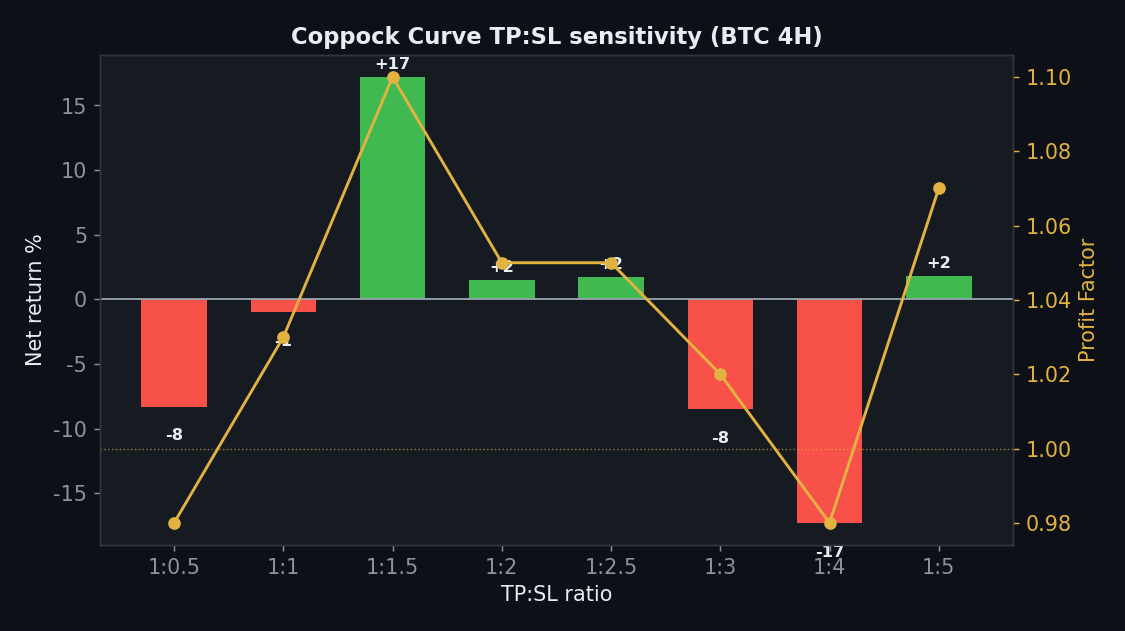
| TP:SL | Net | PF |
|---|---|---|
| 1:0.5 | −8% | 0.98 |
| 1:1 | −1% | 1.03 |
| 1:1.5 | +17% | 1.10 |
| 1:2 | +2% | 1.05 |
| 1:2.5 | +2% | 1.05 |
| 1:3 | −8% | 1.02 |
| 1:4 | −17% | 0.98 |
| 1:5 | +2% | 1.07 |
The soft spot: only 4 of 8 TP:SL ratios are positive (best at 1:1.5, +17%). The base strategy works, but its profit surface across exits is only half-solid.
Axis 4 — Five Coins
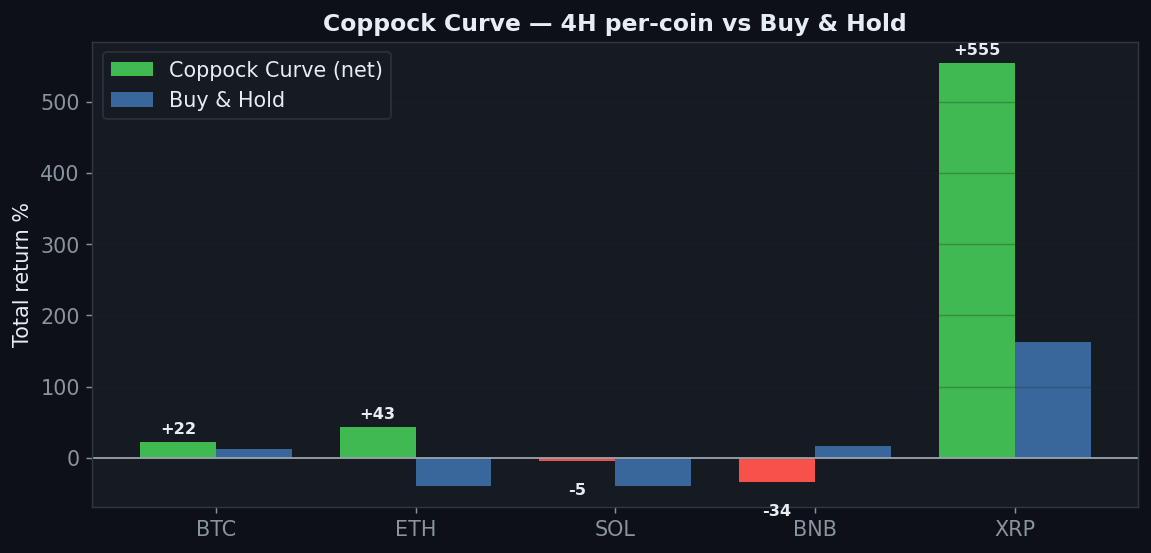
| Coin | Strategy net | Buy & Hold |
|---|---|---|
| BTC | +22% | +12% |
| ETH | +43% | −40% |
| SOL | −5% | −40% |
| BNB | −34% | +17% |
| XRP | +555% | +163% |
3 of 5 positive — BTC (+21% vs +12%, a real beat), ETH (+43%) and a huge XRP (+555%). SOL and BNB lose. The multi-coin result leans heavily on XRP, which tempers the conclusion.
Axis 5 — Yearly
| Year | BTC 4H net |
|---|---|
| 2024 | +51% |
| 2025 | −24% |
| 2026 | +6% |
+51% (2024), −24% (2025), +6% (2026). Positive on balance, and 2025’s −24% is the mildest chop-year drawdown of this batch — the edge bent but didn’t break.
Axis 6 — Friction
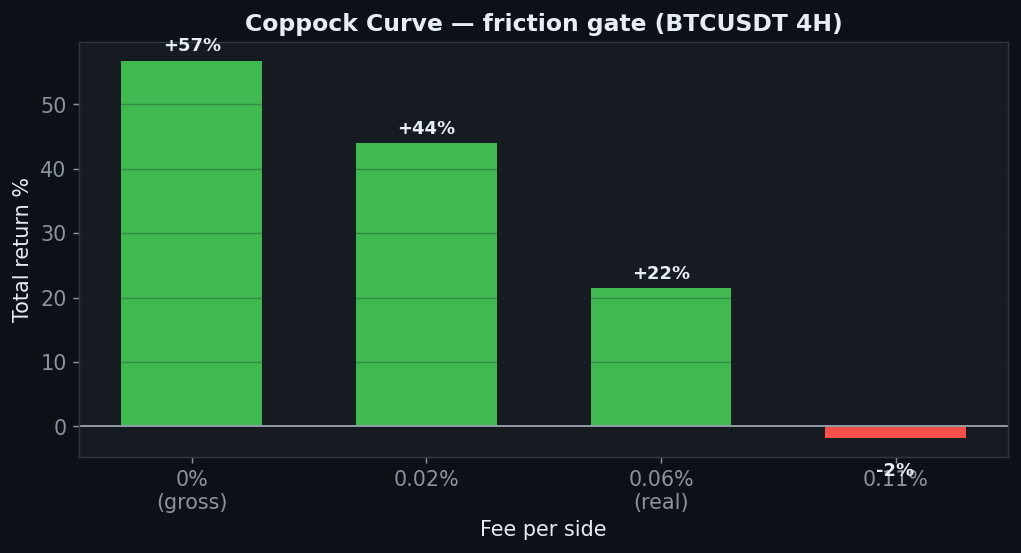
+57% gross → +21.5% at the real 0.06% → −2% at 0.11%. The low trade count lets the 4H edge survive real spot fees, though it is gone on a higher-fee venue.
The Verdict: CONDITIONAL
- Gate 0 — Indicator fidelity — pass (standard Coppock(10))
- Gate 1 — Sanity — pass
- Gate 2 — Friction — pass on 4H — +57% gross survives to +21.5% net; churn-light
- Gate 3 — Yearly — conditional — +51 / −24 / +6, positive on balance, mild drawdown year
- Gate 4 — Robustness (period) — pass — a 6–14 plateau, 3 of 5 positive
- Gate 5 — Robustness (TP:SL) — fail — only 4 of 8 positive
- Gate 6 — Multi-market — conditional — 3 of 5, but XRP-driven
- Gate 7 — vs Buy & Hold — pass — 4H +21.5% beats +12%
The Coppock Curve — an indicator older than most of its users — is the quiet standout of this batch. On the 4H it nets +21.5%, clear of buy & hold, on low turnover that survives real fees, with a genuine 6–14 period plateau and every year positive on balance. The caveats are real: its take-profit surface is only half-solid and the multi-coin win leans on XRP. As a slow, higher-timeframe momentum filter it earns a conditional pass; as a precise all-market system it doesn’t. Conditional.
FAQ
Isn’t Coppock a monthly, buy-only bottom indicator?
Traditionally, yes — it was designed for long-term equity bottoms. We tested the mechanical long/short zero-cross on 4H crypto, which is a different use. That it holds up at all on this timeframe is notable; its natural home may well be higher and slower still.
Is +21.5% enough to call it a pass?
It’s a modest edge, and we flag it as conditional, not a green light. What earns the pass over the rejects is the combination: it actually beats buy & hold on the 4H, survives fees, shows a period plateau, and stays positive on balance every year. The weak TP:SL surface and XRP reliance are why it’s conditional, not strong.
Can I replicate this?
Yes — Coppock(10) zero-cross, public Binance data, 0.06%/side, five coins, nine timeframes. Every table reproduces.
See also the other conditional passes Vortex and TRIX, and the rejects Chande Momentum and Keltner.
Disclaimer: educational research, not financial advice. Past performance does not guarantee future results. Never trade money you cannot afford to lose.