Bill Williams’ Awesome Oscillator (AO) is a staple momentum histogram: the gap between a fast and slow average of the median price. The taught signal is the zero-line cross. We ran the standard AO(5/34) through the 7-Gate Protocol. Verdict: reject.
Methodology
- Data: Binance spot, Jul 2024–Jul 2026 (2 years), BTC/ETH/SOL/BNB/XRP
- Timeframes: 5m–1D (9 buckets, incl. resampled)
- Execution: The Awesome Oscillator is SMA(median, 5) minus SMA(median, 34). Long when AO is above zero, short when below. Closed-bar, no look-ahead
- Friction: 0.06%/side (real); 0-fee gross reported too. Benchmark: buy & hold
- Six axes: timeframe, slow sma, TP:SL, multi-coin, yearly, out-of-sample
Gate 0 — Fidelity
The Awesome Oscillator is SMA(median, 5) minus SMA(median, 34). Long when AO is above zero, short when below. Reproduced exactly (pass).
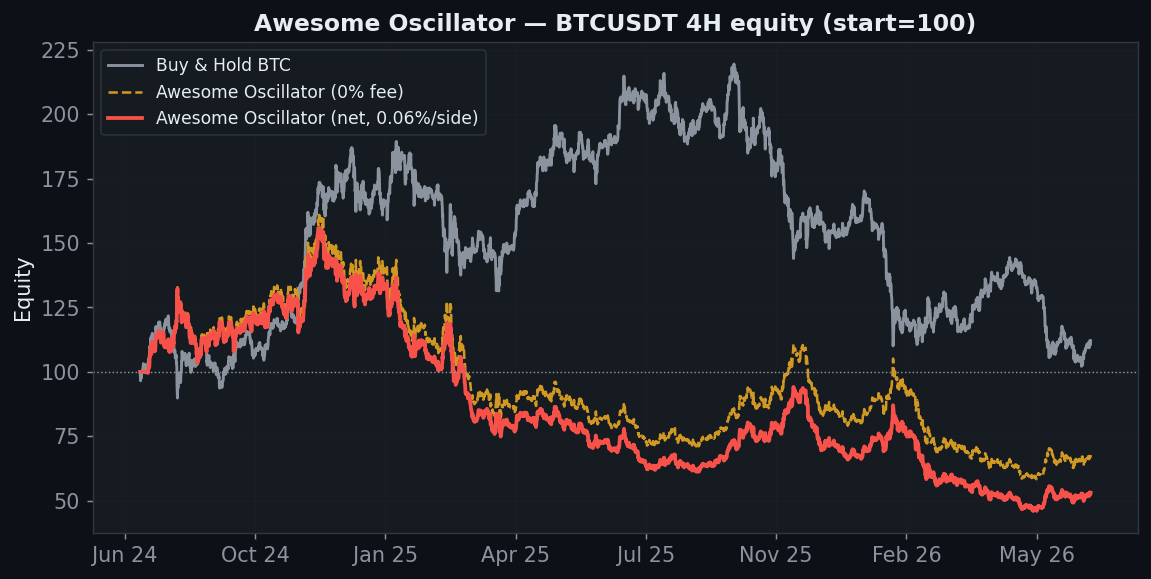
How It Behaves
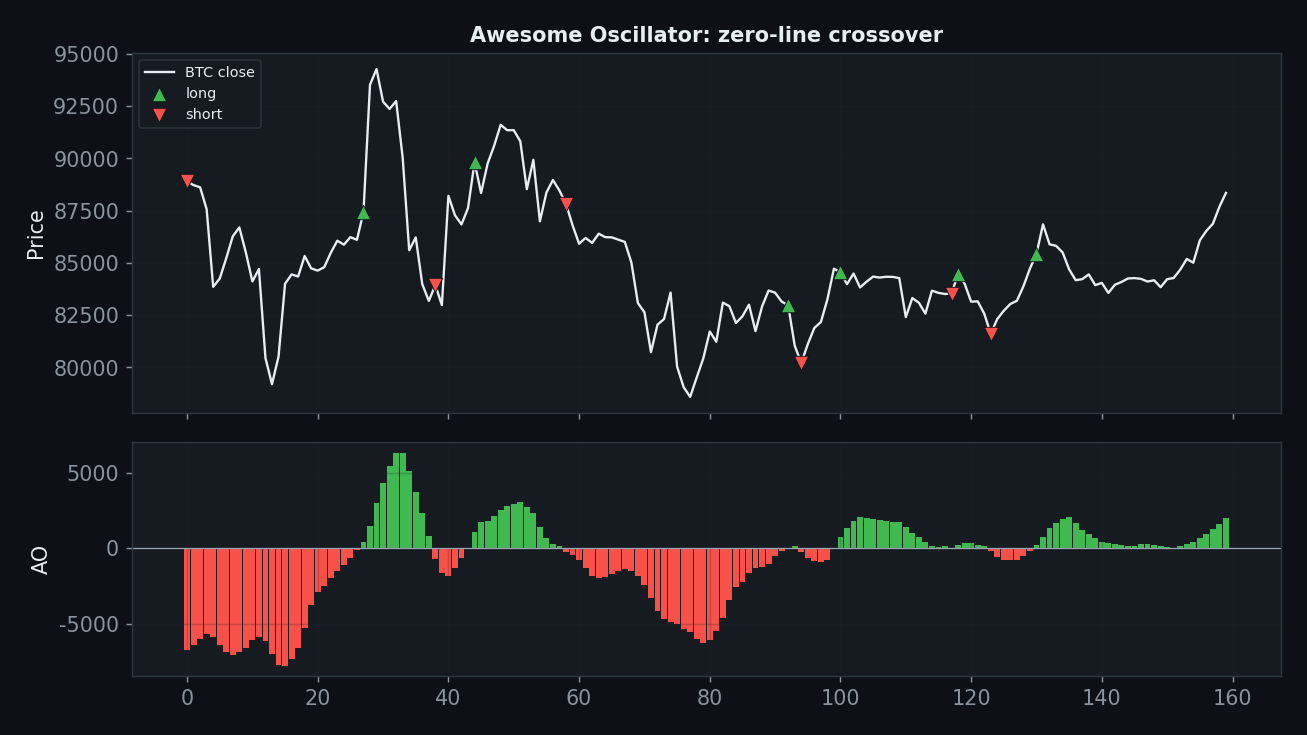
The zero-line cross is a slow, laggy dual-SMA crossover in disguise. It enters late into moves and, in choppy conditions, crosses back and forth around zero — late entries plus whipsaw, the worst of both.
Axis 1 — Timeframe
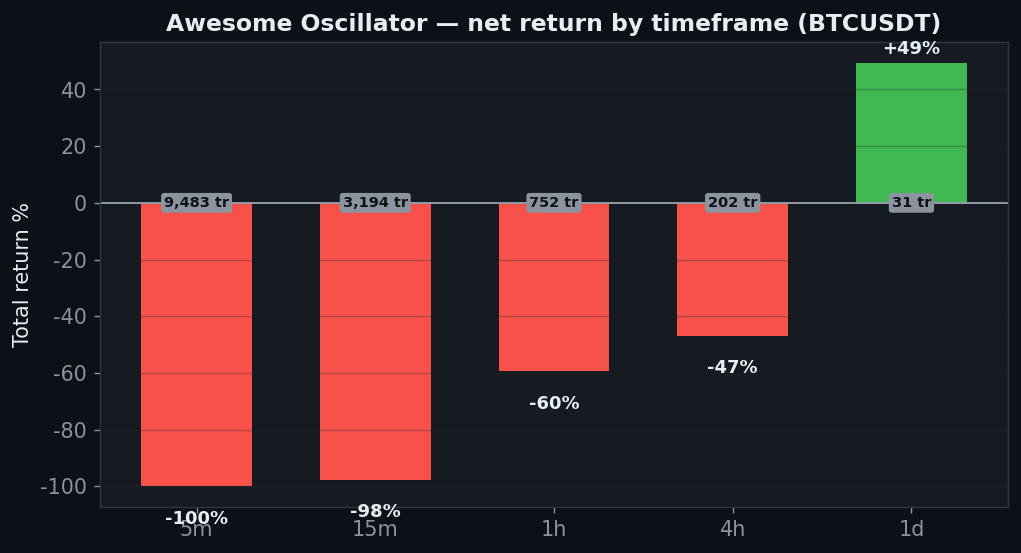
| Timeframe | Trades | Gross (0 fee) | Net (real) |
|---|---|---|---|
| 5분 | 9,483 | −10% | −100% |
| 15분 | 3,194 | +5% | −98% |
| 30분 | 1,548 | −35% | −90% |
| 1시간 | 752 | +0% | −60% |
| 2시간 | 336 | +98% | +32% |
| 4시간 | 202 | −32% | −47% |
| 6시간 | 130 | +4% | −11% |
| 12시간 | 56 | +86% | +74% |
| 1일 | 31 | +55% | +49% |
Only the daily is positive (+49%); the standard 4H loses 47% and is negative even at zero fees. A single working timeframe with the default losing everywhere else is not an edge.
Axis 2 — Slow SMA
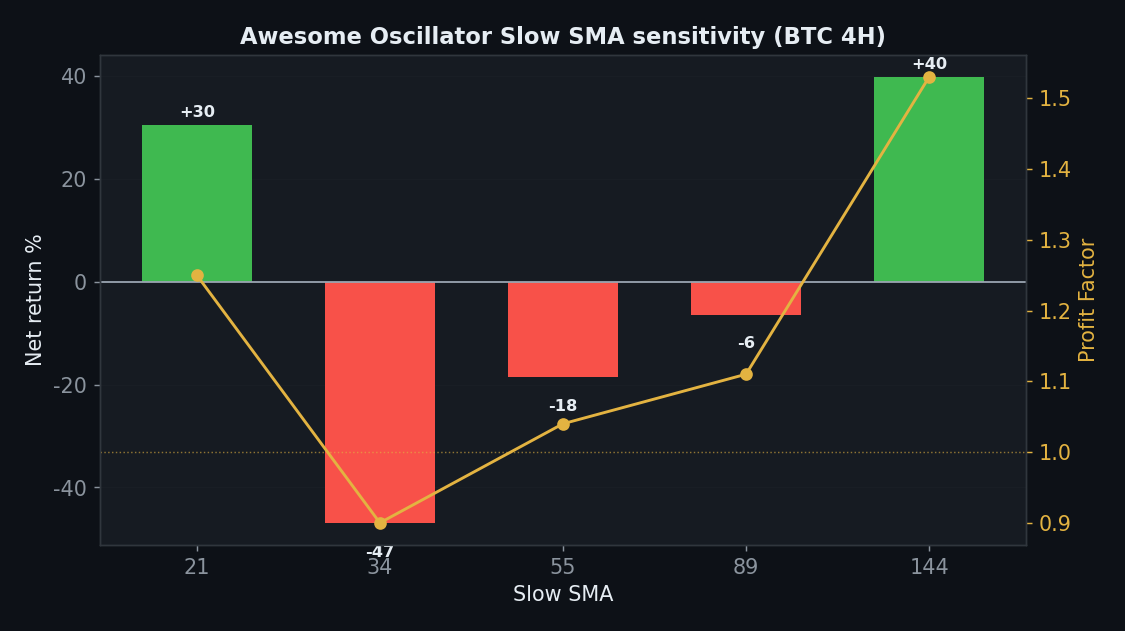
| Slow SMA | Net | PF |
|---|---|---|
| 21 | +30% | 1.25 |
| 34 | −47% | 0.90 |
| 55 | −18% | 1.04 |
| 89 | −6% | 1.11 |
| 144 | +40% | 1.53 |
The default slow length (34) loses. Only the extremes — 21 and 144 — are positive, with everything in between negative. The taught setting sits in a losing zone; the wins are non-adjacent outliers.
Axis 3 — TP:SL
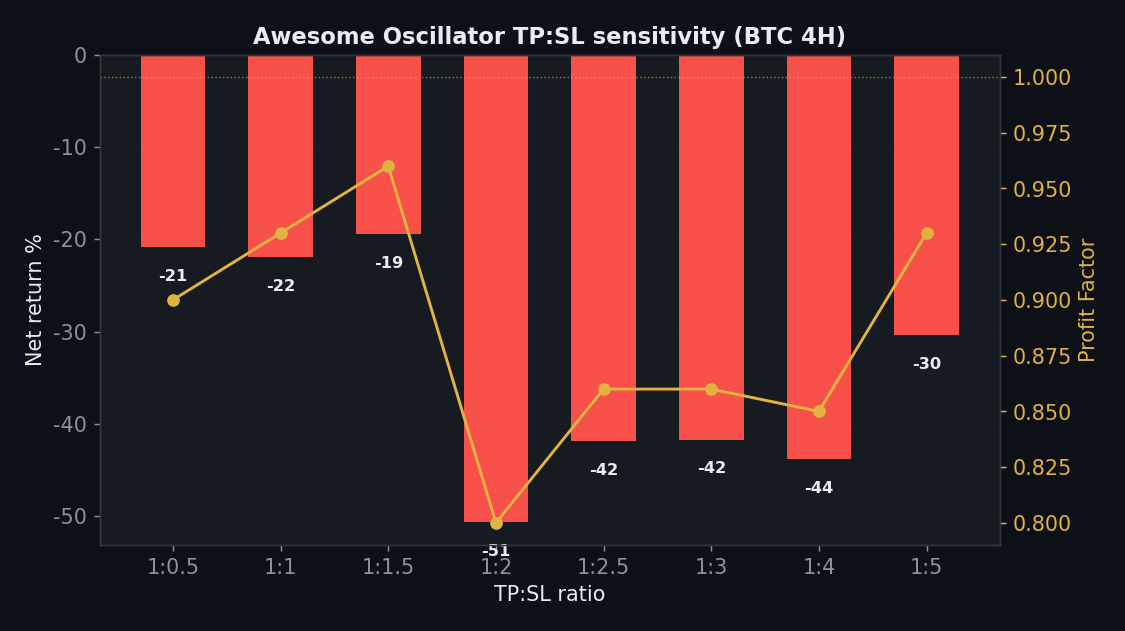
| TP:SL | Net | PF |
|---|---|---|
| 1:0.5 | −21% | 0.90 |
| 1:1 | −22% | 0.93 |
| 1:1.5 | −19% | 0.96 |
| 1:2 | −51% | 0.80 |
| 1:2.5 | −42% | 0.86 |
| 1:3 | −42% | 0.86 |
| 1:4 | −44% | 0.85 |
| 1:5 | −30% | 0.93 |
All eight TP:SL ratios lose. As with the HMA, there is no gross edge for any exit to protect.
Axis 4 — Five Coins
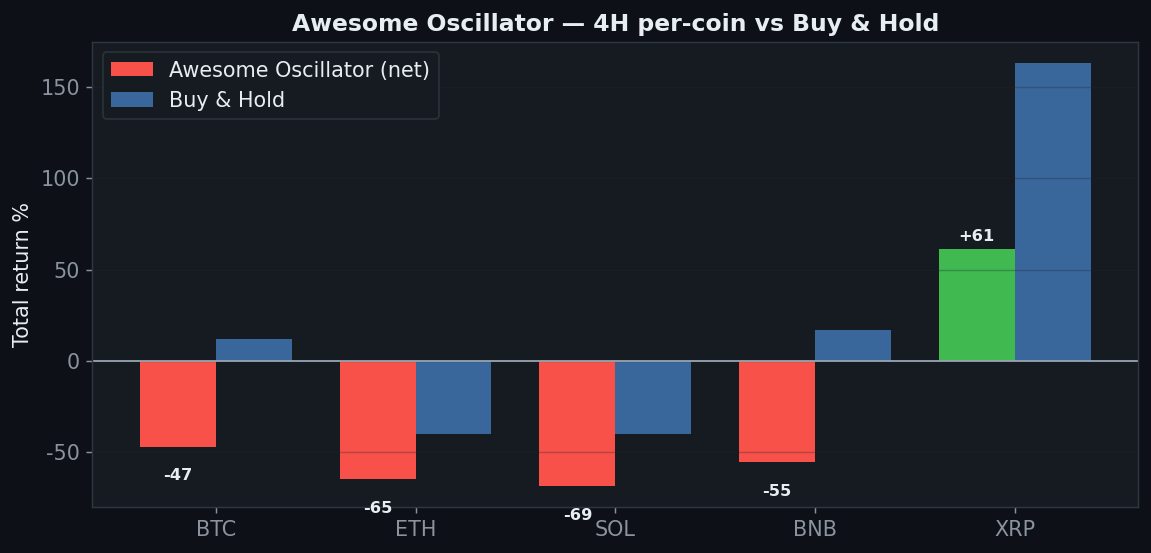
| Coin | Strategy net | Buy & Hold |
|---|---|---|
| BTC | −47% | +12% |
| ETH | −65% | −40% |
| SOL | −69% | −40% |
| BNB | −55% | +17% |
| XRP | +61% | +163% |
Only 1 of 5 coins (XRP) is positive; BTC, ETH, SOL and BNB all lose 47–69%. The signal is broadly destructive across markets.
Axis 5 — Yearly
| Year | BTC 4H net |
|---|---|
| 2024 | +31% |
| 2025 | −49% |
| 2026 | −21% |
2024 +31%, then 2025 −49% and 2026 −21%. One good year, two bad — the same fading pattern as the other rejects.
Axis 6 — Friction
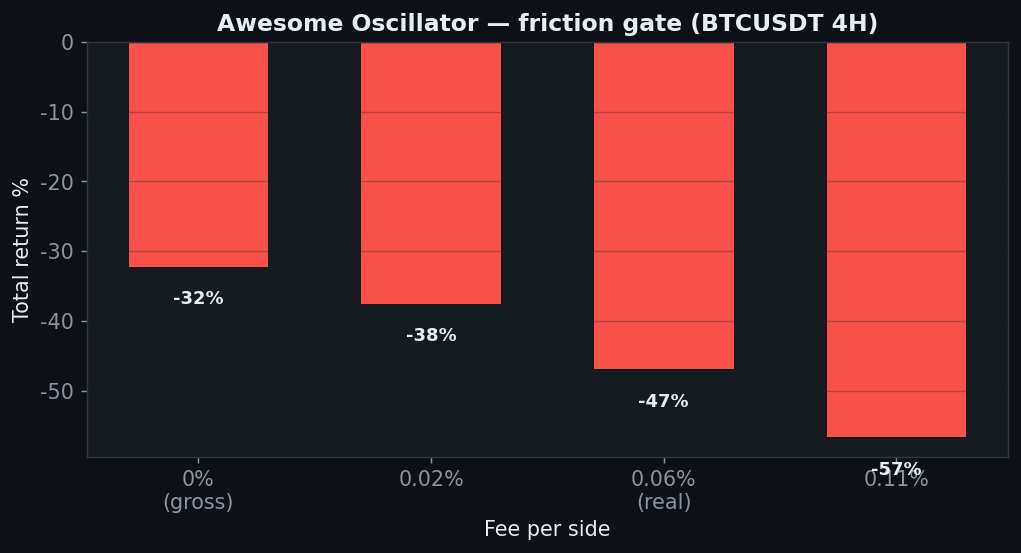
−32% gross → −47% net → −57% at 0.11%. A losing signal made worse by 202 trades of cost.
The Verdict: REJECT
- Gate 0 — Indicator fidelity — pass (standard AO 5/34)
- Gate 1 — Sanity — pass
- Gate 2 — Friction — fail — −32% gross, −47% net on 4H
- Gate 3 — Yearly — fail — +31 / −49 / −21
- Gate 4 — Robustness (length) — fail — the default 34 loses; only outliers 21/144 win
- Gate 5 — Robustness (TP:SL) — fail — 0 of 8 positive
- Gate 6 — Multi-market — fail — 1 of 5 coins
- Gate 7 — vs Buy & Hold — fail — negative on 4 of 5 timeframes
The Awesome Oscillator’s zero-line cross is a laggy dual-SMA crossover, and it behaves like one: the standard 5/34 loses 47% on BTC 4H (negative before fees), every TP:SL ratio loses, and only 1 of 5 coins survives. The one positive timeframe is the daily — while the default setting loses everywhere else. A momentum oscillator with no momentum edge. Reject.
FAQ
The AO has other signals (twin peaks, saucer) — did you test those?
No — those are discretionary pattern reads that can’t be mechanized without ambiguity. We tested the one unambiguous rule, the zero-line cross. The subjective signals would need their own defined, testable rules first.
It’s positive on the daily though.
On one timeframe, while the standard setting loses on the other four and on 4 of 5 coins. One green cell in a sea of red is noise, not a strategy.
Can I replicate this?
Yes — AO(5/34) zero cross, public Binance data, 0.06%/side, five coins, nine timeframes. Every table reproduces.
See also the rejects Keltner and Donchian, and the conditional Vortex.
Disclaimer: educational research, not financial advice. Past performance does not guarantee future results. Never trade money you cannot afford to lose.